Transcription
Supply Sector: Oil and GasINVESTMENT DECISION-MAKINGIN THE OIL AND GAS SUPPLY SECTORSINTRODUCTIONIt is appropriate to begin this White Paper entitled “Investment Decision-Makingin the Oil and Gas Supply Sectors” with the quote from Robert S. Pindyck, a well-knowneconomics professor at MIT:“Despite its importance to economic growth and market structure, theinvestment behavior of firms, industries, and countries remains poorlyunderstood. Economic models have had a limited success in explaining andpredicting changes in investment spending”. . . . .(Pindyck, 1991).The above comment by Pindyck is equally true today as it was in 1991,particularly on how “price foresight” is used in making investment decisions in theenergy supply sector. Still, observations from over two decades of data on investmentsin oil, gas and coal supply help provide empirical evidence of how industry investmentsrelate to prices, cash flow and other decision variables, as set forth in this White Paper.PURPOSEThe purpose of this White Paper is to provide an independent perspective onhow industry makes capital investment decisions in the oil and gas supply sector. Assuch, this White Paper will address three topics:1. How are expectations about future market prices formed;2. What factors are central to making investment decisions in the oil and gas supplysector; andJanuary 21, 2008December 2007 Review Comments IncorporatedJAF028029.DOC1Vello A. KuuskraaAdvanced Resources International
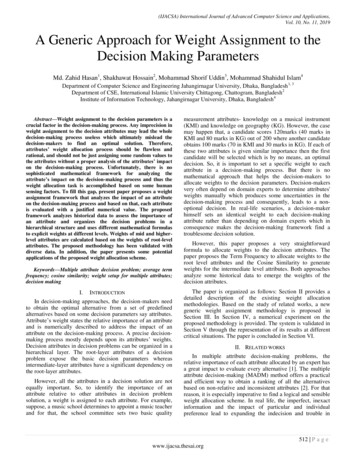
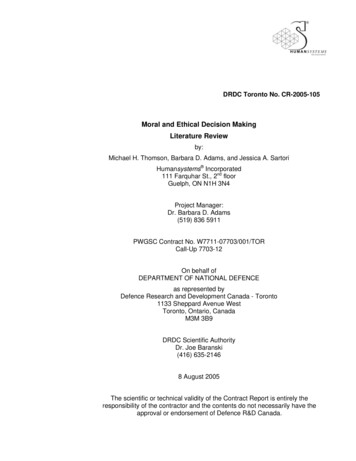
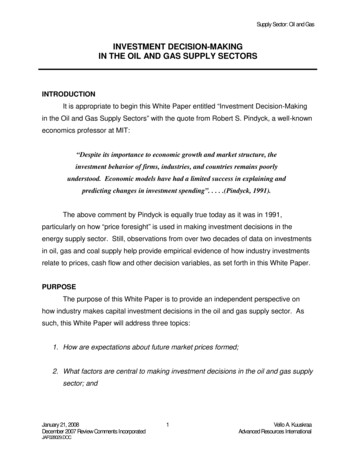
Supply Sector: Oil and Gas3. To what extent is “perfect foresight”, with respect to future prices, used in makinginvestment decisions in the oil and gas supply sectors.The intended use of the information in this White Paper is to provide insights asto whether and how the National Energy Modeling System (NEMS) might be revised inthe way the oil and gas supply modules incorporate price (and cost) expectations informulating supply investment decisions.Currently NEMS, in general, uses the economic paradigm of “perfect foresight” inrepresenting how the energy supply sector investment function operates. (However, theoil and gas supply models use the minimum of the current price and the five yearaverage price for making investment decisions.) This theoretically convenient paradigmhas been challenged, calling for a review of the validity of the use of “perfect foresight”in NEMS. A key aspect of the review is to provide information, supported by publicliterature and other verifiable data, on how overall capital investment decisions aremade by the oil and natural gas supply sectors.HISTORICAL REVIEW OF OIL AND GAS PRICESAfter years of relative stability, oil and natural gas prices began to fluctuate andthen increase sharply in recent years, adding uncertainty as to what is the appropriateprice track for making long-term investment decisions. Oil prices (WTI spot) were relatively stable for tens years, from the early 1990s tothe early 2000s. During this time, oil prices ranged from 20 to 30 per barrel(nominal) with one sharp decline to below 15 per barrel in 1998. Since 2003, oilprices have climbed steadily to over 90 per barrel at the end of 2007, Figure 1.January 21, 2008December 2007 Review Comments IncorporatedJAF028029.DOC2Vello A. KuuskraaAdvanced Resources International
Supply Sector: Oil and GasFigure 1. Annual Average U.S. Crude Oil PricesCrude Oil, WTI Spot (Nominal Dollars Per Barrel) 60 50Period of Relative Price Stability 40 30 20 1995 01994Crude Oil P rices (D ollars P er Barrel) 70YearSource: EIA/Short-Term Energy Outlook, July 2007JAF20 070 42 .XLSJAF02700.PPTJanuary 21, 2008December 2007 Review Comments IncorporatedJAF028029.DOC3Vello A. KuuskraaAdvanced Resources International
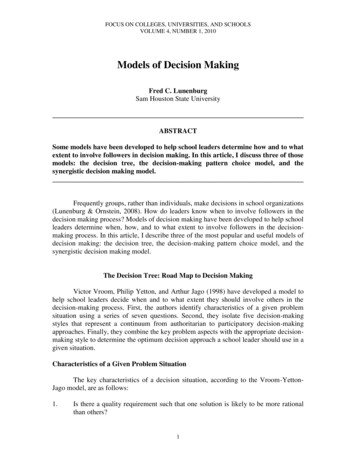
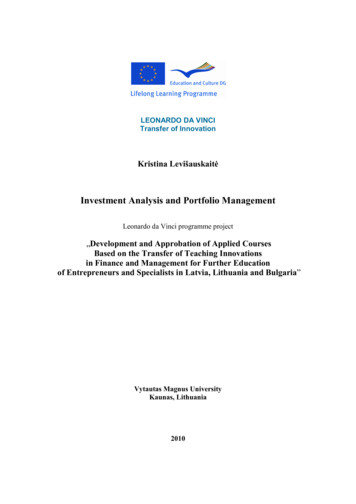
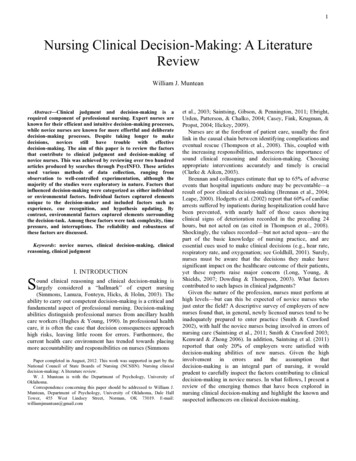
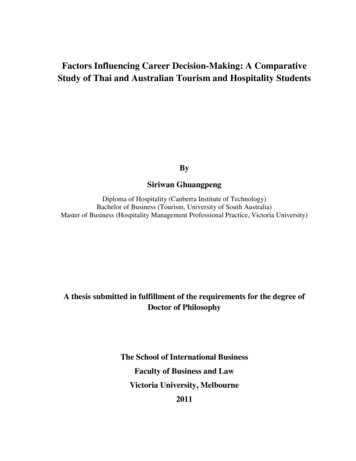
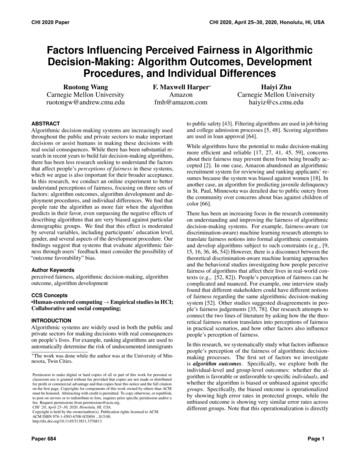
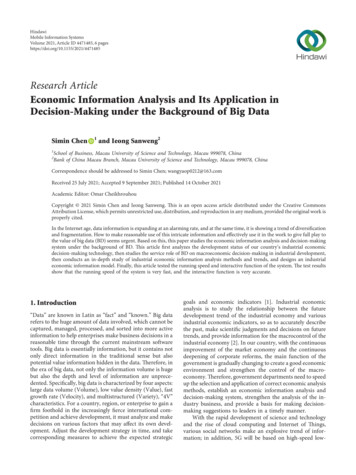
Supply Sector: Oil and Gas Natural gas prices (Henry Hub spot) had their own, more than a decade, periodof price stability (from mid 1980s through 1999). During this time, natural gasprices averaged about 2/Mcf, with a modest price spike in 1996/97. Since 1999,natural gas prices have experienced major volatility. Prices doubled from thesehistorical levels in 2000, then declined, only to reach a new high of 9/Mcf in2005, Figure 2. Weekly natural gas prices experienced even more volatility,reaching a high of 13/Mcf in the winter of 2005/2006 and a low of 5/Mcf in thefall of 2006, Figure 3. Of particular interest is the recent sharp divergence of oiland natural gas prices, from their traditional relationships, adding furtheruncertainty to future price expectations for natural gas, Figure 4.This historical review of oil and natural prices provides background and contextfor examining price expectations for capital investment decision-making in these twoimportant energy supply sectors.January 21, 2008December 2007 Review Comments IncorporatedJAF028029.DOC4Vello A. KuuskraaAdvanced Resources International
Supply Sector: Oil and GasFigure 2. Annual Average U.S. Natural Gas PricesNatural Gas, Henry Hub Spot (Nominal Dollars Per Mcf)Natural Gas (Dollars per Mcf) 10 9 8 7 6Period of RelativePrice Stability 5 4 3 2 9951994 0YearSource: EIA/Short-Term Energy Outlook, July 2007JAF20 07 042 .XLSJAF02700.PPTJanuary 21, 2008December 2007 Review Comments IncorporatedJAF028029.DOC5Vello A. KuuskraaAdvanced Resources International
Supply Sector: Oil and GasFigure 3. Weekly U.S. Natural Gas PricesNYMEX (Nominal Dollars Per Mcf) 15.00 12.00 9.00 6.00 3.00 0.0020002001200220032004200520062007Source: BloombergJAF02700.PPTJanuary 21, 2008December 2007 Review Comments IncorporatedJAF028029.DOC6Vello A. KuuskraaAdvanced Resources International
Supply Sector: Oil and GasFigure 4. Relationship of Oil and Natural Gas Prices /Bbl /MMBtu100.0015.00WTI Crude(left scale)80.0012.0060.0040.009.00Henry HubNatural Gas(right scale)6.0020.003.000.000.001994 1995 1996 1997 1998 1999 2000 2001 2002 2003 2004 2005 2006 2007 2008Source: Bloomber gJAF027 00.PPTJanuary 21, 2008December 2007 Review Comments IncorporatedJAF028029.DOC7Vello A. KuuskraaAdvanced Resources International
Supply Sector: Oil and GasALTERNATIVE SOURCES FOR PRICE PROJECTIONSIn addition to the price projections in EIA’s AEO, a variety of sources provideprice forecasts, expectations and guidelines for making investment decisions by the oiland natural gas industry. These sources (whose price projections are regularlyreviewed in the AEO), include firms such as GII (Global Insight, Inc.), EVA (EnergyVentures Analysis, Inc.), EEA (Energy and Environmental Analysis, Inc.), DB (DeutscheBank), SEER (Strategic Energy and Economic Research, Inc.), and Altos (AltosPartners North American Regional Gas Model). In addition, numerous other firmsprovide private, confidential guidance on projections of energy prices, such as CERA(Cambridge Energy Research Associates).Table 1, below provides a brief comparison of the oil and natural gas priceprojections for year 2025 in EIA’s AEO 2007 and the range of price projections providedby other sources (listed above).Table 1. Comparison of Price Projections for Year 2025World Oil Prices(2005 /Bbl)Natural Gas Prices(Lower-48 Wellhead, 2005 /Mcf)EIA AEO 2007Reference CaseOther Sources 55.72 39.95 - 52.60 7.51 5.61 - 6.96These various sources for price projecting each have their industrialconstituencies. This variety of information helps shape and add complexity to theenergy supply industry’s investment decisions.January 21, 2008December 2007 Review Comments IncorporatedJAF028029.DOC8Vello A. KuuskraaAdvanced Resources International
Supply Sector: Oil and GasREVIEW OF PAST OIL AND NATURAL GAS PRICE PROJECTIONSOne challenge industry faces in using oil and natural gas price projections (byAEO and other sources) is the significant differences that have occurred betweenprojected and actual prices. EIA provides valuable information on this topic byexamining the reliability of its own oil and natural gas price projections. While we havenot undertaken a rigorous review of the price projections provided by other sources, webelieve that the track record of these other price projection sources is similar to that ofEIA.The materials below provide a comparison of EIA AEOs expected and actualyear 2005 prices for oil and natural gas.Crude Oil Prices. World oil prices in the past ten AEOs have tended to beunderestimated, leading to overestimation of consumption, Table 2. Even more severeprice underestimations have occurred for 2007 world oil prices, currently at about 95per barrel.Table 2. World Oil Price Comparison (Nominal per Barrel)AEO YearExpectedYear 2005 PriceActualYear 2005 Price% Difference1996 29.87 48.85-39%1998 25.27 48.85-48%2000 23.23 48.85-52%2002 25.66 48.85-48%2004 24.45 48.85-50%Natural Gas Prices. Natural gas has had the largest difference between priceprojections and actual price data. In recent years, NEMS has severely underestimatedfuture gas prices, as shown for five of the past AEOs projections of natural gas pricesfor year 2005 (nominal per Mcf) compared to actual year 2005 price, Table 3.January 21, 2008December 2007 Review Comments IncorporatedJAF028029.DOC9Vello A. KuuskraaAdvanced Resources International
Supply Sector: Oil and GasTable 3. Natural Gas Wellhead Price Comparison (Nominal per Mcf)AEO YearExpectedYear 2005 PriceActualYear 2005 Price% IP OF PRICES AND COSTSOne of the major considerations in deciding how to use future prices (priceprojections) for making investment decisions is judging how future costs will track futureprices. Historical data, assembled by EIA as part of the FRS company reporting system,clearly shows that changes in oil and gas lifting costs as well as changes in upstreamfinding costs (finding costs also include well productivity) are closely related to changesin oil and natural gas prices.When examining the oil and natural gas price expectations of the IndependentProducers and Lenders (Bankers) made in year 2004, it is instructive to note that bothgroups anticipated increases in costs equal to or in excess of increases in prices, asshown in Table 5:Table 5. Long Term (Post 2008) Expectations for Prices and CostsAnnual IncreasesPost Year 2008Natural GasCrude OilBankersProducersBankersProducers Prices of Fuel1.25%2.33%1.25%1.67% Costs of Production1.50%1.67%1.50%1.67%January 21, 2008December 2007 Review Comments IncorporatedJAF028029.DOC10Vello A. KuuskraaAdvanced Resources International
Supply Sector: Oil and GasThe insight to be derived from these price and cost expectations are that Lenders(Bankers) expected costs increases to outpace oil and natural gas price increases.Producers expected costs and prices to track for crude oil but believed that for naturalgas, higher future prices and an increasing economic margin might enable additionalprojects to meet an economic threshold.Because costs have risen so dramatically in the past few years, it is useful totake a more in-depth look at the relationship of prices and costs and how this may beaffecting investment decisions.1. Changes in Oil and Gas Well Drilling Costs. After years of relative stability,the drilling costs for crude oil, natural gas and dry wells have increased sharply in recentyears, Table 6 (real chained 2000 dollars).Table 6. Changes in Oil and Gas Well Drilling CostsYear /WellChange (5 Years ,200(31,000)-6.2%1995557,400 87,200 18.5%2000754,600 197,200 35.4%20051,526,300 771,700 102.3%The data show that since 1985, the drilling costs per well have more than tripled,in real dollars. Preliminary data for 2006 and 2007 indicate that the costs for well drillinghave continued to increase, driven by high rig day rates, high prices for steel, andrapidly escalating costs of oil field services and labor.Figure 5, from EIA AEO 2007, captures the sharp recent rise in drilling costs foronshore natural gas development wells (7,500 to 9,999 feet) from 1996 to 2004, in real2004 dollars per well.January 21, 2008December 2007 Review Comments IncorporatedJAF028029.DOC11Vello A. KuuskraaAdvanced Resources International
Supply Sector: Oil and GasFigure 5. Drilling Costs for Onshore Natural Gas Development Wells at Depthsof 7,500 to 9,999 Feet, 1996-20042004 dollars per 004Source:JAF02700.PPTJanuary 21, 2008December 2007 Review Comments IncorporatedJAF028029.DOC12Vello A. KuuskraaAdvanced Resources International
Supply Sector: Oil and Gas2. Examination of Cost/Price Relationships. As shown on Table 7, in the past10 years oil and gas well costs have increased as fast or faster than oil and natural gasprices.Table 7. Costs of Crude Oil and Natural Gas Wells Drilled andAnnual Average U.S. Oil and Natural Gas PricesWell Costs (All Wells)Prices (Nominal)Nominal*Real **Natural Gas(Henry Hub Spot)Crude Oil(WTI Spot)( /Ft)( /Ft)( /Mcf)( 06.9566.02*Nominal cost escalation of 17.5% for 2006**Real 2000 dollarsSource: Well costs, EIA data based on API 2005 JAB (June 2007). Prices, EIA Short Term Energy Outlook (July 2007).The information on the relationship between oil and gas well costs and prices,presented in Table 7, is further evaluated and summarized below: For natural gas, well costs have risen faster than wellhead prices in both themost recent 10 year and the most recent five year time period (prices andcosts in nominal dollars).Time PeriodIncreasein Well CostsIncreasein Natural Gas Prices10 Years (1996 – 2006)X 4.0X 2.45 Years (2001- 2006)X 2.0X 1.7January 21, 2008December 2007 Review Comments IncorporatedJAF028029.DOC13Vello A. KuuskraaAdvanced Resources International
Supply Sector: Oil and Gas For crude oil, well costs have risen about the same as oil prices in the mostrecent 10 year time period, but somewhat less than prices in the most recentfive year period (prices and costs in nominal dollars).Time PeriodIncreasein Well CostsIncreasein Crude Oil Prices10 Years (1996 – 2006)X 4.0X 4.05 Years (2001- 2006)X 2.0X 2.5The overall persistent and close relationship between increases in well costs andincreases in oil and gas wellhead prices lead producers to use constant values for oiland gas prices and costs in making investment decisions.ESTABLISHING GUIDELINES FOR FUTURE PRICESSignificant differences exist among individual companies and types of companiesin their formulation of price expectations for making long-term capital investmentdecisions. Major oil companies have Economics Departments that invest significantly inunderstanding market fundamentals, using this information to provide a corporate-wide“price deck” to be used for evaluating investment options. In contrast, the independentsector of the oil and gas industry relies much more on private “energy forecasting” firmsand lenders for establishing their price outlook. Major Oil Companies. The large, integrated oil and natural as companies, such asBP, Chevron, ConocoPhillips and Shell, use an internally generated “price deck” forevaluating investment options and deciding which of these investment options toincorporate into the annual capital investment budget.In general, although the actual “price deck” information is kept confidential, some ofthis information is divulged in public announcements. One common “price deck”model uses a lagging three year average of prices, held constant (in real terms) forfuture years. This provides a conservative, “backward looking” expectation for futureJanuary 21, 2008December 2007 Review Comments IncorporatedJAF028029.DOC14Vello A. KuuskraaAdvanced Resources International
Supply Sector: Oil and Gasoil and natural gas prices. Another major company’s “price deck” model relies onthe principle of “revision to the mean”. This model was popular in the late 1990s andearly 2000s, leading to several of the major oil companies using much lower oil priceexpectations of 15 to 20 per barrel, even after oil prices exceed 30 per barrel.In recent years, major companies have steadily increased the values used in the“price deck”, either by incorporating newer (and higher) price data into the three yearaverage or by benchmarking a higher value for the “mean.” Independent Oil and Gas Companies and Banks. To a large extent, theindependent oil and gas companies, net borrowers of capital, rely on oil and gasprice forecasts and expectations provided by outside firms and bankers.In general, the price outlook by bankers is less optimistic than by independentproducers. For example, the OGJE/Madison Energy Advisors’ pricing poll (in early2004) shows the significant differences in the expectations by Bankers and byProducers for future natural gas and crude oil prices, Table 8 and Table 9.Table 8. Natural Gas Price Expectations ( /MM Btu, Henry Hub Spot)BankersProducersDifferenceCurrent Year (2004) 4.00 4.85- 0.852007 3.63 4.34- 0.712008 3.65 4.40 -0.75Price Cap 4.25 6.00- 1.75Table 9. Crude Oil Price Expectations ( /Bbl, WTI Spot)BankersProducersDifferenceCurrent Year (2004) 24.61 26.45- 1.842007 23.65 25.18- 1.542008 23.96 25.35- 1.39Price Cap 32.50 32.50-January 21, 2008December 2007 Review Comments IncorporatedJAF028029.DOC15Vello A. KuuskraaAdvanced Resources International
Supply Sector: Oil and GasFACTORS CENTRAL TO INVESTMENT DECISION-MAKING FOR ENERGY SUPPLYThe above review of price forecasts and expectations provides a useful startingpoint for understanding how expectations about future market prices are formed.However, price expectations are only of the factors that help form investment decisionsin the energy supply sector. Other key factors central to investment decision-making inthe energy supply sector include: Cash Flow. The amount of annual investment that a company makes isgoverned greatly by its cash flow (and the borrowing capacity this cash flowwill support). Figure 6 shows that the annual cash flow from operations trackclosely with the E&P investment decision made by major oil and gascompanies Cost and Margin Expectations. The key variable for evaluating return oninvestment is the economic margin, the difference between prices and costs.As such, in addition to price expectations, an equally central investment factoris expectations for changes in costs. Portfolio of Opportunities. A third factor central to investment decisions inthe energy supply sector is the portfolio of upstream opportunities available toindividual companies, as well as to the overall industry. In recent years, anumber of major companies have used their cash flow to “buy back” companystock, implying a lack of investment opportunities that would provide a higherreturn on investment than their existing portfolio of past investments. Other Factors. In addition to the above, a number of other factors enter aninvestment decision in energy supply, including market demand, access toresources, and acceptable risk.January 21, 2008December 2007 Review Comments IncorporatedJAF028029.DOC16Vello A. KuuskraaAdvanced Resources International
Supply Sector: Oil and GasFigure 6. Cash Flow from Operations and Exploration and Production (E&P) Expendituresfor FRS Companies, 1986-2005180160Cash Flow from OperationsBillion Dollars (2005)140120E&P 9860YearJAF 20070 42. XLSSource: Performance Profiles of Major Energy Producers 2005JAF02700.PPTJanuary 21, 2008December 2007 Review Comments IncorporatedJAF028029.DOC17Vello A. KuuskraaAdvanced Resources International
Supply Sector: Oil and GasUSE OF “PERFECT FORESIGHT” FOR INVESTMENT DECISION-MAKINGGiven the information assembled and presented on the energy supply industry’sinvestment decision-making, it appears that “perfect foresight”, while a convenient,unifying paradigm, is not a guiding principle in actual investment decisions. Examination of past price productions shows a wide disparity betweenprojected and actual prices, Changes in costs, often equal to changes in prices, argue that the economicmargin for justifying investments can be approximated reliably by usingsimilar escalation factors for costs as used for prices, Few, if any, significant energy supply companies use models based on“perfect price foresight” for making energy investments. Bankers and otherindustry analyses would view those who use such price expectations,particularly to justify investing in projects requiring a rising price to make theinvestment economic, to be overly aggressive and insufficiently prudent.January 21, 2008December 2007 Review Comments IncorporatedJAF028029.DOC18Vello A. KuuskraaAdvanced Resources International
Supply Sector: Oil and GasCONCLUDING DISCUSSION AND RECOMMENDATIONSBased on the above review and information, the White Paper makes thefollowing recommendations for improving the modeling of investment decisions in the oil,natural gas supply industry.Recommendation #1. Relate Annual Investment to Actual/ Expected CashFlow. The historical data, plus considerable prior experience, show that the oil andnatural gas supply industry scales its annual investment to actual and expected cashflow. For large energy companies (particularly the high market cap FRS companies,listed in Attachment 1), annual investment has traditionally ranged from 70%to 90% of cash flow, Table 10, including profits from operations, cash fromdepreciation/amoritization, plus net new borrowings and equity offerings, afterdistribution of dividends. Table 11 provides additional detail on the sourceand uses of cash by FRS companies.Table 10. Relationship of Annual Investment to Annual Cash Flow, FRS CompaniesCash FlowAdditions toInvestment% Cash FlowUsed for 4.182%January 21, 2008December 2007 Review Comments IncorporatedJAF028029.DOC19Vello A. KuuskraaAdvanced Resources International
Supply Sector: Oil and GasTable 11. Sources and Uses of Cash for FRS Companies, 2003-2006 (Billion Dollars)2003200420052006Cash Flow from Operations105.1135.8169.9193.6Proceeds from Long-Term Debt26.418.529.687.1Proceeds from Disposals of Assets16.119.735.941.6Proceeds from Equity Security Offerings8.48.110.522.6Additions to Investment in Place80.086.5132.9194.7Reductions in Long-Term Debt26.218.433.355.2Dividends to Shareholders42.836.539.738.5Purchase of Treasury IN SOURCES OF CASHMAIN USES OF CASHOther Investment and Financing Activities, NetNet Change in Cash and Cash EquivalentsSource: Energy Information Administration, Form EIA-28 (Financial Reporting System). For mid-size energy companies, capital investment for E&P has traditionallybeen in excess of 100% of cash flow, as borrowing and issuance of equity(often equal to cash flow from operations) has been used to drive growth.Figure 7 provides net cash flow and capital investment information, for years2006 and 2007, for a mid-size oil and gas company, showing annualinvestments equal to more than twice the internal cash flow.January 21, 2008December 2007 Review Comments IncorporatedJAF028029.DOC20Vello A. KuuskraaAdvanced Resources International
Supply Sector: Oil and GasFigure 7. Relationship of Capital Investment to Cash Flow - - A Mid-Size Energy Company2006Actual2007 GuidanceNYMEX Price Assumptions 7.23 Gas 64.74 Oil 7.00 Gas 70.00 Oil 162.6 MM 200 - 205 MM 0.95 1.16 - 1.19 Operating Income 246.3 MM 355 - 360 MM Net Cash Flow (1) 413.5 MM 610 - 620 MM EBITDA (1) 414.5 MM 630 - 640 MM CapEx 942.4 MM 1,455 MM Net Income EPSNote:Guidance updated as of October 31, 2007. 2006 oil and gas prices include actual last-day NYMEX closing prices.(1)Net cash flow is net cash flow before changes in operating assets and liabilities. Net cash flow and EBITDA are non-GAAP financial measures. See explanationand reconciliation of non-GAAP financial measures on pages 41 and 42.JAF02700.PPTJanuary 21, 2008December 2007 Review Comments IncorporatedJAF028029.DOC21Vello A. KuuskraaAdvanced Resources International
Supply Sector: Oil and GasRecommendation #2. When Calculating Expected Cash Flow Include anAlgorithm That Relates Future Prices to Future Costs. The historical data showsthat the costs of developing oil and natural gas are closely linked to prices, as discussedabove. As such, we make two suggestions within Recommendation #2: Develop a rigorous relationship between costs and prices in the NEMS model,including accounting for the energy component of oil and natural gas fielddevelopment (e.g., diesel fuel for drilling; natural gas for compression, etc.)and the relationship of higher (or lower) prices on anticipated industry activityand available capacity (e.g., rig utilization). Build a series of sectoral models, for oil and gas E&P, that provide estimatesof economic margins and cash flow, using expectations of future prices andfuture (price related) costs.Recommendation #3: Use Conservative Estimate for Future Prices. Theprice decks and price guidelines used by industry are heavily weighted by “backwardlooking” rather than “forward looking” information. The price declines of the mid-1980sand late 1990s, when oil prices (WTI Spot) dropped below 15 per barrel, are still freshreminders of the pain and bankruptcy that optimistic price expectations can yield.Instead of using “perfect foresight” price projections in the NEMS model, whichthemselves have a mixed record of accuracy, industry uses a variety of relativelyconservative price projection models for making investment decisions. An importantnote is that, in general, companies have more investment opportunities than investmentdollars (see above discussion on cash flow). As such, industry is comfortable in using aconservative price with which to screen investment opportunities, selecting the onesthat give them the more favorable financial returns or help position them strategically forfuture opportunities.January 21, 2008December 2007 Review Comments IncorporatedJAF028029.DOC22Vello A. KuuskraaAdvanced Resources International
Supply Sector: Oil and GasThe price projection models used by industry fall into three groupings, dependingon the size and nature of the company: Aggressive – These companies tend to use the NYMEX Strip (Table 12) forthe near-term (next 3 to 5 years), with hedging, and a constant price thereafter.Table 12. NYMEX Futures for Oil and Natural Gas PricesNYMEX Futures(Light Sweet Crude Oil, Bbl)NYMEX Futures(Henry Hub, /Mcf)December, 2007 95.10 7.79December, 2008 86.94 8.87December, 2009 83.36 8.85December, 2010 82.86 8.64December, 2011 82.98 8.47December, 2012 83.31 8.32 Moderate – These companies tend to use a weighted three year average oflatest prices, escalated for inflation Conservative – These companies tend to use the lowest price value from thepast three years of prices, escalated for inflation.January 21, 2008December 2007 Review Comments IncorporatedJAF028029.DOC23Vello A. KuuskraaAdvanced Resources International
Supply Sector: Oil and GasAttachment 1January 21, 2008December 2007 Review Comments IncorporatedJAF028029.DOC24Vello A. KuuskraaAdvanced Resources International
Supply Sector: Oil and GasHome Energy Finance The FRS Survey FRS Respondent CompaniesFRS Respondent CompaniesMajor energy-producing companies based in the United States annually report their worldwide financial and operatingdata to the EIA on a uniform and standardized basis on the Financial Reporting System (FRS) Form EIA-28. Thesecompanies (the FRS companies) occupy a major position in the U.S. economy. For the 2005 reporting year, 29companies filed this information. In aggregate, their sales equaled about 15 percent of the 9.1 trillion in sales of theFortune 500 corporations. The 2005 reporting companies are:Amerada Hess CorporationKerr-McGee CorporationAnadarko Petroleum, Inc.Lyondell-CITGO Refining, L.P.Apache CorporationMarathon Oil CorporationBP America, Inc.Motiva Enterprises, L.L.C.Burlington Resources Inc.Occidental Petroleum CorporationChesapeake Energy CorporationPremcor, Inc.Chevron CorporationShell Oil CompanyCITGO Petroleum CorporationSunoco, Inc.ConocoPhillips Petroleum CompanyTesoro Petroleum CorporationDevon Energy CorporationTotal Holdings USA, Inc.Dominion Resources, Inc.Unocal CorporationEl Paso CorporationValero Energy CorporationEOG Resources, Inc.The Williams Companies, Inc.Equitable Resources, Inc.XTO Energy, Inc.Exxon Mobil CorporationATTACHMENT 1January 21, 2008December 2007 Review Comments IncorporatedJAF028029.DOC25Vello A. KuuskraaAdvanced Resources International
Producers and Lenders (B ankers) made in year 2004, it is instructive to note that both groups anticipated increases in costs equal to or in excess of increases in prices, as shown in Table 5: Table 5. Long Term (P ost 2008) Expectations for Prices and Costs Annual Increases Natural Gas Crude Oil Post Year 2008 Bankers Producers Bankers Producers