Transcription
Heikin-Ashi (Average Bar)Its Attributes & Application to Japanese MarketFeng Han, CFA, CMTFIL Investments (Japan)Oct. 10th, 2014Fidelity Confidential Information
AgendaI.What is HA?II. The Strengths and Weaknesses of HAIII. The Opportunities of Making HA a Stronger Tool1Source: FIL Tokyo, Bloomberg, Dan Valcu and Sylvain Vervoort
Japanese are Good at Designs/Creations including in the Studies of Technical AnalysisNIKKEI 225 in Candles with Ichimoku Kinkou Chart2Source: FIL Tokyo, Bloomberg, Dan Valcu and Sylvain Vervoort
Heikin-Ashi, A Less Known Under-researched Japanese TA ToolNIKKEI 225 in CandlesNIKKEI 225 in HAWhat is it? Should we use it? What are the pros and cons? How to use it?3Source: FIL Tokyo, Bloomberg, Dan Valcu and Sylvain Vervoort
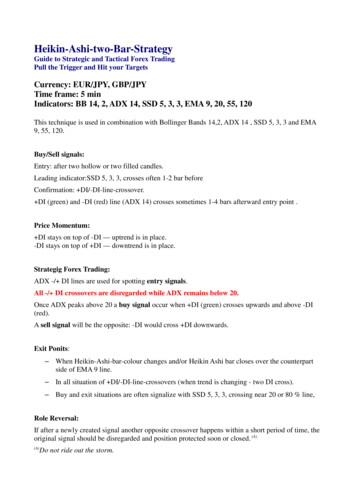
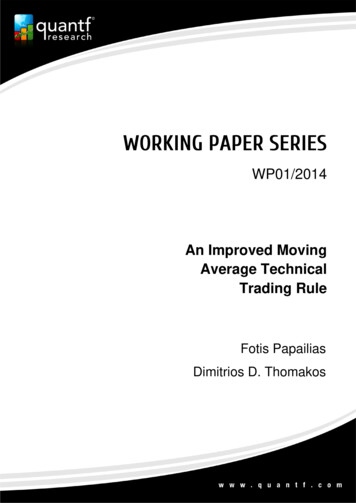
How is Heikin-Ashi MCHAMOMHMLMCExamplePrice emaxminaverageCalculation{MO (t -1), MC (t -1)}{H(t 0), MO(t 0)}{L(t 0), MO(t 0)}{O(t 0), H(t 0), L(t 0), C(t 0)}average*maxminaverageCalculation{0.5, 1.5}{4, 1}{1,1}{2,4,1,3}4HA ChartCandle Chart* assuming MO (t -1) 0.5, MC (t -1) 1.5Source: FIL Tokyo, Bloomberg, Dan Valcu and Sylvain Vervoort
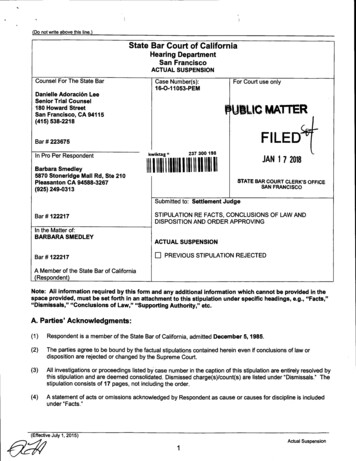
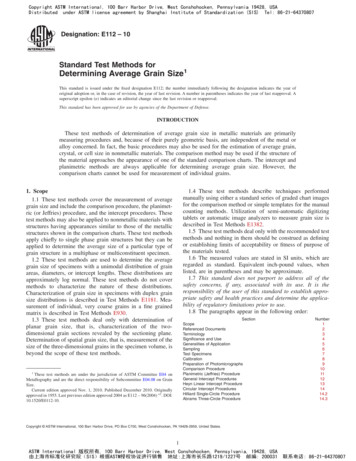
Heikin Ashi represents 2 distinct underlying components:A) A time weighted average of priceB) An embedded Trend indicator98.44%Heikin-Ashi ‘s MO is APPROXIMATELY a time weighted average of Price OHLC over the previous six time periodsHeikin-Ashi is an Embedded Trend Indicator5Source: FIL Tokyo, Bloomberg, Dan Valcu and Sylvain Vervoort
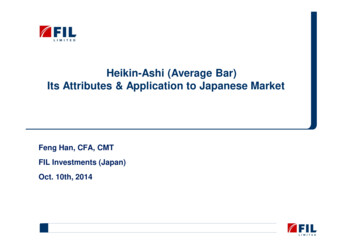
Heikin-Ashi Patterns & Their Implications: Only 3 Basic Patterns1 & 2: hollow candle & filled candlePatternMO vs. PH & PLMC vs. MOTrend ImplicationTrading Actionbig hollow bodyMO LowPrice (PL)MC way above MOstrong uptrendstay with trendbig filled bodyMO HighPrice (PH)MC way below MOstrong downtrendstay with trend3: candle with shadows on both sides6hollow body with lowerPH MO PLshadowsMC still above MO, still above ma, butbut PL below MOuptrend gets weakerfilled body with uppershadowsPH MO PLMC still below MO, still below ma, butwatch outbut PH above MO downtrend gets weaker reversalsspin/dojiPH MO PLMC very close toMOSource: FIL Tokyo, Bloomberg, Dan Valcu and Sylvain Vervoortprice crossing over MAwatch outreversalswatch outreversals
I.What is HA?II. The Strengths and Weaknesses of HAIII. The Opportunities of Making HA a Stronger Tool7Source: FIL Tokyo, Bloomberg, Dan Valcu and Sylvain Vervoort
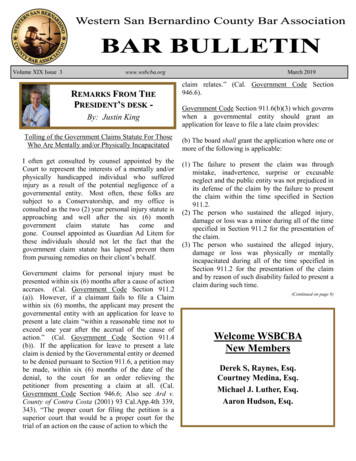
The Strengths of Heikin-Ashi(1) Less is More: Trend & Reversal of Trend Become Clearer with Heikin-AshiWhy? Color change8Price Crossing over MAsSource: FIL Tokyo, Bloomberg, Dan Valcu and Sylvain Vervoort
(2) The Strength of Trend Very Obvious:The Bigger The Body, The Stronger The TrendNIKKEI 225 in HAWhy? The bigger the body, the more powerful the move away from the moving average9Source: FIL Tokyo, Bloomberg, Dan Valcu and Sylvain Vervoort
(3) HA as A Warning Signal upon Emergence of Shadows on Both SidesNIKKEI 225 in Candles6m maNIKKEI 225 in HAWhy? Trend is getting weaker, and price is approaching the moving average10Source: FIL Tokyo, Bloomberg, Dan Valcu and Sylvain Vervoort
(4) HA Delta* as a Price Extremes Detector (Overbought/Oversold)NIKKEI 225 in HAOverboughtOversoldHADelta(MC/MO)Why? HA Delta MC – Mo, a momentum indicator similar to moving average deviations11Source: FIL Tokyo, Bloomberg, Dan Valcu and Sylvain Vervoort
Performance of HA as a Trend Indicator Using Color Changes as Buy/Sell SignalsBack testing MethodologyCover and go long onBuy signals at nextopen price; close andgo short on Sellsignals at next openpricePeriod: 20 years from07/31/1994 07/31/2014Good long term performance, yet interim drawdown could be significant. Why?12Source: FIL Tokyo, Bloomberg, Dan Valcu and Sylvain Vervoort
The Weaknesses of Heikin-Ashi(1) Too Many Noises/Whipsaws, Especially during Range MarketsNIKKEI 225 in CandlesNIKKEI 225 in HA13Source: FIL Tokyo, Bloomberg, Dan Valcu and Sylvain Vervoort
(2) Frequent Delays at the Major Turing PointNIKKEI 225 in CandlesNIKKEI 225 in HAWhy?14MO t 06M Moving Average of Price t ( -1 -6)Source: FIL Tokyo, Bloomberg, Dan Valcu and Sylvain Vervoort
I.What is HA?II. The Strengths and Weaknesses of HAIII. The Opportunities of Making HA a Stronger Tool15Source: FIL Tokyo, Bloomberg, Dan Valcu and Sylvain Vervoort
The Opportunities for Heikin-Ashi Combined with Other IndicatorsProblems16StrategiesAction PlansSource: FIL Tokyo, Bloomberg, Dan Valcu and Sylvain VervoortResults?
Smoothing Methodologies to Reduce Noises/Whipsaws(1) MC / PC 7M MA(2) PC / MO 3M WAV(3) PC/average(MO 3MWAV,PC 6MMA)Back testing MethodologyCover and go long on Buy signals at next open price; close and go short on Sell signals at next open pricePeriod: 20 years from 07/31/1994 07/31/201417Source: FIL Tokyo, Bloomberg, Dan Valcu and Sylvain Vervoort
(1) MC vs. PC’s 7M MAMODEL PERFORMANCE178.66%120.90%BUY-SELL SIGNALS18Source: FIL Tokyo, Bloomberg, Dan Valcu and Sylvain Vervoort
(2) PC vs. MO’s 3M WAVMODEL PERFORMANCE245.54%178.66%BUY-SELL SIGNALS19Source: FIL Tokyo, Bloomberg, Dan Valcu and Sylvain Vervoort
(3) PC vs. Average of (MO’s 3M WAV, PC’s 6M MA)MODEL PERFORMANCE369.21%245.54%BUY-SELL SIGNALS20Source: FIL Tokyo, Bloomberg, Dan Valcu and Sylvain Vervoort
Flaws of PC vs. Average of (MO’s 3M WAV, PC 6M MA) Model: DelaysMODEL PERFORMANCENIKKEI 22521Source: FIL Tokyo, Bloomberg, Dan Valcu and Sylvain VervoortTurning pointRange marketTurning pointTurning pointTurning pointRange marketTurning pointTurning point369.21%
Methodologies to Reduce Delays22Source: FIL Tokyo, Bloomberg, Dan Valcu and Sylvain Vervoort
(1) HADelta Divergence to Rescue at the Market Turning PointsNIKKEI 225 in HAnegative divergencepositive divergence* Requires subjective interpretation, not included in mechanical backtesting23Source: FIL Tokyo, Bloomberg, Dan Valcu and Sylvain VervoortHADelta(MC/MO)
(2) Derivative of HADelta for Earlier Buy-Sell SignalsNIKKEI 225: Monthly HAModified HADelta*: 2M MA vs. 3M MA* Modified Delta PC/3M WAV of MO24Source: FIL Tokyo, Bloomberg, Dan Valcu and Sylvain Vervoort
Performance Improved at Some Turning Points and during Range MarketsDerivative of HADelta MODEL PERFORMANCE335.32%-23.61%NIKKEI 22525Source: FIL Tokyo, Bloomberg, Dan Valcu and Sylvain Vervoort
Further Smoothing vs. Oscillators, or Further Smoothing & Oscillators?369.21%335.31%Correlation between the twomodel’s signal is 0.30626There should be benefits ofcombining trend and momentumSource: FIL Tokyo, Bloomberg, Dan Valcu and Sylvain Vervoort
How to Combine the Trend & Momentum Signals?Trending or NotNikkei 225ADX 20 ?27Use Momentum IndicatorUse Trend IndicatorNikkei Weekly ADX as of Month EndSource: FIL Tokyo, Bloomberg, Dan Valcu and Sylvain VervoortBUY/SELL SIGNALS
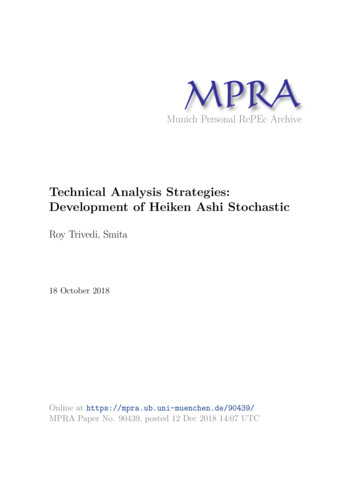
Significant Performance Enhancement913.50%369.21%335.31%28Source: FIL Tokyo, Bloomberg, Dan Valcu and Sylvain Vervoort
Positive Return Achieved during the Range MarketsMODEL PERFORMANCE913.50%NIKKEI 22529Source: FIL Tokyo, Bloomberg, Dan Valcu and Sylvain Vervoort
SummaryI. What is HA?In essence HA is a weighted average of OHLC price over the previous 6 time periodHA by itself can be used as a trend indicatorThere are only 3 basic HA patterns: hollow candle, filled candle and candle with shadows on both sides (thesmaller the body, the closer to turning point)II. The Strengths and Weaknesses of HA? Less is More: Trend, trend reversal as well as warning signals all easily identifiable without using otherindicators. Noises at range markets and lagging at the turning point are the two major weak pointsIII. The Opportunities of Making HA a Stronger Tool Both further smoothing and inclusion of a momentum indicator like HA Delta and its derivative can improvethe HA performance Combining the two indicators can SIGNIFANTLY enhance the HA performance30Source: FIL Tokyo, Bloomberg, Dan Valcu and Sylvain Vervoort
Appendix I.Applications of HA in Other Markets and Asset ClassesS&P 500Model Performance Using HABuy-and-Hold Performance31Source: FIL Tokyo, Bloomberg, Dan Valcu and Sylvain Vervoort497.6%321.3%
II. GOLDModel Performance Using HA502.85%Buy-and-Hold Performance224.35%32Source: FIL Tokyo, Bloomberg, Dan Valcu and Sylvain Vervoort
III. YEN /U Model Performance Using HA106%2.6%Buy-and-Hold Performance33Source: FIL Tokyo, Bloomberg, Dan Valcu and Sylvain Vervoort
1Forecasting the Japanese Stock Marketwith the BPV Ratio Indicator10th October 2014IFTA Conference LondonMasaaki Yamada
Definition of BPV Ratio2
Binomial treeud 13
4ExampleCalculationBPV Ratio
5BPV Ratio Quantifies the Distance(The Binomial Tree, Price Movement)
6Hong and Stein, Journal of Finance, 1999.NewswatcherBuy or Sell Based on the Cashflow InformationRegardless of the Price LevelMomentum TraderBuy or Sell Based on the Price MovementNo Cashflow InformationThe Period of the Position Taking is predetermined
7CaseOnly Newswatcher in the MarketInformational efficient price
The Momentum Trader Joins the Market8
Market Prices and BPV Ratios9Threshold H
Entry and its Subsequent Return103614 BPV Ratios 363 entry points(from 2000/1 to 2014/9/18)Threshold 0.933881 median from 2000/1 to 2013/12
Correlation and Statistics2001/1/1-2014/9/18Threshold H 0.933881 Median from 2001/1 to 2013/1211
Daily Back Test to Nikkei225 2000-2014Accumulated Logarithmic return12
Existence or Absence of Newswatcher13
Filtered BPV Ratio by Kalman Filter14
Price History from 2005 to 2007Threshold H 0.933366Median of the filtered BPV Ratiofrom 2001/1 to 2013/1215
Price History from 2012 to 201416Threshold H 0.933366Median of the filtered BPV Ratiofrom 2001/1 to 2013/12
Actual Price (Black Dot and Red Dot)and Calculated Price (Only Black Dot)17
My Forecast to Nikkei22518Rising Potential (the Gap)Price movement to fill the Gap is “Rise in Red ”Repeat “Rise in Red” until the Gap is Eliminated.
Introduction to Cycle Analysis –Reference charts USDJPY andTopix Transportation EquipmentIndex (TPTRAN)0
Period – Amplitude – Phase - Proportionality1
Properties of CyclesRepeating fluctuation of an observed variable described bya sine wave around a central value.Trough - cycle low point.Peak - cycle high point.Period - length in time units,trough to trough (x-axis).Amplitude - power / height inprice units (y-axis).Period / Amplitude proportional: the longer thecycle greater the amplitude.Phase - time elapsed sincelast trough OR offset betweentwo cycles.2
Velocity and AccelerationVelocity - zero at peak / trough;maximum midway betweenAcceleration - towards thecentre.3
Basic PrinciplesGeneral theory of cycles.Proportionality – the longerthe period, the greater thecycle’s power / amplitude.Synchronicity – troughs tendto synchronise, peaks tend tobe dispersed (in stocks).Nominality – a fixed family ofcycles from very long to veryshort.Summation – cyclescombine by addition.Harmonicity – cycles arerelated to one another by afactor of two or three.Commonality – the principlesapply to all freely tradedfinancial instruments.4
NominalityA family of cycles from very long to very short555
HarmonicityCycles within the composite are harmonically relatedVibrating string showing 2nd, 4th and 8thharmonics – different frequenciesoccur at integer multiples of baseMedium for cycles6
SynchronicitySynchronisation of troughs – Dispersion of peaks7
Summation IComplex compositeComposite of 4cycles with flatunderlying trend Composite of 9, 18,78, 156 day cyclecomponents flatunderlying trend. Same composite shallow underlyinguptrend. Notice thecomponents areswamped. Difficult to pick outthe componentseven though known.Same compositecycle with 15underlying trend8
Summation II156DComponent cycles Component cycles:9, 18, 78, 156 daycycles flatunderlying trend. Underlying trend straightened outsection of muchlonger cycle.78D18D9DUnderlying trend flat9
Phasing modelGoal of phasing analysis. Phase and averageperiod of componentcycles in composite. Status of each cycle:topping, bottoming, up,down, overdue Estimated time locationof next cycle lows.10
Charts - Updata; Data - Bloomberg11
Charts - Updata; Data - Bloomberg12
Charts - Updata; Data - Bloomberg13
Heikin Ashi represents 2 distinct underlying components: A) A time weighted average of price B) An embedded Trend indicator 5 ÎHeikin-Ashi ‘s MO is APPROXIMATELYa time weighted average of Price OHLC over the previous six time periods 98.44% ÎHeikin-Ashi is an Embedded Trend Indicator . Source: FIL Tokyo, Bloomberg, Dan Valcu and Sylvain Vervoort Heikin-Ashi Patterns & Their Implications .