Transcription
Heikin-Ashi-two-Bar-StrategyGuide to Strategic and Tactical Forex TradingPull the Trigger and Hit your TargetsCurrency: EUR/JPY, GBP/JPYTime frame: 5 minIndicators: BB 14, 2, ADX 14, SSD 5, 3, 3, EMA 9, 20, 55, 120This technique is used in combination with Bollinger Bands 14,2, ADX 14 , SSD 5, 3, 3 and EMA9, 55, 120.Buy/Sell signals:Entry: after two hollow or two filled candles.Leading indicator:SSD 5, 3, 3, crosses often 1-2 bar beforeConfirmation: DI/-DI-line-crossover. DI (green) and -DI (red) line (ADX 14) crosses sometimes 1-4 bars afterward entry point .Price Momentum: DI stays on top of -DI — uptrend is in place.-DI stays on top of DI — downtrend is in place.Strategig Forex Trading:ADX -/ DI lines are used for spotting entry signals.All -/ DI crossovers are disregarded while ADX remains below 20.Once ADX peaks above 20 a buy signal occur when DI (green) crosses upwards and above -DI(red).A sell signal will be the opposite: -DI would cross DI downwards.Exit Ponits:– When Heikin-Ashi-bar-colour changes and/or Heikin Ashi bar closes over the counterpartside of EMA 9 line.– In all situation of DI/-DI-line-crossovers (when trend is changing - two DI cross).– Buy and exit situations are often signalize with SSD 5, 3, 3, crossing near 20 or 80 % line,Role Reversal:If after a newly created signal another opposite crossover happens within a short period of time, theoriginal signal should be disregarded and position protected soon or closed. (A)(A)Do not ride out the storm.
Tactical PlanningTrending or Ranging Environment?Hollow candles with no lower shadows are used to signal a strong uptrend, while filled candleswith no higher shadow are used to identify a strong downtrend.Let the buy or sell orders running if ADX is high (ADX 25 ) and Heikin-Ashi-Bars are over EMA9 (uptrend) or under EMA 9 (downtrend) without any DI/-DI-line-crossover.(B)(B)Stay in your winning trades.Watch the indicator:When ADX rises above 20 for the first time and then goes flat for some time, there is believed to bea new trend being born and the reason for ADX being currently flat is because market reacts to thisnew trend formation by making first initial correction. During this correction it is a good time toinitiate new orders. Spent some time reviewing shorter time charts as well (one-minute-time-frame).- When ADX is too low, don't trade. (Often come along with indifferent candles)(C)(C)Compare the above/underneath illustrations: earmarked ABC or ABCDE.Yet another reason- ADX indicator is never traded alone, but rather in combination with other indicators and tools.ADX indicator most of the time gives much later signals comparing to faster reacting movingaverages crossover or Stochastic, for example, however, reliability of ADX indicator is muchhigher than for other indicators in traders' toolkit, which makes it a valuable tool for many Forextraders.Over and Out:- If ADX is traded above 20 but below 40, it is time to apply trend following methods. An examplewould be: Forex trading Moving averages or or trading with Parabolic SAR indicator.- When ADX reaches 40 level (5-min-chart – e.g. ADX 50-level on 1-min-time-frame), it suggestsan overbought/oversold (depending on the trend) situation on the market and it is time to protectsome profits of at least move Stop loss order to a break even. See here more at SSD 5,3,3.-When ADX passes 40 level, it is a good time to begin collecting profits gradually scaling out of thetrades on rallies and sell-offs and protecting remaining positions with trailing stops. Looking at SSD5,3,3.Bollinger Bands - the methodology of using Volatility indicatorsIn any market there are periods of high volatility (high intensity) and low volatility (low intensity).Volatility indicators show the size and the magnitude of price fluctuations.These periods come inwaves: low volatility is replaced by increasing volatility, while after a period of high volatility therecomes a period of low volatility and so on.Volatility indicators measure the intensity of price fluctuations, providing an insight into the marketactivity level.Low volatility suggest a very little interest in the price, but at the same time it reminds that themarket is resting before a new large move. Low volatility periods are used to set up the breakout
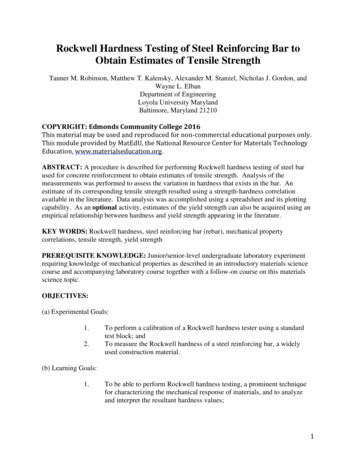
trades. For example, when the bands of the Bollinger bands indicator squeeze tight, Forex tradersanticipate an explosive breakout way outside the bands limit.A rule of thumb is: a change in volatility leads to a change in price.Another thing to remember about volatility is that while a low volatility can hold for an extendedperiod of time, high volatility is not that durable and often disappears much sooner.There are three different ways you can set up trades with Bollinger Bands: Range Trading,Breakout Trading and Tunnel Trading.Range is the distance between support and resistance for curent price action. It is the space betweenthe top and bottom of recent activity.Bollinger Bands are self-adjusting. When the market becomes more volatile, the Bollinger Bandsexpand or open up and more in opposite directions from each other. Whenever price enter a tighttrading pattern, the bands respond by contracting or moving closer together. In a range boundmarket, the bands are usually parallel to each other.(D)Get in the ring with floors and ceilings.(D)The range is the difference between support and resistance peaks and throughs. So, while in arange, it is a good idea to identify support and resistance. To do so, it may be helpful to drawhorizontal lines at points where peaks and throughs seem to be level.Heikin-Ashi-Candlestick-PatternFull bodied candles are considered "decision" candles, a decision candle tells us the market hasmade a decision to go in a particular direction.Indecision candles are candles with little or no body at all. These candles tell us the market cannotmake up its mind which direction it wants to go.Figure 1: Decision Candles and Indecision Candles
Indecision candles does not mean market is going to reverse, very often price just means for a bitand then continues in the same direction, however indecision candle(s) often appear just before themarket reverses which is why this is a good tool to have in your arsenal.Note the bullish decision candle after the Doji. It appears the market has "made up its mind" and isstarting to go up.Profiting with Forex:– Would you take risk/reward ratio and money management into consideration?– Set stop losses and trailing stops.Grace note:– Calculate your trade budget - define your stop price - define your risk tolerance - calculateyour trade budget - trade your budget (e.g. set at first one half of your investment, byconfirmation set the rest of investment) - identify Pivot Profit Zone (1 hour, 4 hours and 1day) – watch for a pullback bounce (Fibonacci Retracement Levels) - don't trade whereindicision candles take to the skies - gives market ambiguous signals look forward to largertime frames (if index frame: 5 min, look at 15 min, 30 min, 1h) - make MarketAnalysis: Speed of the market(1), Momentum of price and Trend (1) – cope with pre- and posttrading - commit 100 percent or walk away from the trade - use a trade journal properly –(1)There is a difference between market speed and price momentum: speed is how the market ismoving (look at 20, 55 EMA), Momentum is where price is going (e.g. reverse and continuationpatterns; where will the candles likely start to turn green again?).Keep an eye on the clock:Pay attention to London open (6 to 8 A.M. London time), the New York open (6 to 8 A.M. NewYork time) and the London close (5 to 6 P.M. London time). The markets move when these tradersopen and close their trades for the day.Heikin-Ashi-Bars, Scenarios, Trend Behavior and Current TrendsScenarioTrend BehaviorCurrent TrendAscendingDescending1Trend is normalRising white bodiesFalling filled bodies2Trend gets strongerRising longer whitebodies with no lowershadowsFalling longer filledbodies with no uppershadows3Trend gets weakerCandle bodies getsmaller emergence oflower shadowsCandle bodies getsmaller emergence ofupper shadows4ConsolidationSmaller bodies withboth upper and lowershadowsSmaller bodies withboth upper and lowershadows5Change of trendVery small body withlong upper and lowershadows (not tooreliable)Very small body withlong upper and lowershadows (not tooreliable)
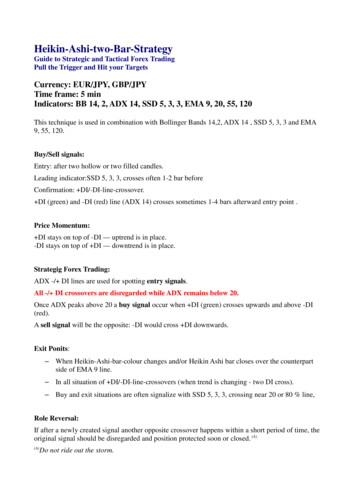
Heikin-ashi technique is based on the effect of the size and color of the candle bodies.The heikin-ashi is a visual technique that eliminates irregularities from a normal chart, offering abetter picture of trends and consolidations. All trends are well-defined by sequences of white or redbodies, making them easy to identify and follow.The Heikin-Ashi technique is used by technical traders to identify a given trend more easily.More to heikin-ashi-technique niqueTime ChartFigure February 2, 2009 gives practical information how this technique can be used.LabelingEntry signals: E, (Entry signals can be buy or sell orders)Exit signals: X (the matching part)Indifferent candles: ABC or ABCDECompare the above/underneath illustrations.Figures „February 02, 2009“ clearly represented without BB 14(2).(2)Why do I remove the Bollinger Bands from the charts „February 02, 2009“? You won't find BB inthe figures „February 02, 2009“. I like to keep things as simple as possible and than goes for thenumber of lines on the charts as well. Nevertheless Bollinger Bands are one important factor toHeikin-Ashi-two-Bar-Strategy mentioned above.Thank you for investing your time. So I know Heikin-Ashi-two-Bar-Strategy has become a greatsuccess and will positively impact your currency trading.Happy pipp'n.Kind regards.sam
Heikin-ashi technique is based on the effect of the size and color of the candle bodies. The heikin-ashi is a visual technique that eliminates irregularities from a normal chart, offering a better picture of trends and consolidations. All trends are well-defined by sequences of white or red bodies, making them easy to identify and follow. The Heikin-Ashi technique is used by technical traders .File Size: 372KBPage Count: 6