Transcription
USUAL DIETARY INTAKES:U.S. POPULATION, 2007–2010
This report was originally published online in March 2014 as a reference for the 2015 Dietary Guidelines forAmericans Advisory Committee. The information contained in this report informed analyses of usual nutrient andselected dietary component intakes in the Scientific Report of the 2015 Dietary Guidelines Advisory Committee:Advisory Report to the Secretary of Health and Human Services and the Secretary of Agriculture (2015), available ific-report.National Cancer Institute. “Usual Dietary Intakes: Food Intakes, U.S. Population, 2007–10.” Epidemiology andGenomics Research Program website, updated October 31, es.
USUAL DIETARY INTAKES: U.S. POPULATION, 2007 2010AcknowledgmentsThe following individuals represent the team who produced this analysis: Dave Castenson, Information Management Services, Inc. Kevin W. Dodd, National Cancer Institute Susan M. Krebs-Smith, National Cancer Institute Ruth Parsons, Information Management Services, Inc. Jill Reedy, National Cancer InstituteNational Cancer Institutei
USUAL DIETARY INTAKES: U.S. POPULATION, 2007 2010CONTENTSAcknowledgments . iIntroduction .1Selected Findings.2Appendices .3Appendix A: Food Group Intakes, U.S. Population, 2007–2010 .3Appendix B: Estimated Food Group Intakes Compared to Recommended Intake Levels for the U.S. Population,2007–2010 . 62List of TablesTable A.1. Total fruit: Means, percentiles, and standard errors of usual daily intake, 2007–2010 .3Table A.2. Total whole fruit: Means, percentiles, and standard errors of usual daily intake, 2007–2010 .4Table A.3. Citrus, melon, berries: Means, percentiles, and standard errors of usual daily intake, 2007–2010 .5Table A.4. Other fruits: Means, percentiles, and standard errors of usual daily intake, 2007–2010 . 7Table A.5. Fruit juice: Means, percentiles, and standard errors of usual daily intake, 2007–2010 .8Table A.6. Total vegetables, including beans and peas: Means, percentiles, and standard errors of usual dailyintake, 2007–2010.9Table A.7. Total vegetables, excluding beans and peas: Means, percentiles, and standard errors of usual dailyintake, 2007–2010. 11Table A.8. Dark-green vegetables: Means, percentiles, and standard errors of usual daily intake, 2007–2010 . 12Table A.9. Total red and orange vegetables: Means, percentiles, and standard errors of usual daily intake,2007–2010 . 13Table A.10. Tomatoes: Means, percentiles, and standard errors of usual daily intake, 2007–2010 . 15Table A.11. Other red and orange vegetables, excluding tomatoes: Means, percentiles, and standard errors ofusual daily intake, 2007–2010 . 16Table A.12. Total starchy vegetables: Means, percentiles, and standard errors of usual daily intake, 2007–2010 . 17Table A.13. White potatoes: Means, percentiles, and standard errors of usual daily intake, 2007–2010. 19Table A.14. Other starchy vegetables, excluding white potatoes: Means, percentiles, and standard errors of usualdaily intake, 2007–2010 . 20Table A.15. Other vegetables: Means, percentiles, and standard errors of usual daily intake, 2007–2010 . 21Table A.16. Beans and peas (legumes): Means, percentiles, and standard errors of usual daily intake, 2007–2010. 23Table A.17. Total grains: Means, percentiles, and standard errors of usual daily intake, 2007–2010 . 24Table A.18. Whole grains: Means, percentiles, and standard errors of usual daily intake, 2007–2010. 25Table A.19. Refined grains: Means, percentiles, and standard errors of usual daily intake, 2007–2010 . 27Table A.20. Total protein foods, including beans and peas: Means, percentiles, and standard errors of usual dailyintake, 2007–2010. 28National Cancer Instituteii
USUAL DIETARY INTAKES: U.S. POPULATION, 2007 2010Table A.21. Total protein foods, excluding beans and peas: Means, percentiles, and standard errors of usual dailyintake, 2007–2010. 29Table A.22. Total meat, poultry, seafood, and eggs: Means, percentiles, and standard errors of usual daily intake,2007–2010 . 31Table A.23. Total meat, poultry, and seafood: Means, percentiles, and standard errors of usual daily intake,2007–2010 . 32Table A.24. Meat: Means, percentiles, and standard errors of usual daily intake, 2007–2010 . 33Table A.25. Cured meat: Means, percentiles, and standard errors of usual daily intake, 2007–2010 . 35Table A.26. Poultry: Means, percentiles, and standard errors of usual daily intake, 2007–2010 . 36Table A.27. Total seafood: Means, percentiles, and standard errors of usual daily intake, 2007–2010 . 37Table A.28. Eggs: Means, percentiles, and standard errors of usual daily intake, 2007–2010 . 39Table A.29. Total soy, nuts and seeds, and legumes: Means, percentiles, and standard errors of usual dailyintake, 2007–2010. 40Table A.30. Soy products: Means, percentiles, and standard errors of usual daily intake, 2007–2010. 41Table A.31. Nuts and seeds: Means, percentiles, and standard errors of usual daily intake, 2007–2010. 43Table A.32. Total protein from beans and peas (legumes): Means, percentiles, and standard errors of usual dailyintake, 2007–2010. 44Table A.33. Total dairy: Means, percentiles, and standard errors of usual daily intake, 2007–2010 . 45Table A.34. Milk: Means, percentiles, and standard errors of usual daily intake, 2007–2010 . 47Table A.35. Yogurt: Means, percentiles, and standard errors of usual daily intake, 2007–2010 . 48Table A.36. Cheese: Means, percentiles, and standard errors of usual daily intake, 2007–2010 . 49Table A.37. Oils: Means, percentiles, and standard errors of usual daily intake, 2007–2010 . 51Table A.38. Solid fats: Means, percentiles, and standard errors of usual daily intake, 2007–2010 . 52Table A.39. Energy from solid fats: Means, percentiles, and standard errors of usual daily intake, 2007–2010 . 53Table A.40. Added sugars: Means, percentiles, and standard errors of usual daily intake, 2007–2010 . 55Table A.41. Energy from added sugars: Means, percentiles, and standard errors of usual daily intake, 2007–2010 . 56Table A.42. Energy from solid fats and added sugars: Means, percentiles, and standard errors of usual dailyintake, 2007–2010. 57Table A.43. Alcoholic drinks: Means, percentiles, and standard errors of usual daily intake, 2007–2010. 59Table A.44. Energy: Means, percentiles, and standard errors of usual daily intake, 2007–2010 . 60Table B.1. Total fruits: Estimated percentage of persons below, at, or above recommendation . 62Table B.2. Total vegetables, including beans and peas: Estimated percentage of persons below, at, or aboverecommendation . 64Table B.3. Dark green vegetables: Estimated percentage of persons below, at, or above recommendation. 65Table B.4. Total red and orange vegetables: Estimated percentage of persons below, at, or aboverecommendation . 66Table B.5. Beans and peas (legumes): Estimated percentage of persons below, at, or above recommendation . 68Table B.6. Total starchy vegetables: Estimated percentage of persons below, at, or above recommendation . 69Table B.7. Other vegetables: Estimated percentage of persons below, at, or above recommendation . 70National Cancer Instituteiii
USUAL DIETARY INTAKES: U.S. POPULATION, 2007 2010Table B.8. Total grains: Estimated percentage of persons below, at, or above recommendation . 72Table B.9. Whole grains: Estimated percentage of persons below, at, or above recommendation . 73Table B.10. Refined grains: Estimated percentage of persons below, at, or above recommendation. 74Table B.11. Total protein foods, excluding beans and peas: Estimated percentage of persons below, at, or aboverecommendation . 76Table B.12. Total seafood: Estimated percentage of persons below, at, or above recommendation . 77Table B.13. Meat, poultry, and eggs: Estimated percentage of persons below, at, or above recommendation . 78Table B.14. Nuts, seeds, and soy: Estimated percentage of persons below, at, or above recommendation . 80Table B.15. Total dairy: Estimated percentage of persons below, at, or above recommendation . 81Table B.16. Oils: Estimated percentage of persons below, at, or above recommendation . 82Table B.17. Energy from Solid Fats and Added Sugars (SoFAS): Estimated percentage of persons below, at, orabove recommendation. 84National Cancer Instituteiv
USUAL DIETARY INTAKES: U.S. POPULATION, 2007 2010IntroductionUsual dietary intake is the long-run average daily intake of a nutrient or food. The concept of long-term average dailyintake, or “usual intake,” is important because dietary recommendations are intended to be met over time and diethealth hypotheses are based on dietary intakes over the long term. Consequently, it is the usual intake that is often ofmost interest to policy makers—when they want to know the proportion of the population at or below a certain level ofintake—and to researchers—when they want to examine relationships between diet and health. However, untilrecently, sophisticated efforts to capture this concept have been limited at best.Researchers at the National Cancer Institute (NCI) and elsewhere have developed a method to model particularaspects of usual dietary intakes of foods and nutrients using 24-hour recalls. The NCI Method can be used to: estimate the distribution of usual intake for a population or subpopulation; assess the effects of nondietary covariates on usual consumption; and correct (at least partially) bias caused by measurement error in estimated associations between usual dietaryintakes and health outcomes using the statistical technique of regression calibration. (Note: This modelingtechnique does not accurately estimate usual intake for individuals.)We have applied the NCI Method to data from the 2007–2010 National Health and Nutrition Examination Survey(NHANES), a nationally representative sample, to estimate means and percentiles of the distributions of food intakefor a range of sex-age groups in the U.S. population.The 2007–2010 data were collected via two 24-hour recalls from 18,117 persons 1 year of age and older. Furtherinformation regarding the design and methodology used in the 2007–2010 NHANES is available on the NationalCenter for Health Statistics website at https://www.cdc.gov/nchs/nhanes. Intakes reported on the recalls weretranslated into quantities from each of the food groups of interest using the Food Patterns Equivalents Databases(FPED) 2007–2008 and 2009–2010, which were developed for the corresponding surveys. More informationabout the FPED databases is available at The NCI Method uses either a one- or two-part model, depending on whether the food in question is consumed dailyby almost everyone. When a two-part model is used, the person-specific effects may be correlated. In this analysis, ifless than 5 percent of the population had zero intakes of a food, an amount-only model was used. If more than 10percent of the population had zero intakes of a food, a two-part model was used, and this model was correlated whenapplicable. If between 5 percent and 10 percent of the population had zero intakes of a food, both models were fit tothe data, and the best-fitting model was selected; in most of these borderline cases, the two-part model fit best.Dietary recalls tend to be different depending on whether they are the first or second report from an individual andwhether the reported day was a weekday or weekend. In this analysis, means and percentiles of the intakedistributions were modeled for each food, correcting for sequence and weekend/weekday effects and based on sexage group. Analyses were conducted for the entire population and for numerous sex-age groups.Recommendations for food group intake vary by energy level, which in turn varies by sex, age, and activity level. Toestimate the percentage of persons meeting food group recommendations by sex and age, we linked the estimatedenergy needs per day by age, gender, and physical activity level [PDF] with the recommended daily intake amountsof each food or subgroup at the corresponding calorie levels in the U.S. Department of Agriculture (USDA) FoodPatterns [PDF]. This resulted in a range of recommendations for each sex-age group, the lower end corresponding tothe lowest energy intake (associated with being sedentary) and the upper end corresponding to the highest energyintake (associated with being very active). In Appendix B, the percent with intakes meeting the recommendationNational Cancer Institute1
USUAL DIETARY INTAKES: U.S. POPULATION, 2007 2010represent those with intakes within this range of recommendations, whereas the percent with intakes below therecommendation indicate those below the minimum and the percent with intakes above the recommendation indicatethose above the maximum recommended amount.More information about the NCI Method is available method.html.Selected Findings U.S. Department of Agriculture (USDA) food pattern recommendations for each food group vary depending on aperson's energy requirement, which in turn is influenced by sex, age and activity level. The lowestrecommendations are generally for very young, inactive children, whereas the higher recommendations aregenerally for very active teenage and young adult males. Recommendations for fruit intake range from 1 to 2.5 cups per day. Twenty-five percent of the populationconsumed less than half a cup per day (Table A.1). Mean intakes were just over 1 cup equivalent per day, and75 percent of the population had intakes below the minimum recommendation for their sex-age group (TableB.1). Among all children ages 1–18, 60 percent had usual intakes below their recommended level (data notshown). Recommendations for vegetables range from 1 to 4 cups per day. The usual intake at the 75th percentile was2 cups per day, for the entire population (Table A.6). Eighty-seven percent of the total population had a usualintake below the minimum recommendation for their sex-age group, with percentages running even higher foradolescents and young adults (Table B.2). Ninety-three percent of all children (ages 1–18) consumed fewervegetables than recommended (data not shown). Usual intakes of whole grains range from 0.1 ounce equivalents at the 5th percentile to 2.2 ounce equivalents atthe 95th percentile (Table A.18), and recommendations range from 1.5 to 5 ounce equivalents per day. Virtuallythe entire population (98.9 percent) consumed less than the minimum recommended amount for their sex-agegroup (Table B.9). The recommendations for dairy fall in a narrow range, 2 to 3 cup equivalents, and the recommendation is 3 cupsfor most sex-age groups, regardless of activity level. Not surprisingly, only 2 percent of the population met therecommendation exactly (Table B.15). However, although 11 percent of the population exceeded therecommendation, 86 percent fell short. Males were more likely than females to exceed the recommendation, atevery age group. Recommendations for protein foods range from 2 to 7 ounce equivalents per day, and intakes from the 5th toabout the 75th percentile were squarely in that range, among the whole population (Table A.21). Forty-twopercent of the population had intakes below the minimum recommendation for their sex-age group, 26 percenthad intakes between the minimum and maximum recommendation, and 32 percent had intakes above themaximum (Table B.11). USDA food patterns do not provide separate intake recommendations for solid fat and added sugars per se, butrather a maximum SoFAS (solid fat and added sugars) limit, in terms of calories. This allowance is small, rangingfrom 137 kilocalories per day (for persons whose total energy intake is only 1,000 kcal) to 596 kilocalories perday (for persons whose total energy intake is 3,200 kcal or greater). The average usual intake of energy from solid fats and added sugars was 594 kcal, and half the population had ausual intake of about 550 kcal or greater (Table A.42). Twelve percent of the population had intakes between theminimum and maximum recommendations for their sex-age group, but 86 percent exceeded the maximum(Table B.17).National Cancer Institute2
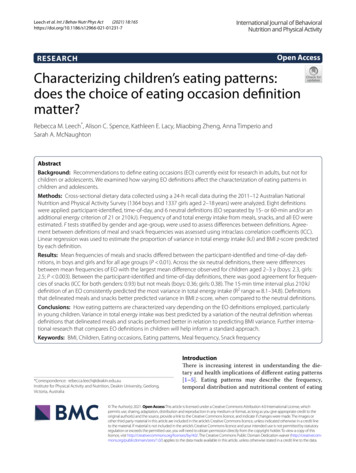
USUAL DIETARY INTAKES: U.S. POPULATION, 2007 2010AppendicesAppendix A: Food Group Intakes, U.S. Population, 2007–2010The following 44 tables provide the mean, standard error of the mean, percentiles of the distribution, and standarderrors of the percentiles of intake for each food group, by sex-age group. These tables represent each of the mainfood groups and subgroups of the USDA food patterns, as well as several other food groups and dietary constituentsof interest.Usual Daily Intake of Total FruitTable A.1. Total fruit: Means, percentiles, and standard errors of usual daily intake, 2007–2010Cup 8)2.5(0.11)3.1(0.14)71 9(0.07)2.7(0.11)3.3(0.15)19 7(0.05)1.3(0.07)1.9(0.09)2.4(0.10)National Cancer Institute3
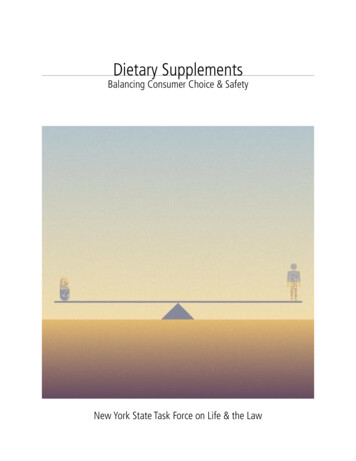
USUAL DIETARY INTAKES: U.S. POPULATION, 2007 2010Cup 9)71 (0.04)2.5(0.06)3.0(0.08)19 1.5(0.04)2.2(0.05)2.6(0.06)1 )1.5(0.03)2.2(0.05)2.7(0.06)1: Number of persons in sample.2: Standard errors (df 32).3: 1 cup equivalent 1 cup cut-up raw or cooked fruit; 1/2 cup dried fruit; or 1 cup juice.Usual Daily Intake of Total Whole FruitTable A.2. Total whole fruit: Means, percentiles, and standard errors of usual daily intake, 2007–2010Cup .09)2.5(0.12)71 3(0.06)2.0(0.08)2.5(0.10)19 1.0(0.04)1.7(0.06)2.2(0.08)National Cancer Institute4
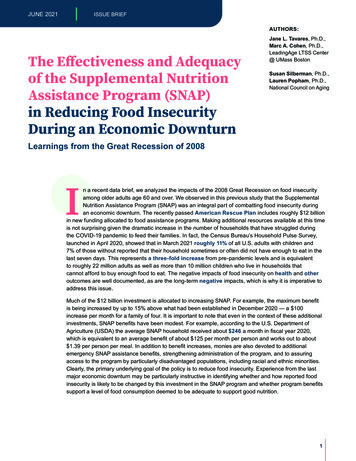
USUAL DIETARY INTAKES: U.S. POPULATION, 2007 2010Cup 0(0.06)2.4(0.08)71 3(0.03)1.9(0.06)2.3(0.08)19 1.1(0.03)1.7(0.05)2.1(0.06)1 )1.0(0.03)1.6(0.04)2.1(0.05)1: Number of persons in sample.2: Standard errors (df 32).3: 1 cup equivalent 1 cup cut-up raw or cooked fruit; 1/2 cup dried fruit; or 1 cup juice.Usual Daily Intake of Citrus, Melon, and BerriesTable A.3. Citrus, melon, berries: Means, percentiles, and standard errors of usual daily intake, 2007–2010Cup 9)0.7(0.16)National Cancer Institute5
USUAL DIETARY INTAKES: U.S. POPULATION, 2007 2010Cup 0(0.01)0.1(0.02)0.3(0.03)0.7(0.06)1.0(0.10)71 4(0.04)0.8(0.08)1.1(0.12)19 8)71 4(0.04)0.8(0.06)1.1(0.08)19 0.3(0.02)0.6(0.04)0.9(0.06)1 )0.3(0.02)0.5(0.03)0.8(0.05)1: Number of persons in sample.2: Standard errors (df 31).3: 1 cup equivalent 1 cup cut-up raw or cooked fruit; 1/2 cup dried fruit; or 1 cup juice.National Cancer Institute6
USUAL DIETARY INTAKES: U.S. POPULATION, 2007 2010Usual Daily Intake of Other FruitsTable A.4. Other fruits: Means, percentiles, and standard errors of usual daily intake, 2007–2010Cup 5)1.5(0.07)1.9(0.09)71 0(0.06)1.5(0.07)1.9(0.09)19 8)71 0(0.03)1.4(0.05)1.7(0.07)National Cancer Institute7
USUAL DIETARY INTAKES: U.S. POPULATION, 2007 2010Cup 5%(SE)50%(SE)75%(SE)90%(SE)95%(SE)19 0.8(0.02)1.2(0.04)1.5(0.06)1 )0.7(0.02)1.2(0.03)1.6(0.05)1: Number of persons in sample.2: Standard errors (df 32).3: 1 cup equivalent 1 cup cut-up raw or cooked fruit; 1/2 cup dried fruit; or 1 cup juice.Usual Daily Intake of Fruit JuiceTable A.5. Fruit juice: Means, percentiles, and standard errors of usual daily intake, 2007–2010Cup 0.2(0.03)0.5(0.06)1.0(0.10)1.5(0.14)14–
less than 5 percent of the population had zero intakes of a food, an amount-only model was used. If more than 10 percent of the population had zero intakes of a food, a two-part model was used, and this model was correlated when applicable. If between 5 percent and 10 percent of the population had zero intakes of a food, both models were fit to