Transcription
(2021) 19:269Zhao et al. J Transl al ofTranslational MedicineOpen AccessRESEARCHTPM, FPKM, or Normalized Counts?A Comparative Study of QuantificationMeasures for the Analysis of RNA‑seq Datafrom the NCI Patient‑Derived Models RepositoryYingdong Zhao1† , Ming‑Chung Li1†, Mariam M. Konaté1†, Li Chen2, Biswajit Das2, Chris Karlovich2,P. Mickey Williams2, Yvonne A. Evrard2, James H. Doroshow3 and Lisa M. McShane1*AbstractBackground: In order to correctly decode phenotypic information from RNA-sequencing (RNA-seq) data, carefulselection of the RNA-seq quantification measure is critical for inter-sample comparisons and for downstream analyses,such as differential gene expression between two or more conditions. Several methods have been proposed andcontinue to be used. However, a consensus has not been reached regarding the best gene expression quantificationmethod for RNA-seq data analysis.Methods: In the present study, we used replicate samples from each of 20 patient-derived xenograft (PDX) modelsspanning 15 tumor types, for a total of 61 human tumor xenograft samples available through the NCI patient-derivedmodel repository (PDMR). We compared the reproducibility across replicate samples based on TPM (transcripts permillion), FPKM (fragments per kilobase of transcript per million fragments mapped), and normalized counts usingcoefficient of variation, intraclass correlation coefficient, and cluster analysis.Results: Our results revealed that hierarchical clustering on normalized count data tended to group replicate sam‑ples from the same PDX model together more accurately than TPM and FPKM data. Furthermore, normalized countdata were observed to have the lowest median coefficient of variation (CV), and highest intraclass correlation (ICC)values across all replicate samples from the same model and for the same gene across all PDX models compared toTPM and FPKM data.Conclusion: We provided compelling evidence for a preferred quantification measure to conduct downstreamanalyses of PDX RNA-seq data. To our knowledge, this is the first comparative study of RNA-seq data quantificationmeasures conducted on PDX models, which are known to be inherently more variable than cell line models. Ourfindings are consistent with what others have shown for human tumors and cell lines and add further support to thethesis that normalized counts are the best choice for the analysis of RNA-seq data across samples.*Correspondence: mcshanel@ctep.nci.nih.gov†Yingdong Zhao, Ming-Chung Li and Mariam M. Konaté contributedequally to this project1Biometric Research Program, Division of Cancer Treatmentand Diagnosis, National Cancer Institute, Rockville, MD, USAFull list of author information is available at the end of the article The Author(s) 2021. This article is licensed under a Creative Commons Attribution 4.0 International License, which permits use, sharing,adaptation, distribution and reproduction in any medium or format, as long as you give appropriate credit to the original author(s) andthe source, provide a link to the Creative Commons licence, and indicate if changes were made. The images or other third party materialin this article are included in the article’s Creative Commons licence, unless indicated otherwise in a credit line to the material. If materialis not included in the article’s Creative Commons licence and your intended use is not permitted by statutory regulation or exceeds thepermitted use, you will need to obtain permission directly from the copyright holder. To view a copy of this licence, visit http:// creat iveco mmons. org/ licen ses/ by/4. 0/. The Creative Commons Public Domain Dedication waiver (http:// creat iveco mmons. org/ publi cdoma in/ zero/1. 0/) applies to the data made available in this article, unless otherwise stated in a credit line to the data.
Zhao et al. J Transl Med(2021) 19:269Page 2 of 15Keywords: RNA sequencing, Quantification measures, Normalization, TPM, FPKM, Count, RSEM, Patient derivedxenograft models, DESeq2, TMMBackgroundRNA-sequencing (RNA-seq) has replaced gene expression microarrays as the most popular method for transcriptome profiling [1, 2]. Various computational toolshave been developed for RNA-seq data quantificationand analysis, sharing a similar workflow structure, butwith some notable differences in certain processing steps[3, 4]. Starting from a FASTQ file containing sequencereads and corresponding quality scores, the sequencereads can be mapped and aligned to a reference genomeusing algorithms such as TopHat2 and/or STAR readaligner. Gene counts are then generated from the resulting SAM or BAM file using tools such as SAMtools andHTSeq. This process is time consuming and yields genelevel counts only. Because alternative splicing createsmultiple structurally-distinct transcripts of the samegene that may produce different phenotypes, several toolshave been developed for RNA-seq isoform quantificationsuch as Salmon aln, eXpress, RSEM, and TIGAR2, whichall require transcriptome-mapping BAM files [5]. Incontrast to the aforementioned alignment-based methods, transcript quantification tools Salmon, Sailfish, andkallisto were designed to boost processing speed and todecrease memory and disk usage by bypassing the creation and storage of BAM files [6–8]. This approach isparticularly useful for the discovery of novel transcripts,when sequencing poorly annotated transcriptomes, andto detect lowly expressed genes [9]. Raw read countscannot be used to compare expression levels betweensamples due to the need to account for differences intranscript length, total number of reads per samples, andsequencing biases [4]. Therefore, RNA-seq isoform quantification software summarize transcript expression levels either as TPM (transcript per million), RPKM (readsper kilobase of transcript per million reads mapped), orFPKM (fragments per kilobase of transcript per millionreads mapped); all three measures account for sequencing depth and feature length [4].Because of the nature of the quantification measuresand embedded implicit normalization process, TPM,RPKM, and FPKM expression levels are suitable forthe comparison of RNA transcript expression withina single sample. However, none of these measures canbe used universally for cross-sample comparisons anddownstream analyses such as the determination of differentially expressed genes between two or more biological states. Issues arise, especially in the case of lowlyexpressed genes, when attempts are made to correct forgene length differences [9]. In a comprehensive evaluation of normalization methods for Illumina highthroughput RNA-seq data analysis, Dillies et al. [9]concluded that total gene counts and RPKM were notrecommended quantifications for use in downstreamdifferential expression analysis. Only DESeq2 and TMMnormalization methods were shown to produce quantifications robust to the presence of different library sizesand widely different library compositions. Conesa et al.[4] conducted a survey of best practices for RNA-seqdata analysis and indicated that RPKM, FPKM, and TPMmethods normalize away the most important factor forcomparing samples, which is sequencing depth, whetherdirectly or by accounting for the number of transcripts,which can differ significantly between samples. RPKM,FPKM, and TPM tend to perform poorly when transcriptdistributions differ between samples. Highly expressedfeatures in certain samples can skew the quantitativemeasure distribution and adversely affect normalization,leading to the spurious identification of differentiallyexpressed genes. Zhao et al. [10] recently reported themisuse of RPKM and TPM normalization when comparing data across samples and sequencing protocols.However, due to the lack of experimental data generatedfrom different types of replicates to further validate theirrecommendation, consensus regarding which RNA-seqquantification measure should be used for cross-samplecomparison seems not to have been reached by the scientific community. Many recent peer-reviewed articles, aswell as publicly-available databases and websites, are stillusing TPM or RPKM/FPKM for pooled data analyses,cross-sample comparisons, and differential expression(DE) analysis [11–15]. Furthermore, some researchershave attempted to improve comparability of the expression measures by applying certain transformations (e.g.,median centering and unit variance scaling, also referredto here as Z-score) or re-normalizing on either TPM orRPKM/FPKM data.In recent years cancer models developed from patienttumors have come to replace late passage cell lines as thepreferred tool in pre-clinical cancer research [16]. Theresulting patient-derived xenograft (PDX) models recapitulate most histological and genetic characteristics oftheir human donor tumor, thus facilitating the prediction of clinical outcomes and the investigation of drugefficacy, biomarker identification, and development ofpersonalized medicine strategies. The National CancerInstitute (NCI) is developing a national repository of
Zhao et al. J Transl Med(2021) 19:269Patient-Derived Models (PDMs) comprised of hundredsof patient-derived xenograft (PDX) models spanninga wide variety of tumor types. The publicly-accessibledatabase, NCI PDMR (https:// pdmr. cancer. gov/), provides clinical annotations as well as molecular characterization information, whole exome sequencing, andRNA-seq data for early-passage PDXs, and if available,for originator patient specimens, to aid in selection ofthe best model for the investigation of a specific researchquestion.Here we report on our evaluation of TPM, FPKM,and normalized counts on an RNA-seq dataset of PDXmodels from the NCI PDMR. Our study examined 61replicate samples belonging to 20 different PDX modelsoriginating from patients with different cancer types todetermine which quantitative measures should be usedto minimize differences between replicate samples, whilepreserving biologically meaningful expression differencesbetween genes and across PDX models.MethodsSample selection and RNA‑seq data acquisitionWe focused on early-passage PDXs due to the similarity of their genomic and transcriptional profiles to thoseof the original tumor [17]. RNA-seq data for 61 earlypassage (passage 0, 1, and 2) tumor xenografts of humanorigin belonging to 20 distinct patient-derived xenograft(PDX) models were downloaded from the publicly-accessible NCI PDMR website (https:// pdmr. cancer. gov/). Inthis paper, we used the term “replicate” to denote samples from the same tumor implanted into different mice(i.e., biological replicates). Of the 20 PDX models, 19 hadthree replicate samples from the same passage with available RNA-seq data, while the remaining model had fourreplicate samples from the same passage. The 20 PDXmodels covered 15 different cancer subtypes (Additionalfile 1: Table S1).The detailed standing operating procedures for theRNA-seq library preparation and data processing canbe found in the SOP section of the NCI PDMR website(https:// pdmr. cancer. gov/ sops/). Briefly, the sampleswere sequenced on the Illumina HiSeq Sequencing platform. FASTQ files were generated with bcl2fastq (version: 2.17.1.14, Illumina). Adaptors were trimmed withinthis process using the default cutoff of the adapterstringency option. PDX mouse reads were bioinformatically removed from the raw FASTQ files using bbsplit(bbtools v37.36). The fastq files were mapped to thehuman transcriptome based on exon models from hg19using Bowtie2 (version 2.2.6). The resulting SAM fileswere converted to BAM format using samtools, and thetranscriptomic coordinates from the BAM file were converted to the corresponding genomic (hg19) coordinatesPage 3 of 15using RSEM (version 1.2.31). Gene and transcript levelquantification were also performed with RSEM (version 1.2.31). In our comparative study, we focused on thegene level output files, which contained the TPM, FPKM,expected counts, and effective length for 28,109 genes.Quantification and normalization methodsThe aim of the present study was to compare the performance of different RNA-seq gene expression quantification measures for downstream analysis. All geneexpression measures included in our study are definedbelow.RPKM and FPKMThe measure RPKM (reads per kilobase of exon per million reads mapped) was devised as a within-sample normalization method; as such, it is suitable to compare geneexpression levels within a single sample, rescaled to correct for both library size and gene length [1].FPKM stands for fragments per kilobase of exon permillion mapped fragments. It is analogous to RPKM andis used specifically in paired-end RNA-seq experiments[17]. The calculation of RPKM or FPKM for gene i usesthe following formula:RPKMi or FPKMi qili103 j qj106 li qij qj 109where qi are raw read or fragmentcounts, li is feature(i.e., gene or transcript) length, and qj corresponds tojthe total number of mapped reads or fragments. TheRSEM output files containing RNA-seq data for theselected samples downloaded from the NCI PDMRinclude both FPKM and TPM expression values.TPMTPM was introduced in an attempt to facilitate comparisons across samples. TPM stands for transcript permillion, and the sum of all TPM values is the same inall samples, such that a TPM value represents a relativeexpression level that, in principle, should be comparablebetween samples [18].qi /li 106TPMi j qj /ljwhere qi denotes readsmapped to transcript, li is thetranscript length, and (qj /lj ) corresponds to the sum ofjmapped reads to transcript normalized by transcriptlength.
Zhao et al. J Transl Med(2021) 19:269The TPM measurecaneasily be converted toFPKMi 106 .FPKM: TPMi FPKMjjCount normalization methodsThe R package tximport was used to prepare gene levelcount data from RSEM output files [19]. Subsequently,normalized count data were derived using the DESeq2package [20]. The normalization approach used byDESeq2 is to form a “virtual reference sample” by takingthe geometric mean of counts over all samples for eachgene [20]. Then, DESeq2 normalizes each sample to thisvirtual reference to get one scaling factor per sample.TMM stands for a weighted trimmed mean of M values, which are gene-wise log-fold change quantitiesoriginally defined by Robinson and Oshlack [21]. Normalization using the TMM method was performed oncount data generated from tximport with the ‘tmm’ function in Bioconductor package NOISeq [22]. The TMMnormalization method is also implemented in the edgeRpackage [21].Z‑score normalization on TPM‑level dataZ-score normalization is considered a centering and variance stabilization method. Z-score on TPM-level datawas calculated using the following formula:log2 TPMij 1 median log2 (TPMi 1)Zij SD log2 (TPMi 1)where the indices i and j stand for gene and sample index,respectively; and SD stands for standard deviation.Measures of variationHierarchical clusteringThe R function ‘hclust’ was used for sample clusteringbased on gene expression matrices. The distance matrixis based on 1 r, where r is the Pearson correlation coefficient between sample pairs. Ward’s minimum variancemethod (i.e., linkage method option ‘ward.D2’) was usedas the agglomeration method [23, 24]. Euclidean distancemetric was also computed to evaluate which measurecould more closely align the replicates, in terms of absolute expression measures, for each PDX model.Median CVThe coefficient of variation (CV) was defined as the ratioof the standard deviation to the mean expression of eachgene across replicate samples within each of the 20 PDXmodels. The median CV, as well as the interquartilerange, were documented for each PDX model.Page 4 of 15Intraclass correlation coefficient (ICC)For each PDX model, an intraclass correlation coefficient,denoted by ICCg, was computed to examine the impactof each quantification measure on the variability betweengenes relative to the total variation (across genes and replicate samples) [24–26].This analysis was based on a components of variancemodel:Yij gi eijwhere Yij denotes the log transformed unit of gene i in thereplicate j for a particular model. The error variance component σe2 associated with eij (technical error) reflects thereproducibility of the measure. The variance componentσg2 associated with gi (true gene expression) representsthe true gene-to-gene variability.The intra-class correlation ( ICCg) for each PDX modelis defined asICCg σg2σg2 σe2and estimated by the following equation defined byShrout et al. [25]:MSg MSeMSg (k 1)MSewhere MSg is the between-genes mean squares, MSe isthe between-samples mean squares, k is the number ofsamples. The ICCg, which ranges between 0 and 1, estimates the proportion of the total variance due to thebetween-gene variance. Larger I CCg values indicatehigher similarity (i.e., agreement) between replicate samples while preserving biological differences among geneswithin a PDX model. Computing an I CCg for each PDXmodel, as described above, resulted in a set of 20 ICCgvalues for each quantification method.Next, in order to evaluate which measure can betterpreserve true biological differences within the same geneacross different PDX models, another version of intraclass correlation, denoted by I CCm, was computed foreach gene. This metric allowed for examination of theimpact of each quantification measure on the variability between PDX models relative to the total variation(across models and replicate samples). This analysis wasbased on a components of variance model:Yij mi eijwhere Yij denotes the log transformed unit of PDX modeli in the replicate j for a particular gene. For simplicity ofnotation, gene index was not included in the formula.The error variance component σe2 associated with eij
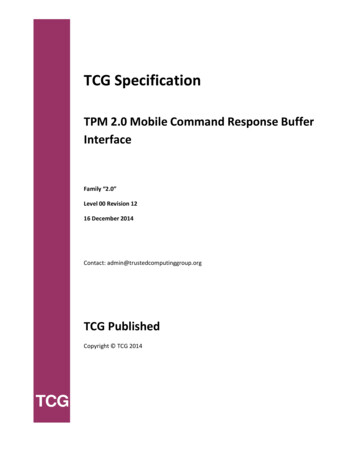
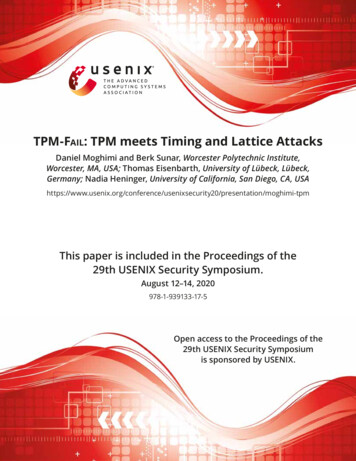
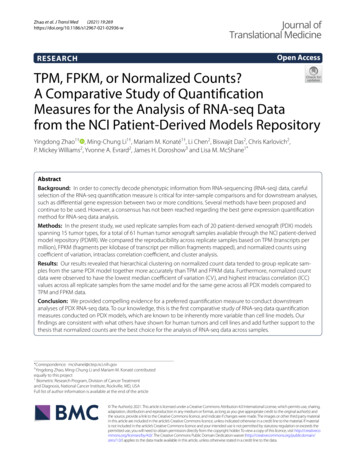
Zhao et al. J Transl Med(2021) 19:269(technical error) reflects the reproducibility of the measure. The variance component σm2 associated with mi (truegene expression) represents the true model-to-modelvariability.The intra-class correlation ( ICCm) for each gene isdefined asICCm σm2σm2 σe2and estimated by the following equation defined byShrout et al. [25]:MSm MSeMSm (k 1)MSewhere MSm is the between-models mean squares, MSeis the between-samples mean squares, k is the number of samples. The I CCm, which ranges between 0 and1, estimates the proportion of the total variance due tothe between-model variance. Larger ICCm values indicate higher similarity (i.e., agreement) between replicatesamples. Computing an ICCm for each gene, as describedabove, resulted in a set of 28,109 I CCm values for eachquantification method. A known feature of the ICC estimator used here is that sometimes it could produce negative values when the true ICC is close to zero and samplesize is small. For practical purposes, these negative estimates of ICC are considered to be equivalent to ICC 0.Model 947758-054-R is the only model that has fourreplicates, while the other 19 models all have three replicates. For simplicity, the first three replicates of model947758-054-R were selected to form a uniform datamatrix (20 3 for each gene) for the calculation of ICCfor each gene. The resulting balance in number of replicates allowed for easier calculation of the ICCg and ICCmestimates using the irr R package (version 0.84.1) [25, 26].Calculation of percentages of TPM for the top five mostabundant genesTo help identify what may cause transcript distributiondifferences between replicates, we calculated the percentage of TPM for the top five most abundant genes. Foreach PDX model, the 28,109 genes were first sorted bythe sum of TPMs across the replicate samples. The TPMpercentages of the top five most abundant genes in eachreplicate was then calculated as the sum of TPMs corresponding to the top five most abundant genes identifiedfor each model divided by 1 06.Page 5 of 15ResultsHierarchical clustering on normalized count data performsthe best for grouping replicate samples from the same PDXmodelWe performed hierarchical clustering analysis on all 61samples using different quantification measures, i.e.,TPM, FPKM, normalized counts, as well as Z-score normalization on TPM-level data. The pattern of sampleclustering differed depending on the gene expressionquantification measure used (Fig. 1A, B). Previous studies have shown that for clusters with nearly equal samplesizes, Ward’s method performed significantly better thanthe other clustering procedures [27–30]. We also triedthe “complete” linkage method and found similar patterns to those obtained with Ward linkage for each scenario. In our dataset which is comprised of three or fourreplicates each for 20 different PDX models, the implementation of different agglomeration methods did notnoticeably affect the results.For clustering based on 1-Pearson correlation distance matrix generated using TPM data (Fig. 1A, rightpanel), the three samples from PDX model 475296252-R (rectum) did not cluster together despite beingreplicate samples originating from the same humantumor. Two of its samples (475296-252-R-KPNPN8 and475296-252-R-KPNPP2) clustered with a different PDXmodel from the same cancer type (945468-187-T, rectum), while the third sample (475296-252-R-KPNPN9)clustered with PDX model 328469-098-R (colon). WhenEuclidean distance was used instead of 1-Pearson correlation as the distance matrix, the performance of theclustering for TPM data was worse. In addition to model475296-252-R, replicates in another three PDX models,821394-179-R (Malignant fibrous histiocytoma), 695221133-T (Melanoma), and K98449-230-R (Glioblastoma),were also not grouped in the same cluster (Fig. 1A, leftpanel).When normalized count data using DESeq2 (Fig. 1B) orTMM (Additional file 1: Figure S1A) were used, all replicate samples from the sample PDX model clustered witheach other no matter which distance matrix was used,that is, either 1-Peason correlation or Euclidean distance.This was also true when FPKM was used for clustering(Additional file 1: Figure S1B); however, we noticed thatfor certain models, the maximum distance (1-Pearsoncorrelation) among samples was noticeably larger compared to clustering on DESeq2 or TMM-normalized data(Additional file 1: Figure S2). Table 1 summarizes thenumber of discordant models while Table 2 lists the maximum height in hierarchical cluster analysis for each datanormalization method.
Zhao et al. J Transl Med(2021) 19:269Page 6 of 15ABFig. 1 A Hierarchical clustering of 61 patient-derived xenograft (PDX) samples using TPM data. B Hierarchical clustering of 61 PDX samples usingDESeq2 normalized count data. Distance metric 1-Pearson correlation was used to generate the dendrogram in each right panel and Euclideandistance was used for the dendrogram in each left panel. Discordant models are highlighted with different color labels
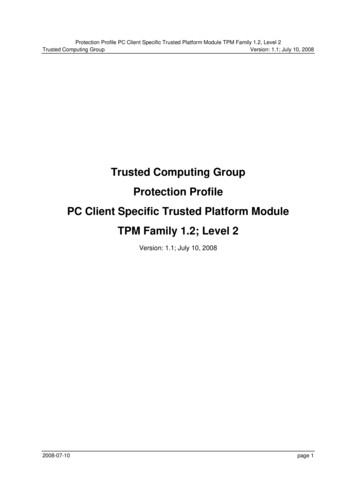
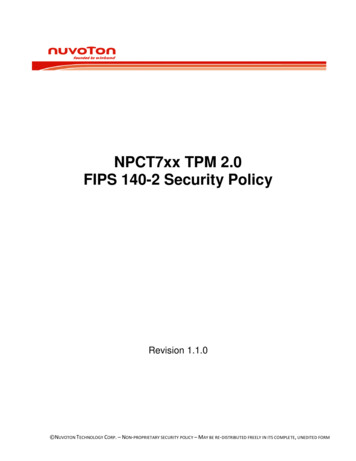
Zhao et al. J Transl Med(2021) 19:269Page 7 of 15Table 1 Number of discordant models in hierarchical cluster analysis under all scenariosDistance matrixTPM (Fig. 1A)CountDEseq2(Fig. 1B)CountTMM(Additional file 1:Figure S1A)FPKM (Additionalfile 1: Figure S1B)TPM-Zscore(Additional file 1:Figure S1C)TPM-TMM(Additional file 1:Figure e 2 Maximum height in hierarchical cluster analysis under all scenariosDistance matrixTPM (Fig. 1A)CountDEseq2(Fig. 1B)CountTMM(Additional file 1:Figure S1A)FPKM (Additionalfile 1: Figure S1B)TPM-Zscore(Additional file 1:Figure S1C)TPM-TMM(Additional file 1:Figure S3A)1-Pearson0.6130.0910.0890.1063.152a0.102aSince Ward method is used as the linkage method, the height is not limited to the original scale and can be larger than 20. 5median CV0. 4Method0. 3COUNTDESEQ2COUNTTMMFPKMTPM0. 20. 10. 0MODELFig. 2 Bar plot of median coefficients of variation (CV) for gene expression levels from replicate samples of each PDX model using differentquantification measuresNormalized count data has the minimum median CVacross replicates from the same PDX modelWe then calculated the median coefficient of variation(CV) across the replicate samples for each PDX model.Figure 2 displays the median CVs for each model usingdifferent quantification measures. Among all PDX models, median CVs from either DESeq2-normalized countdata (Fig. 2, red bars) or TMM-normalized data (Fig. 2,green bars) were on par with each other (ranging from0.05 to 0.15), and were low when compared to medianCVs from TPM (Fig. 2, purple bars) or FPKM data (Fig. 2,cyan bars). Among the four different quantificationmeasures, TPM was the worst performer with the largest median CVs (ranging from 0.08 to 0.52), while FPKM
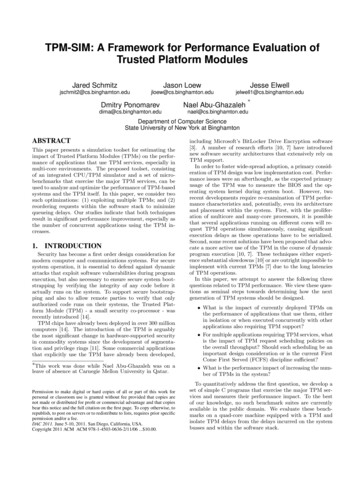
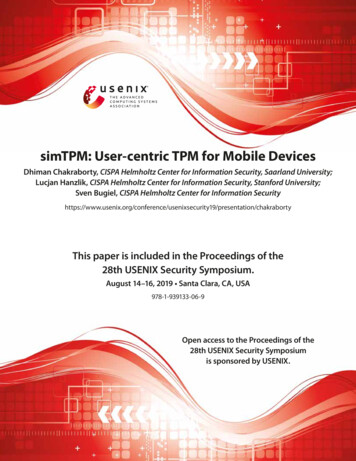
Zhao et al. J Transl Med(2021) 19:269Page 8 of 15also performed worse than normalized count data, butbetter than TPM in the majority of the models. Overall, normalized count data had the smallest median CVscompared to TPM and FPKM data across replicate samples in all 20 PDX models. Summary statistics on CVs,including the interquartile range, are listed in Additionalfile 1: Table S2 for different quantitative measures.1. 000. 75MethodICC gCOUNTDESEQ2COUNTTMM0. 50FPKMTPM0. 250. 00MODEL0. 8ICC mMethodCOUNTDESEQ20. 4COUNTTMMFPKMTPM0. 0MethodFig. 3 A Bar plot of gene intraclass correlation coefficients (ICCg) across replicate samples of each PDX model using different quantificationmeasures. B Boxplots of model intraclass correlation coefficients (ICCm) for gene expression levels from replicate samples across 20 PDX modelsusing different quantification measures
Zhao et al. J Transl Med(2021) 19:269Page 9 of 15Normalized count data has better ICC values over TPMand FPKM data for all PDX modelsNeither Z‑score nor an additional normalization step canresolve the potentially problematic issue of TPM dataNext, we explored which quantitative measure minimized differences between replicate samples, while preserving biologically meaningful expression differencesbetween genes and across PDX models. These assessments were based on the distributions of 20 I CCg and28,109 ICCm values for each quantification method.Higher ICC values are indicative of better reproducibilitybetween replicates [31].Figure 3A illustrates the comparison of ICCg whenusing different RNA-seq quantification measures on the20 PDX models. Although all ICCg values were above0.85, quantification measures still performed variablyin at least four PDX models. Among them, TPM data(Fig. 3A, purple bars) had the lowest ICCg values for PDXmodels 475296-252-R, 695221-133-T, 821394-179-R, andK98449-230-R [ranges of ICCg in four models was (0.859,0.944)], while normalized count data using either DESeq2(Fig. 3A, red bars) or TMM (Fig. 3A, green bars) had thehighest ICCg values [ranges of ICCgs in four models were(0.931, 0.979) for DESeq2 and (0.931, 0.979) for TMM].Furthermore, FPKM data had lower I CCg values thanDESeq2 and TMM-normalized count data in the abovefour models. Those four models were the same modelsidentified in hierarchical clustering using Euclidean distance whose replicates did not cluster with each other.These results indicate that the normalized count datawere more reproducible across replicate samples, in thesense of having generally higher between-gene variancerelative to the total variation (across genes and replicatesamples) across PDX models.We also calculated I CCm for each gene to examine theimpact of each quantification measure on both withinmodel error variance (between replicate samples for thesame gene) and between-model variance for each gene(model ICCm). Similarly, larger I CCm indicates that thereplicate error variance is relatively small compared tothe biological differences across PDX models for eachgene.Figure 3B shows the comparison of model I CCm whenusing different RNA-seq quantification measures on all28,109 genes. Normalized count from DESeq2 or TMM,as well as FPKM performed similarly well with median ICCm around 0.69, while TPM performed the worst withmedian ICCm of 0.64. These results indicate that the normalized count data were more reproducible across replicate samples, in the sense of having generally higherbetween-model variance relative to the total variation(across models and replicate samples) across genes.We further checked whether Z-score transformation oran additional normalization step would help to resolvethe potentially problematic issue of TPM data, especiallyfor PDX model 475296-252-R. We found that even afterZ-score normalization of TPM data, the replicate samples for PDX model 475296-252-R remained separatedfollowing hierarchical clustering (Additional file 1: FigureS1C, right panel), similar to what was shown in Fig. 1A.When Euclidean distance was used, the replicate samplesfrom 6 PDX models were not clustered with each other(Table 1; Additional file 1: Figure S1C, left panel), whichindicates that Z-score transformation cannot resolve thenormalization issue for this model. We also performedTMM normalization on TPM data. Following thisapproach, the three replicates for model 475296-252-Rdid cluster with each other (Additional file 1: FigureS3A). However, the scatter plots of TMM-normalizedTPM data for pairwise comparison of all genes amongthe three replicates still demonstrated a coordinated shiftfor highly expressed genes (Additional file 1: Figure S3B).Moreover, the median CV of TMM-normalized TPMdata (pink bar, Additional file 1: Figure S4) for all genesacross the replicates for each model were much higherthan those based on TMM-normalized count data (goldbar, Additional file 1: Figure S4).A few very highly expressed genes skewed the distributionof TPM expression valuesIn order to identify factors that possibly contribute tothe potentially problematic issue of TPM values acrossreplicate samples, we took a closer look at the pairwisescatter plots for expression of all genes among the 3replicate samples from PDX model 475296-252-R (samples KPNPP2, KPNPN8, and KPNPN9)—the model forwhich replicate samples did not c
TPM was introduced in an attempt to facilitate com- parisons across samples. TPM stands for transcript per million, and the sum of all TPM values is the same in all samples, such that a TPM value represents a relative expression level that, in principle, should be comparable between samples [18]. where q, i, denotes reads mapped to transcript, , i,