Transcription
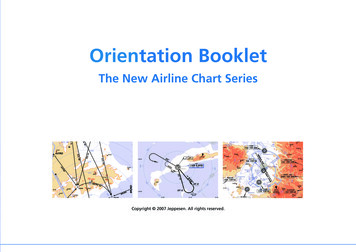
Orientation BookletThe New Airline Chart SeriesCopyright 2007 Jeppesen. All rights reserved.
Table of ContentsIntroduction.1Approach Chart.2Heading.2Plan View.2Profile View.3Minimums.3Sample Charts. 4-5Approach Chart Legend.6Heading.6Plan View.6Profile View.6Minimums.7Airport Chart.7SID/DP/STAR Overview Chart.8Heading.8Plan View. 8-9SID/DP/STAR Overview Chart Legend.10Sample Charts.11
IntroductionThis Orientation Booklet is a quick reference aid to assist you in making a smooth transition to the new airline chart series, which representsour ongoing effort to improve chart usability and readability as well as smoothing the path to a digital presentation in today’s and tomorrow’sElectronic Flight Bags. The new airline chart series has been developed to better support those airlines that primarily operate category C andD aircraft.The main areas of improvement are: Supporting a constant descent on final approach for Non-Precision Approach Charts Showing CAT 3A approach minimums on Standard ILS Precision Approach Charts Reducing the amount of information not used by airlines SID/STAR Overview Chart showing basic route information to scale and with terrainOmitting all information unnecessary for these aircraft categories in the plan view and profile view as well as in the minimums boxes for landingand take-off results in improved readability of the charts. However, if an airline prefers to stay with the current information (aircraft categoriesA, B, C and D) the Jeppesen Standard Chart is still available.New printing technology allows printing one additional color – blue for hydrography, special use airspace and information to improve situational awareness.The new airline chart series will be made available for a selected number of airports which are most frequently used by airlines as destinationor alternate airports and contained in a tailored route manual.Besides the approach and airport charts, SID/DP/STAR overview charts have been developed mainly to enhance terrain awareness that is notcurrently provided by the standard SID/DP/STAR charts. It shows the simplified routing relative to terrain, special use airspace and other routes.The charts are to scale and useful in flight planning.The contents of this Orientation Booklet provide you with detailed information on the new airline chart series. This includes example charts ofstandard approach versus new airline charts, SID/DP/STAR overview charts, and a new legend.
Approach ChartApproach Chart Heading Index Oval, Special IssueA square-end oval outline is used to distinguish Airline charts from Standard charts. The Airline Icon is placed between the airport name and therevision date.Approach Chart Heading ILS/MLS/LOC Approach ChartsThe former reference to CAT II and III suffixes in the procedure title are routinelybeing omitted by various States according to ICAO recommendations. Typically,there will be no separate chart for CAT II/IIIA. CAT I, II, and IIIA ILSs will alwaysbe combined if space permits. Only the lowest permissible minimums are charted.If a runway is CAT IIIA-approved, an ILS CAT IIIA minimum of DH 50’ togetherwith a reference to CAT I & II ILS is shown in the pre-approach briefing section. Ifthe lowest operations a runway is approved for are CAT II operations, the lowestpermissible RA for category C and D as well as the DA(H) for the CAT I are shown. If the CAT I or CAT II DH is different for aircraft category C andD, a cross-reference note is shown referring to the minimums section; e.g., DA(H) Refer to Minimums. In countries where ILS CAT IIIB minima arepublished on the Jeppesen Standard Chart, the Airline Chart will also show ILS minima down to CAT IIIB.Plan View DME Distance CirclesWhenever a suitable VORDME is available (within 6 NM of the ARP of the airport concerned), relevant distance and radial information are shown, spaced at intervals of 5 NM for both precision and non-precision approach procedures. Where no suitableVORDME is available, DME distance circles centered on an ILS/LOCDME, or stand-alone DME or TACAN location indicatingthe appropriate frequency and ident are shown. DME Distance Circles are printed in blue. Restrictive Airspace (Prohibited & Restricted Areas, Danger Areas)The wide crosshatched band used on standard charts will be replaced by a thin solid line. Restricted Airspace outlines and labelsare printed in blue.3 Secondary IFR/VFR Airports - Printed in blue.4 Terrain ContoursThe depiction of terrain contours is not limited by terrain criteria as applied for standard charts of a 2000’ rise above the airport elevation within 6NM of the airport or 4000’ above the airport elevation within the limits of the charted plan view. The lowest contour shown is at least 400 feet abovethe airport elevation beginning with the source chart’s next higher 1000 feet interval.
Approach ChartProfile View Recommended Altitude Descent Table (DME Ribbon)When not already state-supplied, a recommended altitude descent table (DME ribbon) is shown beginning at the FAF, assuming a suitablylocated DME is used in the procedure. The recommended altitude ribbon is shown for all non-precision approaches (VOR, NDB, LOC, etc.),provided that the maximum divergence between the DME fixes, the tracking facility and the DME is not more than 23º to accommodate a continuous rate of descent until reaching the minimum. A maximum of nine altitudes will be shown in increments of 1 NM in even DME distancessequenced in the direction of flight of the profile. Recommended altitudes, if not already a multiple of ten, will always be rounded up to the nexthigher 10 foot increment. Ground Speed-Kts TableA modified Gnd speed-Kts box replaces the standard box to better match the requirements for category C and D aircraft.MinimumsOnly the best minimums condition e.g., “With DME” or “With Local Altimeter Setting” are shown. Footnoted is the “Without DME” or “With Remote Altimeter Setting” condition. ILS CAT I/II/IIIA minimums will always be shown combined with non-precision (LOC [GS out]) minimums.However, if space does not permit the depiction of all ILS minimums together with LOC (GS out ) minimums or any other combined non-precision approach minimums, a separate non-precision approach chart for LOC (GS out), VOR, NDB, etc. will be created. ILS landing minimumsfor approach category 2 is standardized to DH 100’ and RVR 300m and for approach category 3A to DH 50’ and RVR 200m. These values will beprinted on a standard chart. Airlines that have other landing minimums approved have the option to tailor this information. Landing minimumsfor category 3B vary significantly from airline to airline. Therefore, the depiction of category 3B minimums remains as tailoring option.ApproachChartHeadingMinimumBoxes
Sample ChartsApproach ChartNew HeadingAirline ChartApproach ChartHeadingStandardChart
Sample rtChartHeadingNew Airline
Approach Chart LegendApproach Chart Legend Airline FormatGeneralThis legend serves as supplementary information to the NEW FORMAT and regular APPROACH Chart LEGEND. The following pages briefly explainthe differences and symbols used on Airline charts. Airline charts refer only to aircraft categories C and D. The additional colour blue serves for better differentiation between primary and secondary information.Approach Chart Heading Airline chart icon. The former reference to CAT II and III suffixes are routinely beingomitted by various states according to ICAO recommendations. Ifspace permits, a combined chart for CAT I, II, and IIIA ILS will beshown.3 The lowest permissible CAT IIIA minimum will always be charted if arunway is CAT IIIA approved together with a cross reference note forCAT I and CAT II referring to the minimums section.ApproachChartHeadingApproachChartHeading 3Plan View DME distance and radial information spaced at intervals of 5NM. Special Use Airspace (Prohibited, Restricted, Danger Areas) 33 Secondary AirportProfile ViewWhen not already state supplied, a DME ribbon, beginning at the final approach fix (FAF), will be shown for all non-precision approaches,when a suitable located DME is used in the titudeTableApproachChartHeadingConversionTableThe aircraft approach speeds have been adjusted to better match the aircraft categories C and D.
Approach Chart LegendApproach Chart Legend Airline FormatTypical depiction of landing minimums for runways approved for ILS CAT IIIA cal depiction of landing minimums for runways that are approved for ILS CAT IIIB operations and where CAT 3B minimums are shownon the Jeppesen Standard Chart.ApproachHeadingTake-offChartMinimums1. Variation and Hydrography printed in blue.Chart Heading2.ApproachTake-off minimumbox Airport Chart
SID/DP/STAR Overview ChartGeneralThe SID/DP/STAR overview chart has been developed to enhance situational and terrain awareness. It depicts a simplified routing relative to terrain,prohibited and controlled airspace. The chart will be geo-referenced, i.e. if your Electronic Flight Bag system allows the display of an aircraft spotter,or, if it has moving map functionality, the position of the own airplane can be displayed for general awareness.The overview chart serves as supplementary information and is therefore available only if requested by an airline.Heading Index Oval, Index Number, Special IssueA square-end oval outline is used to distinguish Airline charts from the Standard versions. Overview charts will be filed before the 10-2/10-3 SID/DP/STAR charts. The index number is 10-1S, 10-1S1, 10-1S2 etc.The Airline Icon is placed between the airport name and the revision date. SID/STAR Overview BlockA negative “SID OVERVIEW” or “STAR OVERVIEW” block is shown top right below the location/country name to indicate the purpose of thechart.3 Arrival/Departure RunwaysAll runways for which SID/STAR routes exist are shown in the heading.Examples:STAR OVERVIEW RWYS 04, 06, 09SID OVERVIEW RWYS 15, 18L/RALL RWYS is shown if only one SID or STAR overview sheet exists.Plan View: DME Reference CirclesWhenever a suitable VORDME is available (within 10 NM of the ARP of the airport concerned) DME reference circles are shown. Where no suitableVORDME is available within 10 NM of the ARP, DME distance circles centered on an ILS/LOCDME or stand-alone DME or TACAN location indicating the appropriate identification are shown. DME reference circles are printed in blue. Special Use AirspaceOnly prohibited airspace is shown. The wide crosshatched band used on standard charts is replaced by a thin solid line. Outlines and labels areprinted in blue.
SID/DP/STAR Overview ChartPlan View (Cont.)3 Secondary IFR/VFR Airports and Hydrography printed in blue4 Contours, Terrain High Points and Man-made StructuresA contour interval legend block replaces the contour values normally shown along the contour lines. The lowest starting contour is at least 1500feet above airport elevation. If no contours are shown, no terrain high points/man-made structures are charted unless the man-made structureis 1000AGL or higher.5 Controlled AirspaceOnly the outermost airspace boundaries are shown together with their names and are printed in blue.6North ArrowA small North Arrow as shown below is preferably placed in the upper right corner of the chart. Printed in blue.7 Navaids, Airspace Fixes and DistancesAll navaids are shown which are charted on the SID/DP/STAR charts, with the exception of their morse code. Airspace fixes are generally omitted except those designated as IAF and those that define the beginning/end points of the enroute transitions and named STAR or SID routes.Distances along routes are omitted with the exception when the beginning/end point is off chart. All distances are in whole nces
SID/DP/STAR Overview Chart LegendSID/DP/STAR Overview Chart Legend Airline FormatGeneralSID/DP/STAR Overview Charts are to scale, however, they are not intended for navigation. They serve mainly to enhance terrain and general situational awareness and toprovide basic information useful in flight planning. If ordered by your airline, theseoptional Overview Charts serve as supplementary information only in conjunction withthe associated SID/DP/STAR charts. The following pages briefly explain the differencesand symbols used on the Airline Overview Charts. Blue as an additional color serves tobetter differentiate between primary and secondary information.ApproachOverview ChartChart HeadingLegend 3456 Airline Chart Icon 9 Index Number (Special chart for Airlines)3 Standard Terminal Arrival Overview74 Standard Terminal Arrival Routes to all available runways85 Highest of portrayed Terrain High Point/Man-made Structures or Terrain contours inthe charted plan view. Higher terrain or man-made structures may exist which havenot been portrayed6 North Arrow7 Large Water Area, Lake or Rivers 8 Special Use Airspace (Prohibited, Restricted, Danger Areas) 09 Secondary Airport 0 DME Distance Circles preferrably based on a VORDME on or in the vicinity of theairport concerned. Where no suitable VORDME is available, DME distance circlesmay be centered on ILS/LOCDME, stand alone DME or TACAN locations. For quickidentification, the box of the concerned radio is printed in blue. TMA boundary with name and airspace classification. Brown box indicating the corresponding layers top elevation within the plan view.10
Sample HeadingSampleChart11
14
on the Jeppesen Standard Chart. Approach Chart Legend Approach Chart HeadingLanding Minimums Airport Chart 1. Variation and Hydrography printed in blue. Approach Chart HeadingTake-off Minimums 2. Take-off minimum boxApproach Chart Heading