Transcription
View metadata, citation and similar papers at core.ac.ukbrought to you byCOREprovided by CERN Document ServerChapter 1MASSIVE DATASETS IN ASTRONOMYRobert J. Brunner,S. George Djorgovski,and Thomas A. PrinceCalifornia Institute of TechnologyPasadena, CA 91125 nce@srl.caltech.eduAlex S. SzalayJohns Hopkins UniversityBaltimore, MD 21218 USAszalay@pha.jhu.eduAbstractAstronomy has a long history of acquiring, systematizing, and interpretinglarge quantities of data. Starting from the earliest sky atlases through the firstmajor photographic sky surveys of the 20th century, this tradition is continuingtoday, and at an ever increasing rate.Like many other fields, astronomy has become a very data-rich science, drivenby the advances in telescope, detector, and computer technology. Numerouslarge digital sky surveys and archives already exist, with information contentmeasured in multiple Terabytes, and even larger, multi-Petabyte data sets are onthe horizon. Systematic observations of the sky, over a range of wavelengths,are becoming the primary source of astronomical data. Numerical simulationsare also producing comparable volumes of information. Data mining promisesto both make the scientific utilization of these data sets more effective and morecomplete, and to open completely new avenues of astronomical research.Technological problems range from the issues of database design and federation, to data mining and advanced visualization, leading to a new toolkitfor astronomical research. This is similar to challenges encountered in otherdata-intensive fields today.1
2These advances are now being organized through a concept of the VirtualObservatories, federations of data archives and services representing a new information infrastructure for astronomy of the 21st century. In this article, weprovide an overview of some of the major datasets in astronomy, discuss differenttechniques used for archiving data, and conclude with a discussion of the futureof massive datasets in astronomy.Keywords:1.Astronomy, Digital Sky Survey, Space Telescope, Data-Mining, KnowledgeDiscovery in Databases, Clustering Analysis, Virtual ObservatoryINTRODUCTION: THE NEW DATA-RICHASTRONOMYA major paradigm shift is now taking place in astronomy and space science.Astronomy has suddenly become an immensely data-rich field, with numerousdigital sky surveys across a range of wavelengths, with many Terabytes of pixelsand with billions of detected sources, often with tens of measured parametersfor each object. This is a great change from the past, when often a singleobject or a small sample of objects were used in individual studies. Instead, wecan now map the universe systematically, and in a panchromatic manner. Thiswill enable quantitatively and qualitatively new science, from statistical studiesof our Galaxy and the large-scale structure in the universe, to the discoveriesof rare, unusual, or even completely new types of astronomical objects andphenomena. This new digital sky, data-mining astronomy will also enableand empower scientists and students anywhere, without an access to largetelescopes, to do first-rate science. This can only invigorate the field, as itopens the access to unprecedented amounts of data to a fresh pool of talent.Handling and exploring these vast new data volumes, and actually makingreal scientific discoveries poses a considerable technical challenge. The traditional astronomical data analysis methods are inadequate to cope with thissudden increase in the data volume (by several orders of magnitude). Theseproblems are common to all data-intensive fields today, and indeed we expectthat some of the products and experiences from this work would find uses inother areas of science and technology. As a testbed for these software technologies, astronomy provides a number of benefits: the size and complexity ofthe data sets are nontrivial but manageable, the data generally are in the publicdomain, and the knowledge gained by understanding this data is of broad publicappeal.In this chapter, we provide an overview of the state of massive datasets inastronomy as of mid-2001. In Section 2., we briefly discuss the nature ofastronomical data, with an emphasis on understanding the inherent complexityof data in the field. In Section 3., we present overviews of many of the largest
Massive Datasets in Astronomy3datasets, including a discussion of how the data are utilized and archived.Section 4. provides a thorough discussion of the virtual observatory initiative,which aims to federate all of the distributed datasets described in Section 3.into a coherent archival framework. We conclude this chapter with a summaryof the current state of massive datasets in astronomy.2.THE NATURE OF ASTRONOMICAL DATABy its inherent nature, astronomical data are extremely heterogeneous, inboth format and content. Astronomers are now exploring all regions of theelectromagnetic spectrum, from gamma-rays through radio wavelengths. Withthe advent of new facilities, previously unexplored domains in the gravitationalspectrum will soon be available, and exciting work in the astro-particle domainis beginning to shed light on our Universe. Computational advances haveenabled detailed physical simulations which rival the largest observationaldatasets in terms of complexity. In order to truly understand our cosmos, weneed to assimilate all of this data, each presenting its own physical view of theUniverse, and requiring its own technology.Despite all of this heterogeneity, however, astronomical data and its subsequent analysis can be broadly classified into five domains. In order to clarifylater discussions, we briefly discuss these domains and define some key astrophysical concepts which will be utilized frequently throughout this chapter.Imaging data is the fundamental constituent of astronomical observations, capturing a two-dimensional spatial picture of the Universe withina narrow wavelength region at a particular epoch or instant of time.While this may seem obvious to most people—after all, who hasn’t seena photograph—astrophysical pictures (see, e.g., Figures 1.1 and 1.2) aregenerally taken through a specific filter, or with an instrument covering alimited range of the electromagnetic spectrum, which defines the wavelength region of the observation. Astronomical images can be acquireddirectly, e.g., with imaging arrays such as CCDs1 , or synthesized frominterferometric observations as is customarily done in radio astronomy.Catalogs are generated by processing the imaging data. Each detectedsource can have a large number of measured parameters, including coordinates, various flux quantities, morphological information, and arealextant. In order to be detected, a source must stand out from the background noise (which can be either cosmic or instrumental in origin). Thesignificance of a detection is generally quoted in terms of σ, which is1 ChargeCoupled Device—a digital photon counting device that is superior to photographic images in boththe linearity of their response and quantum efficiency
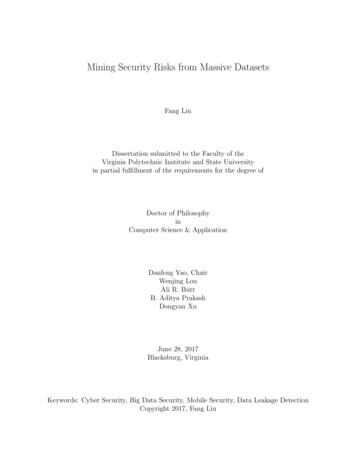
4Figure 1.1 A multiwavelength view of the Crab nebula, a supernova remnant that was firstsighted by Chinese astronomers in 1054 AD. Clearly demonstrated in this montage of imagesare the different physical processes that are manifested in the different spectral regions. ImageCredit: NASA/CXC/SAO.a relative measure of the strength of the source signal relative to thedispersion in the background noise. We note that the source detectionprocess is generally limited both in terms of the flux (total signal overthe background) and surface brightness (intensity contrast relative to thebackground).Coordinates are used to specify the location of astronomical sources inthe sky. While this might seem obvious, the fact that we are sited in a nonstationary reference frame (e.g., the earth rotates, revolves around the sun,and the sun revolves around the center of our Galaxy) complicates thequantification of a coordinate location. In addition, the Earth’s polar axisprecesses, introducing a further complication. As a result, coordinatesystems, like Equatorial coordinates, must be fixed at a particular instantof time (or epoch), to which the actual observations, which are made at
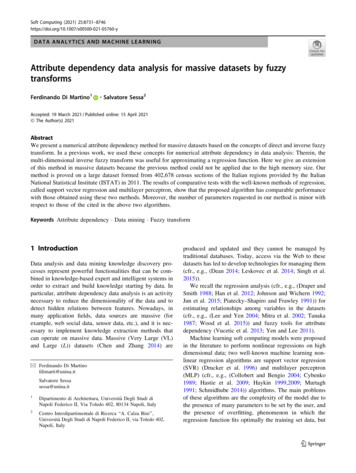
Massive Datasets in Astronomy5Figure 1.2 Making the tradeoff between area and resolution. The image on the left is from theground-based DPOSS survey (see below) of the field of M100, a nearby spiral galaxy. Whilethe entire survey covers on-half of the entire sky, this single image is only one-millionth of thesize of the entire sky (i.e. one microsky). The image on the right is a subset from the deepestoptical image ever taken, the STIS clear image of the Hubble Deep Field South, image credit:R. Williams (STScI), the HDF-S Team, and NASA. This image is 10, 000 times smaller thanthe DPOSS image, thus representing 100 picosky.different times, can be transformed. One of the most popular coordinatesystems is J2000 Equatorial, which is fixed to the initial instant (zerohours universal time) of January 1, 2000. One final caveat is that nearbyobjects (e.g., solar system bodies or nearby stars) move on measurabletimescales. Thus the date or precise time of a given observations mustalso be recorded.Flux quantities determine the amount of energy that is being receivedfrom a particular source. Since different physical processes emit radiation at different wavelengths, most astronomical images are obtainedthrough specific filters. The specific filter(s) used varies, depending onthe primary purpose of the observations and the type of recording device.Historically, photographic surveys used filters which were well matchedto the photographic material, and have names like O, E, J, F , and N .More modern digital detectors have different characteristics (includingmuch higher sensitivity), and work primarily with different filter systems,
6which have names like U , B, V , R, and I, or g, r, i in the optical, andJ, H, K, L, M , and N in the near-infrared.In the optical and infrared regimes, the flux is measured in units ofmagnitudes (which is essentially a logarithmic rescaling of the measuredflux) with one magnitude equivalent to 4 decibels. This is the result ofthe historical fact that the human eye is essentially a logarithmic detector,and astronomical observations have been made and recorded for manycenturies by our ancestors. The zeropoint of the magnitude scale isdetermined by the star Vega, and thus all flux measurements are relativeto the absolute flux measurements of this star. Measured flux values ina particular filter are indicated as B 23 magnitudes, which means themeasured B band flux is 100.4 23 times fainter than the star Vega in thisband. At other wavelengths, like x-ray and radio, the flux is generallyquantified in standard physical units such as ergs cm 2 s 1 Hz 1 . In theradio, observations often include not only the total intensity (indicatedby the Stokes I parameter), but also the linear polarization parameters(indicated by the Stokes Q, and U parameters).Spectroscopy, Polarization, and other follow-up measurements providedetailed physical quantification of the target systems, including distanceinformation (e.g., redshift, denoted by z for extragalactic objects), chemical composition (quantified in terms of abundances of heavier elementsrelative to hydrogen), and measurements of the physical (e.g., electromagnetic, or gravitational) fields present at the source. An examplespectrum is presented in Figure 1.3, which also shows the three opticalfilters used in the DPOSS survey (see below) superimposed.Studying the time domain (see, e.g., Figure 1.4) provides importantinsights into the nature of the Universe, by identifying moving objects(e.g., near-Earth objects, and comets), variable sources (e.g., pulsatingstars), or transient objects (e.g., supernovae, and gamma-ray bursts).Studies in the time domain either require multiple epoch observations offields (which is possible in the overlap regions of surveys), or a dedicatedsynoptic survey. In either case, the data volume, and thus the difficultyin handling and analyzing the resulting data, increases significantly.Numerical Simulations are theoretical tools which can be compared withobservational data. Examples include simulations of the formation andevolution of large-scale structure in the Universe, star formation in ourGalaxy, supernova explosions, etc. Since we only have one Universe andcannot modify the initial conditions, simulations provide a valuable toolin understanding how the Universe and its constituents formed and haveevolved. In addition, many of the physical processes that are involved in
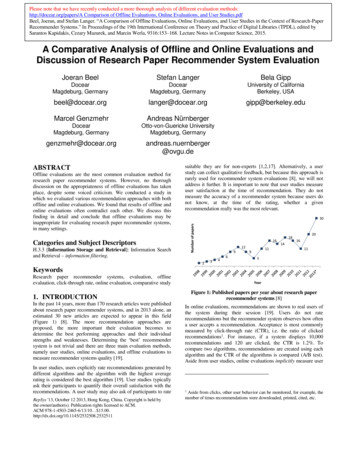
Massive Datasets in Astronomy7Figure 1.3 A spectrum of a typical z 4 quasar PSS 1646 5524, with the DPOSS photographic filter transmission curves (J, F , and N ) overplotted as dotted lines. The prominentbreak in the spectrum around an observed wavelength of 6000 Angstroms is caused by absorption by intergalactic material (that is material between us and the quasar) that is referred to asthe Lyα forest. The redshift of this source can be calculated by knowing that this absorptionoccurs for photons more energetic than the Lyα line which is emitted at 1216 Angstroms.these studies are inherently complex. Thus direct analytic solutions areoften not feasible, and numerical analysis is required.3.LARGE ASTRONOMICAL DATASETSAs demonstrated below, there is currently a great deal of archived data inAstronomy at a variety of locations in a variety of different database systemssystems. In this section we focus on ground-based surveys, ground-basedobservatories, and space-based observatories. We do not include any discussionof information repositories such as the Astrophysics Data System2 (ADS), theSet of Identifications, Measurements, and Bibliography for Astronomical Data3(SIMBAD), or the NASA Extragalactic Database4 (NED), extremely valuableas they are. This review focuses on more homogeneous collections of datafrom digital sky surveys and specific missions rather than archives which aremore appropriately described as digital libraries for astronomy.Furthermore, we do not discuss the large number of new initiatives, including the Large-Aperture Synoptic Survey Telescope (LSST), the California2 http://adswww.harvard.edu/3 http://cdsweb.u-strasbg.fr/Simbad.html4 http://ned.ipac.caltech.edu
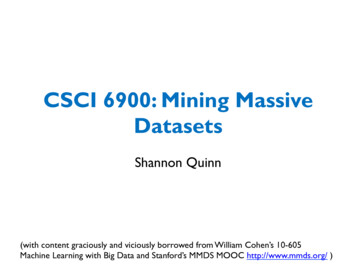
8Figure 1.4 Example of a discovery in the time domain. Images of a star, PVO 1558 3725,seen in the DPOSS plate overlaps in J ( green, top) F ( red, middle) and N ( near-infrared,bottom). Since the plates for the POSS-II survey were taken at different epochs (i.e. they weretaken on different days), that can be separated by several years (the actual observational epochis indicated below each panel), we have a temporal recording of the intensity of the star. Noticehow the central star is significantly brighter in the lower right panel. Subsequent analysis hasnot indicated any unusual features, and, as a result, the cause, amplitude, and duration of theoutburst are unknown.Extremely Large Telescope (CELT), the Visible and Infrared Survey Telescope 5(VISTA), or the Next Generation Space Telescope6 (NGST), which will providevast increases in the quality and quantity of astronomical data.3.1GROUND-BASED SKY SURVEYSOf all of the different astronomical sources of data, digital sky surveys are themajor drivers behind the fundamental changes underway in the field. Primarily5 http://www.vista.ac.uk6 http://www.ngst.stsci.edu/
Massive Datasets in Astronomy9this is the result of two factors: first, the sheer quantity of data being generatedover multiple wavelengths, and second, as a result of the homogeneity of thedata within each survey. The federation of different surveys would furtherimprove the efficacy of future ground- and space-based targeted observations,and also open up entirely new avenues for research.In this chapter, we describe only some of the currently existing astronomicalarchives as examples of the types, richness, and quantity of astronomical datawhich is already available. Due to the space limitations, we cannot cover manyother, valuable and useful surveys, experiments and archives, and we apologizefor any omissions. This summary is not meant to be complete, but merelyillusory.Photographic plates have long endured as efficient mechanisms for recordingsurveys (they have useful lifetimes in excess of one hundred years and offersuperb information storage capacity, but unfortunately they are not directlycomputer-accessible and must be digitized before being put to a modern scientific use). Their preeminence in a digital world, however, is being challengedby new technologies. While many photographic surveys have been performed,e.g., from the Palomar Schmidt telescope7 in California, and the UK Schmidttelescope in New South Wales, Australia, these data become most useful whenthe plates are digitized and cataloged.While we describe two specific projects, as examples, several other groupshave digitized photographic surveys and generated and archived the resultingcatalogs, including the Minnesota Automated Plate Scanner8 (?, APS;)]pennington93,the Automated Plate Measuring Machine9 (?, APM;)]mcmahon92 at the Institute of Astronomy, Cambridge, UK, the coordinates, sizes, magnitudes, orientations, and shapes (?, COSMOS;)]yentis92 and its successor, SuperCOSMOS10 ,plate scanning machines at the Royal Observatory Edinburgh. Probably themost popular of the digitized sky surveys (DSS) are those produced at theSpace Telescope Science Institute11 (STScI) and its mirror sites in Canada 12 ,Europe13 , and Japan14 .DPOSS The Digitized Palomar Observatory Sky Survey15 (DPOSS) is a digitalsurvey of the entire Northern Sky in three visible-light bands, formally7ASchmidt telescope has an optical design which allows it to image a very wide field, typically severaldegrees on a side. This is in contrast to most large telescopes which have field of views that are measuredin arcminutes.8 http://aps.umn.edu/9 http://www.ast.cam.ac.uk/ mike/casu/apm/apm.html10 http://www.roe.ac.uk/cosmos/scosmos.html11 http://archive.stsci.edu/dss/12 http://cadcwww.dao.nrc.ca/dss/13 http://archive.eso.org/dss/dss/14 http://dss.nao.ac.jp15 http://dposs.caltech.edu/
10indicated by g, r, and i (blue-green, red, and near-infrared, respectively).It is based on the photographic sky atlas, POSS-II, the second PalomarObservatory Sky Survey, which was completed at the Palomar 48-inchOschin Schmidt Telescope (?). A set of three photographic plates, onein each filter, each covering 36 square degrees, were taken at each of 894pointings spaced by 5 degrees, covering the Northern sky (many of thesewere repeated exposures, due to various artifacts such as the aircraft trails,plate defects, etc.). The plates were then digitized at the Space TelescopeScience Institute (STScI), using a laser micro-densitometer. The platesare scanned with 1.0”pixels, in rasters of 23,040 square, with 16 bitsper pixel, producing about 1 Gigabyte per plate, or about 3 Terabytes ofpixel data in total.These scans were processed independently at STScI (for the purposes ofconstructing a new guide star catalog for the HST) and at Caltech (forthe DPOSS project). Catalogs of all the detected objects on each platewere generated, down to the flux limit of the plates, which roughly corresponds to the equivalent blue limiting magnitude of approximately 22. Aspecially developed software package, called SKICAT (Sky Image Cataloging and Analysis Tool; ?) was used to analyze the images. SKICATincorporates some machine learning techniques for object classificationand measures about 40 parameters for each object in each band. Stargalaxy classification was done using several methods, including decisiontrees and neural nets; for brighter galaxies, a more detailed morphologicalclassification may be added in the near future. The DPOSS project alsoincludes an extensive program of CCD calibrations done at the Palomar60-inch telescope. These CCD data were used both for magnitude calibrations, and as training data sets for object classifiers in SKICAT. Theresulting object catalogs were combined and stored in a Sybase relationalDBMS system; however, a more powerful system is currently being implemented for more efficient scientific exploration. This new archivewill also include the actual pixel data in the form of astrometrically andphotometrically calibrated images.The final result of DPOSS will be the Palomar Norris Sky Catalog(PNSC), which is estimated to contain about 50 to 100 million galaxies,and between 1 and 2 billion stars, with over 100 attributes measuredfor each object, down to the equivalent blue limiting magnitude of 22,and with star-galaxy classifications accurate to 90% or better down tothe equivalent blue magnitude of approximately 21. This represents aconsiderable advance over other, currently existing optical sky surveysbased on large-format photographic plates. Once the technical and sci-
Massive Datasets in Astronomy11entific verification of the final catalog is complete, the DPOSS data willbe released to the astronomical community.As an indication of the technological evolution in this field, the PalomarOschin Schmidt telescope is now being retrofitted with a large CCDcamera (QUEST2) as a collaborative project between Yale University,Indiana University, Caltech, and JPL. This will lead to pure digital skysurveys from Palomar Observatory in the future.USNO-A2 The United States Naval Observatory Astrometric (USNO-A2) catalog16 (?) is a full-sky survey containing over five hundred million unresolved sources down to a limiting magnitude of B 20 whose positionscan be used for astrometric references. These sources were detectedby the Precision Measuring Machine (PMM) built and operated by theUnited States Naval Observatory Flagstaff Station during the scanningand processing of the first Palomar Observatory Sky Survey (POSS-I)O and E plates, the UK Science Research Council SRC-J survey plates,and the European Southern Observatory ESO-R survey plates. The totalamount of data utilized by the survey exceeds 10 Terabytes.The USNO-A2 catalog is provided as a series of binary files, organizedaccording to the position on the sky. Since the density of sources on thesky varies (primarily due to the fact that our galaxy is a disk dominatedsystem), the number of sources in each file varies tremendously. In orderto actually extract source parameters, special software, which is providedalong with the data is required. The catalog includes the source position,right ascension and declination (in the J2000 coordinate system, withthe actual epoch derived as the mean of the blue and red plate) and theblue and red magnitude for each star. The astrometry is tied to the ACTcatalog (?). Since the PMM detects and processes at and beyond thenominal limiting magnitude of these surveys, a large number of spuriousdetections are initially included in the operational catalog. In order toimprove the efficacy of the catalog, sources were required to be spatiallycoincident, within a 2” radius aperture, on the blue and red survey plate.SDSS The Sloan Digital Sky Survey17 (SDSS) is a large astronomical collaboration focused on constructing the first CCD photometric survey of theNorth Galactic hemisphere (10,000 square degrees—one-fourth of theentire sky). The estimated 100 million cataloged sources from this survey will then be used as the foundation for the largest ever spectroscopicsurvey of galaxies, quasars and stars.16 http://ftp.nofs.navy.mil/projects/pmm/a2.html17 http://www.sdss.org/
12The full survey is expected to take five years, and has recently begun fulloperations. A dedicated 2.5m telescope is specially designed to take widefield (3 degree x 3 degree) images using a 5 by 6 mosaic of 2048x2048CCD’s, in five wavelength bands, operating in scanning mode. The totalraw data will exceed 40 TB. A processed subset, of about 1 TB in size,will consist of 1 million spectra, positions and image parameters forover 100 million objects, plus a mini-image centered on each object inevery color. The data will be made available to the public (see, e.g.,Figure 1.5 for a public SDSS portal) at specific release milestones, andupon completion of the survey.During the commissioning phase of the survey data was obtained, in partto test out the hardware and software components. Already, a wealth ofnew science has emerged from this data.The Sloan Digital Sky Survey (SDSS) is a joint project of The University of Chicago, Fermilab, the Institute for Advanced Study, the JapanParticipation Group, The Johns Hopkins University, the Max-PlanckInstitute for Astronomy (MPIA), the Max-Planck-Institute for Astrophysics (MPA), New Mexico State University, Princeton University, theUnited States Naval Observatory, and the University of Washington.Figure 1.5 A public portal into the Sloan Digital Sky Survey, which is the cosmic equivalentto the Human Genome project.
Massive Datasets in Astronomy13There is a large number of experiments and surveys at aimed at detectingtime-variable sources or phenomena, such as gravitational microlensing, optical flashes from cosmic gamma-ray bursts, near-Earth asteroids and other solarsystem objects, etc. A good list of project web-sites is maintained by Professor Bohdan Paczynski at Princeton18 . Here we describe several interestingexamples of such projects.MACHO The MACHO project19 was one of the pioneering astronomicalprojects in generating large datasets. This project was designed to lookfor a particular type of dark matter collectively classified as MassiveCompact Halo Objects (e.g., brown dwarfs or planets) from whence theproject’s name was derived. The signature for sources of this type isthe amplification of the light from extragalactic stars by the gravitationallens effect of the intervening MACHO. While the amplitude of the amplification can be large, the frequency of such events is extremely rare.Therefore, in order to obtain a statistically useful sample, it is necessaryto photometrically monitor several million stars over a period of severalyears. The MACHO Project is a collaboration between scientists at theMt. Stromlo and Siding Spring Observatories, the Center for ParticleAstrophysics at the Santa Barbara, San Diego, and Berkeley campusesof the University of California, and the Lawrence Livermore NationalLaboratory.The MACHO project built a two channel system that employs eight2048x2048 CCDs, which was mounted and operated on the 50-inch telescope at Mt. Stromlo. This large CCD instrument presented a highdata rate (especially given that the survey commenced in 1992) of approximately several Gigabytes per night. Over the course of the survey,nearly 100,000 images were taken and processed, with a total data volume exceeding 7 Terabytes. While the original research goal of findingmicrolensing events was realized (essentially by a real-time data-analysissystem), the MACHO data provides an enormously useful resource forstudying a variety of variable sources. Unfortunately, funding was neversecured to build a data archive, limiting the utility of the data primarilyto only those members of the MACHO science team. Another similarproject is the OGLE-II20 , or the second Optical Gravitational LensingExperiment, which has a total data volume in excess of one Terabyte.18 http://astro.princeton.edu/faculty/bp.html19 http://wwwmacho.anu.edu.au/20 http://astro.princeton.edu/ ogle
14ROTSE The Robotic Optical Transient Search Experiment21 is an experimental program to search for astrophysical optical transients on time scalesof a fraction of a second to a few hours. While the primary incentive ofthis experiment has been to find the optical counterparts of gamma-raybursts (GRBs), additional variability studies have been enabled, including a search for orphan GRB afterglows, and an analysis of a particulartype of variable star, known as an RR Lyrae, which provides informationon the structure of our Galaxy.The ROTSE project initially began operating in 1998, with a four-foldtelephoto array, imaging the whole visible sky twice a night to limitingflux limit of approximately 15.5. The total data volume for the originalproject is approximately four Terabytes. Unlike other imaging programs,however, the large field of view of the telescope results in a large numberof sources per field (approximately 40,000). Therefore, reduction of theimaging data to object lists does not compress the data as much as is usualin astronomical data. The data is persisted on a robotic tape library, butinsufficient resources have prevented the creation of a public archive.The next stage of the ROTSE project is a set of four (and eventuallysix) half meter telescopes to be sited globally. Each telescope has a 2degree field of view and operations, including the data analysis, and itwill be fully automated. The first data is expected to begin to flow during2001 and the total data volume will be approximately four Terabytes.The limiting flux of the next stage of the ROTSE experiment will beapproximately 18 – 19, or more than ten times deeper than the originalexperiment. The ROTSE (and other variability survey) data will provide important multi-epoch measurements as a complement to the singleepoch surveys (e.g., DPOSS, USNOA2, and the SDSS). Other examplesof similar programs include the Livermore Optical Transient ImagingSystem (LOTIS) program22 , which is nearly identical to the originalROTSE experiment, and its successor, Super-LOTIS.NEAT Near Earth Asteroid Tracking (NEAT) program23 is one of several programs that are designed to discover and characterize near earth objects(e.g., Asteroids and comets). Fundamentally, these surveys cover thousands of square degrees of the sky every month to a limiting flux depthof approximately 17 – 20, depending
provide anoverview of some of the major datasets inastronomy, discuss different techniques used for archiving data, and conclude with a discussion of the future of massive datasets in astronomy. Keywords: Astronomy, Digital Sky Survey, Space Telescope, Data-Mining, Knowledge Discovery in Databases, Clustering Analysis, Virtual Observatory 1.