Transcription
Repeatability reproducibilitywith a standard methodISO 5725-2Tuesday 30th August 20057th ISTA seminar on statisticsHohenheim GermanySylvain Gregoire
ISO standards ISO/IEC 17025:1999 General requirements for the competence of testing andcalibration laboratories ISO 5725-1:1994 Accuracy (trueness and precision) of measurement methodsand results -- Part 1: General principles and definitionsISO 5725-2:1994 Accuracy (trueness and precision) of measurement methodsand results -- Part 2: Basic method for the determination ofrepeatability and reproducibility of a standardmeasurement method ISO 5725-3:1994 Accuracy (trueness and precision) of measurement methodsand results -- Part 3: Intermediate measures of the precision of a standardmeasurement methodISO 5725-4:1994 Accuracy (trueness and precision) of measurement methodsand results -- Part 4: Basic methods for the determination of the trueness ofa standard measurement method ISO 5725-5:1998 Accuracy (trueness and precision) of measurement methodsand results -- Part 5: Alternative methods for the determination of theprecision of a standard measurement method ISO 5725-6:1994 Practical examplesISTA Statistics Committee2
repeatability and reproducibilityof a standard measurement methodISO 5725-2 when test result is a numerical value (obtainedor computed), where participating laboratories used agiven standard method, to test a set of samples, withreplicatesrepeatability is a measure for the within-laboratoryconsistency. It is a variance (variability of measurements)between-laboratory variance is a measure for variationbetween the participating laboratories.reproducibility is the sum of repeatability and betweenlaboratory variance.value for a lab, a method, a sample;each sample analysed at least twice in a lab for a methodISTA Statistics Committee3
when test result numerical valueobtained or computed on a continuous scaleISO 5725-2The repeatability is a measure for the within-laboratory consistency.Pj (nlj – 1)S2ljl 1Repeatability variance:S2rj Pj (nlj – 1)l 1The between-laboratory variance is a measure for variation between theparticipating laboratories.S2dj - S2rjBetween-laboratory variance: S2Lj njThe reproducibility is the sum of repeatability and between-laboratoryvariance.Reproducibility variance: S2Rj S2rj S2LjISTA Statistics Committee4NB :value for a lab, a method, a sample; each sample analysed at least twice in a lab for a method
where1PjS2dj nlj( zlj - zj)2pj – 1 l 1Pj n2ljand1Pjnj nlj pj – 1 l 1l 1 Pj nljl 1l laboratoryj methodnlj Number of test results obtained by laboratory l for method jPj Number of laboratories with non-missing results for method jSlj Standard deviation for method j and laboratory l Zj overall mean for method j Zlj mean for method j and laboratory lISTA Statistics Committee5
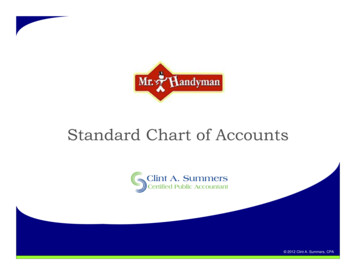
Type of data ab02lab02 5sple5 216.22rep120.4rep219.91 ISTA Statistics.Committee3 to 30 laboratories2 to XX samples2 to 10 replicatesquantitative valuesVisible on this screen:2 labs5 samples2 reps6
Free Tool Includes raw data, to be kept and if possible to be reproduced in extenso in report means and variances by laboratory and by laboratory X sample repeatability and reproducibility values h and k values and the test of their significanceISTA Statistics Committee7
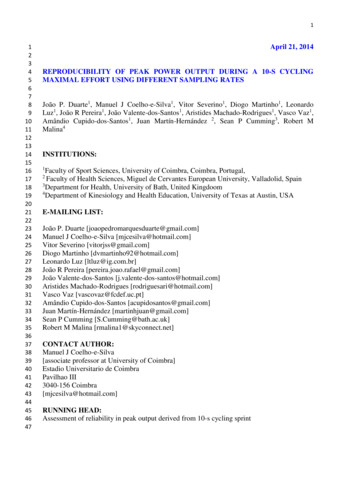
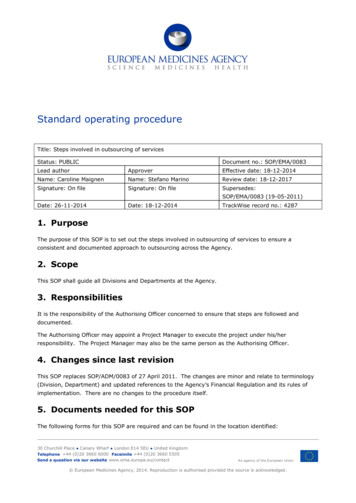
h values shows if a lab has a tendency to under or over estimate1%ISTA Statistics Committee1%8
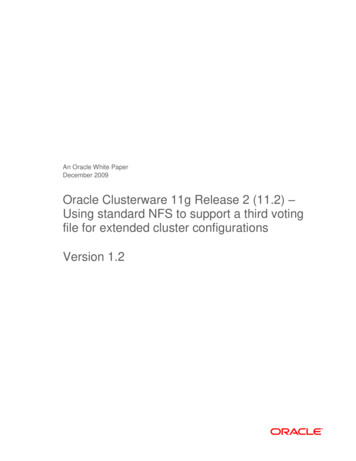
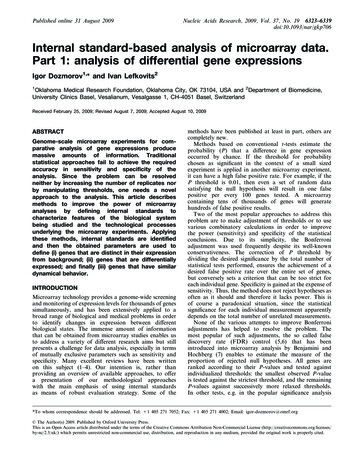
k values indicates the relative variability of the e1sple2sple5sple4k valuesk 1%2.112.262.012.39 1%2.45 1%k 5%5%5%5%5%5%ISTA Statistics Committeek crit 1%2.292.292.292.292.29k crit 5%1.91.91.91.91.99
Guided tourISTA Statistics Committee10
Exercise 1 Open charbonISO 5725 2000.mdb Access database Obtain a report and look at it Look at table data––––––How many labs did the test?How many samples were used?What is approx. the repeatability?Look at graphs mean by lab, data and h valuesLook at graph k valuesLook at h and k critical values DiscussionISTA Statistics Committee11
More methods, or factors You may wish to use the program in caseswhere you have different methods, or made afactor vary in a method you can simply split in different analysis perlevel of factor (factor a, factor b, ) You may want to design an experiment withmany factors and for each factor havedifferent modalities. In that case use ANOVA or GLM or Youare too far from the ISO standard definitionISTA Statistics Committee12
For each combination of XXX*YYY I have eMethodLotRepeatValueXXXYYYRepeatValue10 labs 4 lots 3 methods - 1 report per method (or per lot)8 labs, 3 methods, 3 levels of presence - 1 report per method (or level)3 methods 4 levels of presence 10 labs - “labs as repeats”Etc Remember repeatability, reproducibility is computed by “YYYY”(lot/sample)ISTA Statistics Committee13
h and k valuespj Critical h values at 1% and 5%hij ( y ij y j ) / 1 /( p j 1) ( y ij y j ) 2i 1High h value over estimate / general meanLow h value under estimate / general mean Critical k values at 1% and 5%High k value, greater variability in repeats2k sp/s ijijijjLow k values are not spotted on the critical valuesIf Nb Labs* Nb samples 100 - 1 and 5 are expected at 1% and 5%With 10 labs 3 samples 30 - 0 or 1 at 1% 1 or 2 at 5% are expected Over-estimate compared to mean of all values; it does not tell who is rightwho is wrongNo true value is given in the computations, no reference laboratory is givenin the computationsThese are alerts to take into account by the expertsISTA Statistics Committee14
Exercise 2 two differences to discover Open charbon2ISO5725 2000.mdb Access databaseObtain a report and look at itChange the heading of the report, with your nameLook at table dataUse of data set charbon2––––––How many labs did the test? (see names)How many samples were used? (see names)What is approx. the repeatability?Look at graphs mean by lab, data and h valuesLook at graph k valuesLook at h and k critical values discussionISTA Statistics Committee15
Exercise 2 two differences to discover Open harbon2ISO5725 XX.mdb Access databaseObtain a report and look at itChange the heading of the report, with your nameLook at table dataUse of data set charbon2––––––How many labs did the test? (see names)How many samples were used? (see names)What is approx. the repeatability?Look at graphs mean by lab, data and h valuesLab 1 lot 1 rep 2 is exoticLook at graph k valuesLook at h and k critical valuesLab5 has less variability discussionLab names and sample nameschangedISTA Statistics Committee16
From office Access to Excel Button std devISTA Statistics Committee17
Suppress lot1 lab 1ISTA Statistics Committee18
Troubleshooting Out of capacity no variability for 1 (any)sample Reproducibility repeatability report with Non normality– use and notify in your report– transform data, advantage tests are ok if goodtransformation, disadvantage you loose technical unitISTA Statistics Committee19
Complete implementation of ISO5725-2 need more than free tool Data check Grubbs to detect outliers Linearity of repeatability along measures (doit with Excel) etc SAS, Statgraphics, and other packages canhelp, specific ISO software are oftenexpensiveISTA Statistics Committee20
ISO 5725-2 when test result is a numerical value (obtained or computed), where participating laboratories used a given standard method, to test a set of samples, with replicates repeatability is a measure for the within-laboratory consistency. It is a variance (variability of measurements) between-laboratory variance is a measure for variationFile Size: 442KBPage Count: 20