Transcription
QuarterlyQuarterly Banking Profile:Second Quarter 2021The Importance of TechnologyInvestments for Community BankLending and Deposit TakingDuring the Pandemic2021Volume 15, Number 3Federal DepositInsurance CorporationFDIC QUARTERLY A
The FDIC Quarterly is published by the Division of Insurance and Research of theFederal Deposit Insurance Corporation and contains a comprehensive summary of themost current financial results for the banking industry. Feature articles appearing in theFDIC Quarterly range from timely analysis of economic and banking trends at the nationaland regional level that may affect the risk exposure of FDIC-insured institutions to researchon issues affecting the banking system and the development of regulatory policy.Single copy subscriptions of the FDIC Quarterly can be obtained through the FDIC PublicInformation Center, 3501 Fairfax Drive, Room E-1002, Arlington, VA 22226. E-mail requestsshould be sent to publicinfo@fdic.gov. Change of address information also should besubmitted to the Public Information Center.The FDIC Quarterly is available online by visiting the FDIC website at www.fdic.gov.To receive e-mail notification of the electronic release of the FDIC Quarterly and theindividual feature articles, subscribe at anJelena McWilliamsDirector, Division of Insurance and ResearchDiane EllisExecutive EditorsGeorge FrenchShayna M. OlesiukManaging EditorsRosalind BennettAlan DeatonPatrick MitchellPhilip A. ShivelyEditorsClayton BoyceKathy ZeidlerPublication ManagerLynne MontgomeryMedia Inquiries(202) 898-6993FDIC QUARTERLY
2021FDICQUARTERLYVolume 15 Number 3Quarterly Banking Profile: Second Quarter 2021FDIC-insured institutions reported aggregate net income of 70.4 billion in second quarter2021, an increase of 51.9 billion (281 percent) from the same quarter a year ago, driven by a 73 billion (117.3 percent) decline in provision expense. Two-thirds of all banks (66.4 percent)reported year-over-year improvement in quarterly net income. The share of profitableinstitutions increased slightly, up 1.4 percent year over year to 95.8 percent. However, netincome declined 6.4 billion (8.3 percent) from first quarter 2021, driven by an increasein provision expense from first quarter 2021 (up 3.7 billion to negative 10.8 billion). Theaggregate return on average assets ratio of 1.24 percent rose 89 basis points from a year agobut fell 14 basis points from first quarter 2021. See page 1Community Bank PerformanceCommunity banks—which represent 91 percent of insured institutions—reported yearover-year quarterly net income growth of 1.9 billion (28.7 percent) in second quarter2021, despite a narrower net interest margin. Nearly two-thirds of all community banks(65 percent) reported higher net income from the year-ago quarter. The pretax return onassets ratio of 1.54 percent rose 20 basis points from a year ago but fell 4 basis points fromfirst quarter 2021. See page 15.Insurance Fund IndicatorsThe Deposit Insurance Fund (DIF) balance totaled 120.5 billion at the end of second quarter2021, an increase of 1.2 billion from the previous quarter. Assessment income, interestearned on invest ments, and negative provisions for insurance losses were the largest sourcesof the increase, offset partially by operating expenses and unrealized losses on availablefor-sale securities. The DIF reserve ratio was 1.27 percent at June 30, 2021, up 2 basis pointsfrom March 31, 2021, and down 3 basis points from June 30, 2020. See page 23.Featured Article:The Importance of Technology Investments for CommunityBank Lending and Deposit Taking During the PandemicCommunity banks that invested more in technology generally reported faster loan anddeposit growth in 2020 than did banks with less technology investment. Moreover, thedifferences in loan and deposit growth associated with technology investment weregreater in 2020 than the differences reported prior to the pandemic. Faster loan growth forcommunity banks with greater technology investment largely stemmed from participationin the Paycheck Protection Program (PPP). These community banks, on average, originateda greater share of PPP loans regardless of the loan size, origination date, or borrowerdistance from the nearest bank branch. Meanwhile, the larger increases in deposit growth ofcommunity banks that invested more in technology were due to increases in deposit balancesof existing customers rather than from new depositors. See page 31.The views expressed are those of the authors and do not necessarily reflect official positions of the Federal Deposit Insurance Corporation. Some of the information usedin the preparation of this publication was obtained from publicly available sources that are considered reliable. However, the use of this information does not constitutean endorsement of its accuracy by the Federal Deposit Insurance Corporation. Articles may be reprinted or abstracted if the publication and author(s) are credited. Pleaseprovide the FDIC’s Division of Insurance and Research with a copy of any publications containing reprinted material.FDIC QUARTERLYi
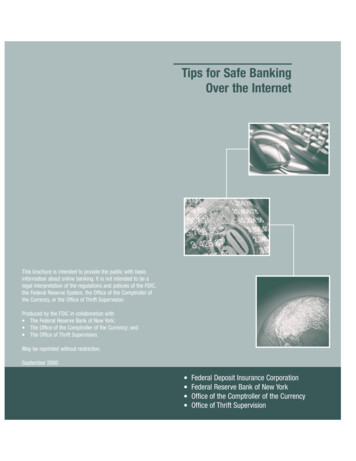
QUARTERLY BANKING PROFILE Second Quarter 2021INSURED INSTITUTION PERFORMANCEQuarterly Net Income Continued to Increase Year Over Year, Driven by a Second Consecutive Quarter ofNegative Provision ExpenseNet Interest Margin Contracted Further to a New Record LowQuarterly Loan Balances Grew for the First Time Since Second Quarter 2020Asset Quality Continued to ImproveQuarterly Net IncomeContinued to Increase YearOver Year, Driven by aSecond Consecutive Quarterof Negative ProvisionExpenseNet income totaled 70.4 billion in second quarter 2021, an increase of 51.9 billion(281 percent) from the same quarter a year ago, driven by a 73 billion (117.3 percent)decline in provision expense. Two-thirds of all banks (66.4 percent) reported year-overyear improvement in quarterly net income. The share of profitable institutions increasedslightly, up 1.4 percent year over year to 95.8 percent. However, net income declined 6.4 billion (8.3 percent) from first quarter 2021, driven by an increase in provision expensefrom first quarter 2021 (up 3.7 billion to negative 10.8 billion). The aggregate return onaverage assets ratio of 1.24 percent rose 89 basis points from a year ago but fell 14 basispoints from first quarter 2021.Net Interest MarginContracted Further to aNew Record LowThe average net interest margin contracted 31 basis points from a year ago to 2.50 percent—the lowest level on record. The contraction is due to the year-over-year reduction inearning asset yields (down 53 basis points to 2.68 percent) outpacing the decline in averagefunding costs (down 22 basis points to 0.18 percent). Both ratios declined from first quarter2021 to record lows. Aggregate net interest income declined 2.2 billion (1.7 percent)from second quarter 2020. Reductions in net interest income at the largest institutionsdrove the aggregate decline in net interest income, as more than three-fifths of all banks(64.1 percent) reported higher net interest income compared with a year ago.Noninterest IncomeContinued to IncreaseDespite Lower TradingRevenueNoninterest income increased (up 5 billion, or 7.1 percent) from second quarter 2020 dueto improvement in several categories. During the year ending second quarter 2021, “allother noninterest income” rose 7.9 billion (27.5 percent), offsetting both a 5.9 billion(42.1 percent) decline in trading revenue and a reduction in net gains on loan sales of 1.5 billion (19.7 percent).1 Increased income from service charges on deposit accounts(up 1.5 billion, or 21.5 percent) and fiduciary activities (up 1.2 billion, or 13.1 percent)from second quarter 2020 also supported the year-over-year improvement in noninterestincome. More than two-thirds of all institutions (69.6 percent) reported higher noninterestincome compared with the year-ago quarter.1 Allother noninterest income includes, but is not limited to, bankcard and credit card interchange fees, income and feesfrom wire transfers, and income and fees from automated teller machines.Chart 1Chart 2Quarterly Net IncomeQuarterly Net Interest MarginAll FDIC-Insured Institutions Billions100All FDIC-Insured InstitutionsSecurities and Other Gains/Losses, NetNet Operating 08 2009 2010 2011 2012 2013 2014 2015 2016 2017 2018 2019 2020 2021Source: FDIC.Assets 100 Million - 1 BillionAssets 100 Million4.56020Assets 250 BillionAssets 10 Billion - 250 BillionAssets 1 Billion - 10 Billion1.00.50.02008 2009 2010 2011 2012 2013 2014 2015 2016 2017 2018 2019 2020 2021Source: FDIC.FDIC QUARTERLY1
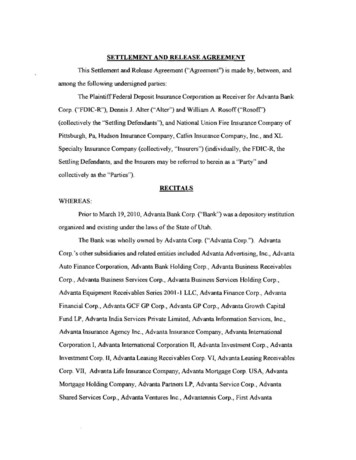
2021 Volume 15 Number 3Noninterest ExpenseRelative to Average AssetsDeclined to a Record LowNoninterest expense rose 3.7 billion (3 percent) year over year, led by an increase in salaryand benefit expense and “all other noninterest expense.” Nearly three-fourths of all banks(74.5 percent) reported higher noninterest expense year over year. Higher average assetsper employee (up 0.9 million) also increased from a year ago to 11.1 million. However,noninterest expense as a percentage of average assets continued to decline, reaching arecord low of 2.23 percent, down 14 basis points from the year-ago quarter.Net Operating Revenue toAverage Assets Continuedto DeclineNet operating revenue (net interest income plus noninterest income) increased 2.8 billion(1.4 percent) from the year-ago quarter as improvement in noninterest income offsetthe decline in net interest income. However, growth in average assets and decliningnet interest income contributed to a 29 basis point decline in the ratio of quarterly netoperating revenue to average assets. The ratio stood at 3.62 percent for the quarter—thelowest level since third quarter 1984.Provision Expense WasNegative for the SecondConsecutive QuarterProvisions for credit losses (provisions) increased 3.7 billion from first quarter 2021 butdeclined 73 billion (117.3 percent) from the year-ago quarter to negative 10.8 billion.2 Morethan three-fifths of all institutions (63.3 percent) reported lower provisions compared withthe year-ago quarter. Nearly 14 percent of institutions reported an increase in provisionsduring the same period, while the remaining institutions reported no material change.The net number of banks that have adopted current expected credit loss (CECL) accountingfell by 1 to 319 from first quarter 2021.3 CECL adopters reported aggregate negativeprovisions of 10.7 billion in second quarter, an increase of 4.3 billion from the previousquarter and a reduction of 67.6 billion from one year ago. Provisions for banks that havenot adopted CECL accounting totaled negative 128.1 million (a reduction of 530.6 millionfrom a quarter ago and 5.2 billion from one year ago).Allowance for Loan andLease Losses to TotalLoans Remained HigherThan Pre-Pandemic LevelThe allowance for loan and lease losses (ALLL) as a percentage of total loans and leasesdeclined 41 basis points to 1.80 percent from the year-ago quarter due to negative provisions,but ALLL remains higher than the level of 1.18 percent reported in fourth quarter 2019.Similarly, the ALLL as a percentage of loans that are 90 days or more past due or innonaccrual status (coverage ratio) declined 27 percentage points from the year-ago quarterto 178 percent but continued to exceed the financial crisis average of 79.1 percent.4 All insuredinstitutions except the largest Quarterly Banking Profile asset size group (greater than 250 billion) reported higher aggregate coverage ratios compared with first quarter 2021.2 Provisionsfor credit losses include both losses for loans and securities for CECL adopters but only loan losses fornon-adopters.3 Changes to the number of CECL accounting adopters may result from closures, mergers and acquisitions, orexamination or audit findings.4 The financial crisis refers to the period between December 2007 and June 2009.Chart 3Chart 4Change in Quarterly Loan-Loss ProvisionsReserve Coverage RatioAll FDIC-Insured InstitutionsAll FDIC-Insured InstitutionsLoan-Loss Reserves (Left Axis)Reserve Coverage Ratio (Right Axis)Noncurrent Loans (Left Axis)Coverage Adjusted for GNMA Guaranteed Loans (Right Axis)Noncurrents Adjusted for GNMA Guaranteed Loans (Left Axis)Quarter-Over-Quarter Change( Billions)5040 Billions4503020400103000-10-20-30-40-50-602008 2009 2010 2011 2012 2013 2014 2015 2016 2017 2018 2019 2020 2021Source: FDIC.2 FDIC QUARTERLYCoverage Ratio (Percent)2502003501502502001001501005050002008 2009 2010 2011 2012 2013 2014 2015 2016 2017 2018 2019 2020 2021Source: FDIC.Note: The reserve coverage ratio is the loan-loss reserves to noncurrent loans and leases.
QUARTERLY BANKING PROFILENoncurrent LoansContinued to DeclineQuarter Over QuarterLoans that were 90 days or more past due or in nonaccrual status (noncurrent loans)continued to decline (down 13.2 billion, or 10.8 percent) from first quarter 2021, supportinga 12 basis point reduction in the noncurrent rate to 1.01 percent. Noncurrent 1–4 familyresidential loans declined most among loan categories from the previous quarter (down 5.9 billion, or 10.9 percent), followed by noncurrent commercial and industrial (C&I)loans (down 3.1 billion, or 13.9 percent). Three-fifths of all banks reported a reduction innoncurrent loans compared with first quarter 2021.The Net Charge-Off RateDeclined Further to aRecord LowNet charge-offs continued to decline for the fourth consecutive quarter (down 8.3 billion, or 53.2 percent). In second quarter, the net charge-off rate fell 30 basis pointsto 0.27 percent, a record low. A decline in net charge-offs of credit card loans (down 3.3 billion, or 39.8 percent) and C&I loans (down 2.9 billion, or 69.7 percent) drove threefourths (75.5 percent) of the reduction in net charge-offs from the year-ago quarter. Morethan half of all banks (51.6 percent) reported a decline in net charge-offs from a year ago.Total Assets Increased,Especially Those WithMaturities of More ThanFive YearsTotal assets increased 224.8 billion (1 percent) from first quarter 2021 to 22.8 trillion.More than four-fifths (86.1 percent) of all banks reported an increase in assets withcontractual maturities greater than five years compared with a quarter ago. Cash andbalances due from depository institutions declined 108 billion (3 percent), while securitiesrose 248.9 billion (4.5 percent). Growth in mortgage-backed securities (up 122.7 billion,or 3.8 percent) and U.S. Treasury securities (up 91.2 billion, or 8.5 percent) continued tospur quarterly increases in total securities. Growth in held-to-maturity securities fromfirst quarter 2021 (up 273.6 billion, or 16.8 percent) outpaced that of available-for-sale(AFS) securities (down 27.3 billion, or 0.7 percent).Quarterly Loan BalancesGrew for the First TimeSince Second Quarter2020Loan and lease balances increased 33.2 billion (0.3 percent) from the previous quarter, thefirst quarterly increase in loan balances since second quarter 2020. An increase in creditcard loan balances (up 30.9 billion, or 4.1 percent) and an increase in auto loan balances(up 18.9 billion, or 3.8 percent) drove this growth. Half (50.3 percent) of all institutionsreported a quarterly increase in total loans.Compared with second quarter 2020, loan and lease balances contracted slightly (down 133.9 billion, or 1.2 percent), driven by a reduction in C&I loans (down 360.4 billion, or13.4 percent). An increase in “all other loans” (up 182.8 billion, or 18.2 percent) mitigated theannual contraction in total loan balances.5 Compared with the year-ago quarter, more thanhalf (52.8 percent) of all institutions reported a decline in total loans, but more than threequarters (76.4 percent) of all institutions reported an increase in unused commitments to lend.5 “Allother loans” includes, but is not limited to, loans to nondepository institutions and loans for purchasing orcarrying securities.Chart 5Chart 6Noncurrent Loan Rate and Quarterly Net Charge-Off RateAll FDIC-Insured InstitutionsPercent6Noncurrent RateQuarterly Net Charge-Off RateQuarterly Change in Loan BalancesAll FDIC-Insured Institutions rly Change (Left Axis)12-Month Growth Rate (Right Axis)-200-4-300-82008 2009 2010 2011 2012 2013 2014 2015 2016 2017 2018 2019 2020 2021102008 2009 2010 2011 2012 2013 2014 2015 2016 2017 2018 2019 2020 2021Source: FDIC.Source: FDIC.Note: FASB Statements 166 and 167 resulted in the consolidation of large amounts of securitizedloan balances back onto banks' balance sheets in the first quarter of 2010. Although the totalamount consolidated cannot be precisely quantified, the industry would have reported a declinein loan balances for the quarter absent this change in accounting standards.FDIC QUARTERLY 3
2021 Volume 15 Number 3Deposits Continued toGrow but at a ModeratedPace in Second Quarter2021Deposits grew 271.9 billion (1.5 percent) in second quarter, down from the growth rate of3.6 percent reported in first quarter 2021. The deposit growth rate in second quarter is nearthe long-run average growth rate of 1.2 percent.6 Deposits above 250,000 continued todrive the quarterly increase (up 297.8 billion, or 3.1 percent) and offset a decline in depositsbelow 250,000 (down 53.6 billion, or 0.7 percent). Noninterest-bearing deposit growth(up 175 billion, or 3.5 percent) continued to outpace that of interest-bearing deposits (up 53.3 billion, or 0.4 percent), with more than half of banks (57.3 percent) reporting highernoninterest-bearing deposit balances compared with the previous quarter.Equity Capital GrowthRemained StrongEquity capital rose 55.3 billion (2.5 percent) from first quarter 2021. Retained earningscontributed 33.9 billion to equity formation despite a decline in retained earnings fromfirst quarter (down 19.1 billion, or 36 percent). Banks distributed 51.9 percent of secondquarter earnings as dividends, which were up 12.7 billion (53 percent) from a quarterago. Nearly one-third (32 percent) of banks reported higher dividends compared with theyear-ago quarter. The number of institutions with capital ratios that did not meet PromptCorrective Action requirements for the well-capitalized category increased by three to ninefrom first quarter 2021.7Three New Banks Openedin Second Quarter 2021The number of FDIC-insured institutions declined from 4,978 in first quarter 2021 to4,951.8 During second quarter 2021, three new banks opened, 28 institutions merged withother FDIC-insured institutions, two banks ceased operations, and no banks failed. Thenumber of banks on the FDIC’s “Problem Bank List” declined by four from first quarter to51. Total assets of problem banks declined 8.4 billion (15.4 percent) from first quarter to 45.8 billion.Author:Erica Jill TholmerSenior Financial AnalystDivision of Insurance and Research6 Thelong-run average growth rate is based on the period between Q1 1984 and Q4 2012.Corrective Action categories are assigned based on reported capital ratios only and do not include the effects ofregulatory downgrades.8 The number of insured financial institutions excludes two banks that did not file Call Reports this quarter but continueto have active banking charters.7 PromptChart 7Quarterly Change in DepositsAll FDIC-Insured Institutions BillionsChart 8Number and Assets of Banks on the “Problem Bank List”Number1,000Assets of Problem BanksNumber of Problem BanksAssets ( 8 2009 2010 2011 2012 2013 2014 2015 2016 2017 2018 2019 2020 2021Source: FDIC.4 FDIC QUARTERLY002008 2009 2010 2011 2012 2013 2014 2015 2016 2017 2018 2019 2020 2021Source: FDIC.
QUARTERLY BANKING PROFILETABLE I-A. Selected Indicators, All FDIC-Insured Institutions*Return on assets (%)Return on equity (%)Core capital (leverage) ratio (%)Noncurrent assets plus other real estate owned to assets (%)Net charge-offs to loans (%)Asset growth rate (%)Net interest margin (%)Net operating income growth (%)Number of institutions reportingCommercial banksSavings institutionsPercentage of unprofitable institutions (%)Number of problem institutionsAssets of problem institutions (in billions)Number of failed .008.830.510.307.802.53332.424,9514,3366153.3751 65.4552 74.6856 3.7551 3.4460 .6195 48123 285* Excludes insured branches of foreign banks (IBAs).** Through June 30, ratios annualized where appropriate. Asset growth rates are for 12 months ending June30.TABLE II-A. Aggregate Condition and Income Data, All FDIC-Insured Institutions(dollar figures in millions)Number of institutions reportingTotal employees (full-time equivalent)CONDITION DATATotal assetsLoans secured by real estate1-4 Family residential mortgagesNonfarm nonresidentialConstruction and developmentHome equity linesCommercial & industrial loansLoans to individualsCredit cardsFarm loansOther loans & leasesLess: Unearned incomeTotal loans & leasesLess: Reserve for losses*Net loans and leasesSecurities**Other real estate ownedGoodwill and other intangiblesAll other assets2nd Quarter20211st Quarter20212nd 7,2215,0662,077,846-2.3-0.9 909 732 al liabilities and capitalDepositsDomestic office depositsForeign office depositsOther borrowed fundsSubordinated debtAll other liabilitiesTotal equity capital (includes minority interests)Bank equity capitalLoans and leases 30-89 days past dueNoncurrent loans and leasesRestructured loans and leasesMortgage-backed securitiesEarning assetsFHLB AdvancesUnused loan commitmentsTrust assetsAssets securitized and soldNotional amount of derivativesINCOME DATAFirst 7598,917,07719,845,670463,194186,058,286First Half2020Total interest incomeTotal interest expenseNet interest incomeProvision for credit losses***Total noninterest incomeTotal noninterest expenseSecurities gains (losses)Applicable income taxesExtraordinary gains, net****Total net income (includes minority interests)Bank net incomeNet charge-offsCash dividendsRetained earningsNet operating income 3426146,768146,65516,41560,29186,364145,027 5018,925,459460,283191,684,2312nd 78,4938,366,75317,007,732550,281181,707,6602nd .5N/M295.8296.5-45.629.5N/M332.4 70,42270,3767,29536,50633,86969,814 24.6* For institutions that have adopted ASU 2016-13, this item represents the allowance for credit losses on loans and leases held for investment and allocated transfer risk.** For institutions that have adopted ASU 2016-13, securities are reported net of allowances for credit losses.*** For institutions that have adopted ASU 2016-13, this item represents provisions for credit losses on a consolidated basis; for institutions that have not adopted ASU 2016-13,this item represents the provision for loan and lease losses.**** See Notes to Users for explanation. N/M - Not MeaningfulFDIC QUARTERLY 5
2021 Volume 15 Number 3TABLE III-A. Second Quarter 2021, All FDIC-Insured InstitutionsAsset Concentration Groups*SECOND QUARTER(The way it is.)Number of institutions reportingCommercial banksSavings institutionsTotal assets (in billions)Commercial banksSavings institutionsTotal deposits (in billions)Commercial banksSavings institutionsBank net income (in millions)Commercial banksSavings institutionsPerformance Ratios (annualized, %)Yield on earning assetsCost of funding earning assetsNet interest marginNoninterest income to assetsNoninterest expense to assetsCredit loss provision to assets**Net operating income to assetsPretax return on assetsReturn on assetsReturn on equityNet charge-offs to loans and leasesLoan and lease loss provision tonet charge-offsEfficiency ratio% of unprofitable institutions% of institutions with earnings gainsStructural ChangesNew reportersInstitutions absorbed by mergersFailed institutionsAll InsuredInstitutions4,9514,336615 7666,0894,287CreditCardBanks11101 tionalBanks550 iculturalBanks1,1301,11911 ers2,5862,337249 1,444MortgageLenders28077203 rLenders322012 152.7146.06.7130.2124.45.854252518OtherSpecialized 1 Billion31228329 64.559.55.053.750.33.4281102180All Other 1 Billion50941495 119.495.723.8102.783.119.732428737All Other 1 Billion867115 R SECOND QUARTERS(The way it was.)Return on assets (%) 3.752.511.291.140.940.141.451.01Net charge-offs to loans & leases (%) 0.050.270.070.090.160.500.360.40* See Table V-A (page 10) for explanations.** For institutions that have adopted ASU 2016-13, the numerator represents provisions for credit losses on a consolidated basis; for institutions that have not adopted ASU 2016-13, the numeratorrepresents the provision for loan and lease losses.6 FDIC QUARTERLY
QUARTERLY BANKING PROFILETABLE III-A. Second Quarter 2021, All FDIC-Insured InstitutionsAsset Size DistributionSECOND QUARTER(The way it is.)Number of institutions reportingCommercial banksSavings institutionsTotal assets (in billions)Commercial banksSavings institutionsTotal deposits (in billions)Commercial banksSavings institutionsBank net income (in millions)Commercial banksSavings institutionsPerformance Ratios (annualized, %)Yield on earning assetsCost of funding earning assetsNet interest marginNoninterest income to assetsNoninterest expense to assetsCredit loss provision to assets**Net operating income to assetsPretax return on assetsReturn on assetsReturn on equityNet charge-offs to loans and leasesLoan and lease loss provision tonet charge-offsEfficiency ratio% of unprofitable institutions% of institutions with earnings gainsStructural ChangesNew reportersInstitutions absorbed by mergersFailed institutions 100Million to 1 Billion to 1 Billion 10 Billion3,1038172,754678349139 1,117.8 7.7112.0292.73,6567,3073,1466,354509952Geographic Regions*All InsuredInstitutions4,9514,336615 7666,0894,287Less Than 100Million871761110 53.046.76.344.439.64.914313113 10 Billionto 250Billion14713116 2,239GreaterThan 250Billion New York13586123061280 12,723.8 56551451 137Chicago1,059915144 4KansasCity1,2761,23640 Dallas1,0951,02768 1,887.21,310.3576.91,621.61,110.4511.25,501
Despite Lower Trading Revenue Noninterest income increased (up 5 billion, or 7.1 percent) from second quarter 2020 due to improvement in several categories. During the year ending second quarter 2021, "all other noninterest income" rose 7.9 billion (27.5 percent), offsetting both a 5.9 billion