Transcription
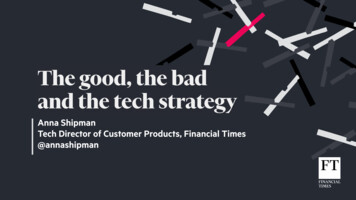
White PaperSuccessful Strategy Execution:What Does It Look Like?Dr. David P. NortonRobert Kaplan and David Norton have written extensively about how organisations canuse the Balanced Scorecard (BSC) as thecentral organising concept for an integratedstrategy management system. In this article,Norton shares his thoughts and observationsabout how the most successful adopters ofthis management tool — members of the Balanced Scorecard Hall of Fame — use thisapproach to achieve improvements in financial performance. Norton explores the roleof execution measures — and achievementmeasures — within each of the four BSC perspectives.Copyright 2015 Palladium
On May 6, 1954, one of the great athletic achievements of alltime took place. Roger Bannister, a British medical student, rana mile in less than four minutes (3:59.4). This event, long considered impossible by informed observers, was the culminationof years of improved performance by athletes around the world.For Bannister, it was a response to a disappointing performanceat the 1952 Olympics. Contemplating whether it was time toretire and pursue his medical studies, Bannister set himself anew goal: to run a mile in less than four minutes. The four-minute target emerged because “it was a nice round number” andthe previous world record had stood for nine years. Bannisterdeveloped an innovative, low-mileage training strategy to pursuethe goal and the rest is history.Leaders of business organisations, attempting to excel andexceed, face similar challenges. Successful strategy executionhas been unachievable for most — nine out of ten organisationsfail to execute their strategies. Like Bannister, a leader needsto create a target that will inspire and stretch the organisation.Although inspiration to achieve a highly ambitious stretch targetis important, targets must also be used for mundane tasks likeallocating investements, setting personal goals and communicating with stakeholders. Thus, the targets should be demanding but achievable. How can I set the expectation that we can be leaders in ourmarkets?How can I convince my organisation that a new way ofmanaging will produce a significant payoff?How much should I be willing to invest in this new approach?How do I set targets for my Balanced Scorecard?Operational management systems like budgets, cost management and quality management have long used benchmarking asa target-setting methodology. We need an analogous frameworkfor the setting of targets in strategy management systems.Limited work has been done on the subject of target setting forstrategies, most of it dealing with development of visions.1 Theleader’s role is to (1) show the need for change, (2) develop avision and strategy and (3) establish a sense of urgency.2Starting in 2011, we embarked on a research project to developa set of such strategic benchmarks. Using our Balanced Scorecard Hall of Fame database,3 we selected a sample of 30 private sector organisations that had been evaluated and selectedfor the Hall of Fame award. Each presented a detailed statisticalprofile of the results that it had achieved. Each used the Balanced Scorecard/Strategy Map measurement framework, whichassured us that a consistent methodology was applied. Ourhope was that by analysing the measures and results achievedby these organisations, we could create a generic profile of whatsuccessful strategy execution would look like, what it would beworth and how it would be managed.1R.S. Kaplan and D.P. Norton, “Develop the Strategy,” chapter 2 in The Execution3The Balanced Scorecard Hall of Fame for Executing Strategy comprises morePremium (HBS Press, 2008).2John Kotter, Leading Change (HBS Press, 1996).2 Successful Strategy Execution: What Does It Look Like?Copyright 2015 PalladiumWithout credible targets, executives cannot deal with questionsthat enable transformational change to take place within theirorganisations:than 200 organisations that have used the Kaplan-Norton BSC approach tosuccessfully execute their strategies, thereby achieving breakthrough results.
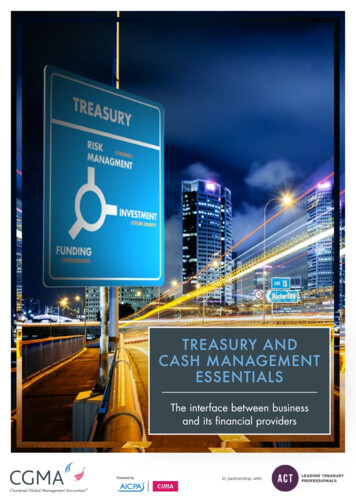
HALL OF FAME STRATEGIC RESULTSA 50% improvement in customer satisfaction frequentlycomplemented by a #1 ranking by an external agency inbrand value and market share. A 50% improvement in key process effectiveness, complemented by external performance awards for quality, safetyor environmental performance. A 20% improvement in employee satisfaction, leading toa 50% reduction in employee turnover, complemented byexternal awards for workplace effectiveness.The results are summarised in Figure 1. Although financialperformance loomed large as an absolute indicator of success and its value, the impact of the performance drivers wascritical. The leverage of 50% improvements in employee retention, key process effectiveness and customer satisfaction into150% improvements in shareholder value provides a guidelineto executives as to where strategic investments should be made(the drivers) and the order of magnitude of the payoff. It alsoprovides a framework to set targets, to manage expectationsand to monitor returns.FINANCIALShareholder Value 180% 120%ProfitsMoody’s/S&PP/E RatioRevenueCUSTOMER A growth in shareholder value of 150%, driven by a 180%growth in profits and a 120% growth in revenue. Financialperformance was frequently complemented with an improvement in the Moody’s or Standard and Poor’s rating. 150%PROCESS LEARNINGThe research showed us that the typical Balanced ScorecardHall of Fame organisation achieved the following results over athree-year period:- ing#1 BESTPROCESS 50%Key ProcessExecutionExternal PerformanceAwards 20%- 50%EmployeeSatisfactionEmployeeTurnoverEXECUTION MEASURES#1 BESTEMPLOYERExternalAwardsACHIEVEMENT MEASURESMeasures that drive performance (drivers) or reflect Long-term external measures that indicate asustainable ability to growperformance within the action cycle (outcomes)Figure 1: Hall of Fame strategic performance composite, includingboth execution measures and achievement measures.Successful Strategy Execution: What Does It Look Like? 3Copyright 2015 Palladium
Strategic Goals and BHAGs (Big,Hairy, Audacious Goals)Setting strategic goals is as much about motivation and inspiration as it is about economics. In their book Built to Last,4 JamesCollins and Jerry Porras describe how “highly visionary companies often use bold missions as a particularly powerful mechanism to stimulate progress.” They introduce the term “BHAG”(Big, Hairy, Audacious Goal) as a mechanism to describe sucha vision. A BHAG is more than a goal. It is a compelling andinspirational description of the desired future state. Examples ofeffective BHAGs are General Electric’s commitment to “be #1 or#2 in every market we serve” or John F. Kennedy’s challenge “toput a man on the moon and return him successfully to earth bythe end of the decade.” Hall of Fame organisation TNT Express(a European package delivery services company) framed itsBHAG as follows:“Grow the profits of the business by 50% in the next threeyears.”Nemours, a US nonprofit healthcare system for children, had amore comprehensive BHAG:“By 2015, Nemours will be a leading health system for children, being in the top 5% of institutions for patient satisfaction as well as in health and quality outcomes.”4James Collins and Jerry Porras, Built to Last: Successful Habits of VisionaryCompanies (Harper, 1994).4 Successful Strategy Execution: What Does It Look Like?Copyright 2015 PalladiumIn each of these cases, a BHAG describes the outcome thatan organisation desires and a date by which to achieve it. Astrategy describes how the organisation will achieve that outcome. Although a BHAG is a useful (and, we believe, essential)part of the goal-setting process, it must be complemented withthe subsidiary goals (the drivers) that will achieve the audaciousobjective.Figure 1 illustrates our structure for setting strategic goals. TheBSC framework, proven in practise for nearly two decades, asserts a cause-effect logic between desired outcomes and performance drivers. Financial performance, the ultimate measureof success (in the private sector), is derived from the creation ofsatisfied customers who are, in turn, satisfied through focusedand excellent processes delivered by exceptional people. OurHall of Fame research shows the kind of value that is created bysuccessful companies in each perspective of the framework.
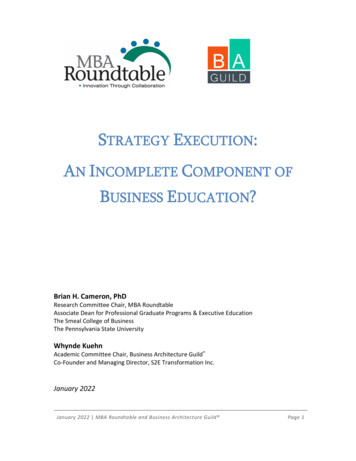
The financial framework, as shown in Figure 1, is dominated byshareholder value. The creation of value for the owners of theorganisation is the ultimate measure of success in the privatesector. There was no single common measure used by theHall of Fame companies. For organisations that were buildinga management system for their entire enterprise, measures like“market value,” “stock price” and “earnings per share” wereused. For organisations building a system for a subset of theenterprise (e.g., a divison or a group), measures like “returnon invested capital” were used. Shareholder value is generallya derivative of two drivers — growth in profits and growth inrevenue. For example, the classical DuPont ROI model dividesperformance into these two components:() PROFITSSALESXThree-YearSales GrowthThree-YearShareholderValue Growth*Profit-to-SalesGrowth RatioLakshmi500%250%375%2.0Mapre 216%232%230%0.93Rainbow Stores170%140%155%1.2Minor Food Group114%150%132% 4.0Grupo 9182%120%150%1.5CompanyStrategic Financial GoalsRETURNONASSETSThree-YearProfit GrowthSALESASSETSReviewing the performance of our Hall of Fame companies, wenoted that Infosys Technologies, the Indian IT services firm (outsourcing, consulting, systems integration, etc.) embarked upona growth strategy intended to make it the top player in its niche.During its four-year performance period, revenue jumped 310%while profits grew by 289%. Earnings per share (the surrogatefor shareholder value) grew by 305%, approximately the averageof the revenue growth and profit growth.Grupo Modelo, the Mexico-based brewer and distributor ofbeer and bottled water, saw sales increase by 46% and profits(EBITDA) grow by 38% over the three-year performance period. The stock price (shareholder value) grew by 50% over theperiod, approximately the average of the sales growth and profitgrowth.AVERAGE*Growth in shareholder value is estimated to be the average of three-year growth in revenues and growth in profits.Figure 2: Profit-to-sales growth ratios, over a three-yearperiod, for eleven Hall of Fame organisations.Figure 2 summarises the financial performance of 11 Hall ofFame organisations.5 There are three takeaways in this data set:1. Level of Improvement. The absolute level of improvement in both sales and profits was impressive. The averagesales growth was 120% (over three years) while the averagegrowth in profits was 180% (four years).2. Balance. The growth rate in profits exceeded the growthrate in sales for two-thirds of the companies. This ratio,shown in the right-hand column of Figure 2, seems to reflectthe nature of the company’s assets and the way they are5Source: 2007-2010 Balanced Scorecard Hall of Fame Reports, published byPalladium Group, Inc. with Harvard Business School PressSuccessful Strategy Execution: What Does It Look Like? 5Copyright 2015 Palladium
competitively deployed. The average company in our Hall ofFame sample showed a profit-to-sales growth (PSG) ratio of1.5.Companies with PSG ratios greater than 1 tend to haveeither excess capacity or intangible assets that can beconverted to profits relatively quickly. Consider Lakshmi(PSG 2.0), an Indian manufacturer of textile machinery.With 3,500 employees, it serves 60% of India’s 35 billion textile market. The primary barrier to success was thecyclicality of the market. Lakshmi developed a strategy tosustain domestic market leadership by providing competitive products with cost-effective solutions. Key to creatingthis “recession-proof” strategy was getting everyone in thecompany’s divisions, businesses and support units to worktoward the same corporate-level objective — a job for theBalanced Scorecard.DataCraft (PSG 4.0) is another example. This Singaporebased provider of IT solutions and services employs 2,500people at 55 locations in 13 Asia-Pacific countries. Itsstrategy was to reposition itself from a product reseller to asolutions provider. Key to the strategy was to standardisethe company’s business model and management metricsacross multiple countries — a job for strategy maps andBalanced Scorecards. These tools and frameworks allowDataCraft to rapidly reposition intangible assets and createimpressive financial results.On the other hand, companies with PSG ratios less than1 tend to have strategies that are capital intensive or thathave significant dependence on channel partners. These,in turn, tend to see slower growth in profits than the aforementioned companies. For example, Grupo Modelo (PSG 0.8) has a strategy that involves the construction of a newbrewery and restructuring a convenience store chain in addition to the comprehensive development of new manage6 Successful Strategy Execution: What Does It Look Like?Copyright 2015 Palladiumment processes. The capital intensity of its breweries andreal estate holdings gave it a competitive advantage but at aslower pace than was observed in Lakshmi and DataCraft.3. Growth in value. The Hall of Fame companies were notrequired to provide balance sheet data relative to shareholder investment. Thus, it was not possible to create anabsolute picture of shareholder value. Instead of the absolute level, we focused on the rate of change in value. Wefurther assumed that the change in value of an organisationis, in part, a function of the change in the level of sales anda change in the level of profits. Our approximation of growthin value is the average of three-year growth in sales and inprofits. Using this convention, Figure 2 shows the averagethree-year growth of shareholder value to be 150%. Asa point of reference, one of the definitive research studies on the value of strategy execution showed that typicalBalanced Scorecard users achieved three-year growth inshareholder value of 43% (compared with shareholder valuegrowth of 15% in non-BSC users).6 The 150% achieved bythe Hall of Fame companies, a subset of the general population of BSC users, is 3.5 times greater.The financial performance of the companies in the Hall of Famesample provides a useful point of reference for organisations toset strategic targets and expectations. We offer the followingguidelines for setting financial targets for BSC-related strategies: Set a financial BHAG that will double or triple shareholder value over a three-year period (Norm: 150%) Develop financial drivers for revenue growth (120%)and profit growth (180%) that support the BHAG6DeBusk and Crabtree, “The Effects of Adopting the Balanced Scorecard onShareholder Returns,” Advances in Accounting, 24 (2008) 8-15.
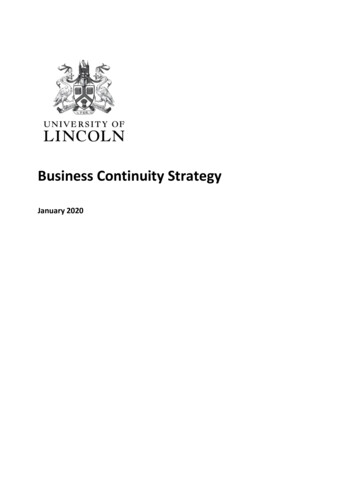
Customer PerformanceThe logic of the Balanced Scorecard approach is that successful financial performance results from the creation of satisfiedcustomers (Figure 1). All of the Hall of Fame organisations inour study had some way of measuring customer satisfaction.For example, AKSA (the Turkish manufacturer of acrylic fibre)measures customer loyalty and market share. Cisco (the US developer of software platforms) measures “products that do notmeet customer expectations.” Culligan (the Argentine retailer ofbottled water) measures the attrition of small and large customers.The measures selected tend to reflect the nature of the industry.For example, consumer retail businesses (like Rainbow Stores ofChina and Minor Food Group of Thailand) find mystery shoppingto be a useful measure for evaluating franchises or stores.Merck, the global pharmaceutical company, measures thenumber and quality of its partnerships that create greater marketaccess.Although significant diversity exists for monitoring the customer,virtually every organisation used some indicator of customersatisfaction. This measure is defined as “the percentage ofcustomers who voice satisfaction with the product and/or theexperience.” This measure is generally developed throughcustomer surveys, administered by external agencies (e.g., J.D.Power, mystery shopping). The ultimate objective for customersatisfaction is 100%, a number that can be approached but isseldom achieved.Figure 3 shows the customer satisfaction scores of nine BSCHall of Fame companies. The post-BSC scores show a high of97% for Minor Food Group and a low of 67% for Dongwha (aSouth Korean manufacturer of particle board). SOHO (Indonesian pharmaceuticals) showed the greatest percentage increaseCUSTOMER SATISFACTIONCUSTOMER DISSATISFACTION*Before After(3 years)%ImprovementBefore After(3 years)%ImprovementSOHO40% 80%100%60% 20%67%Deposit Trust73% 91%25%27% 9%67%Minor Food Group92% 97%5%8% 3%60%Borusan57% 81%42%43% 19%56%DataCraft82% 92%12%18% 8%55%AKSA81% 91%12%19% 9%52%AAFES62% 72%16%38% 28%25%Dongwha58% 67%16%42% 33%21%Rainbow Stores78% 80%3%22% 20%10%CompanyAVERAGE24%44%*Customer Dissatisfaction (CDS): The percentage of customers who do not identify themselves as “satisfied”(CS); (CDS 1-CS)Figure 3: Improvements in customer satisfaction and reductionsin customer dissatisfaction for nine Hall of Fame organisations.(from 40% to 80%), while Rainbow Stores (the Chinese retailer) showed only a 3% improvement (from 78% to 80%). Theaverage rate of improvement for the nine companies was 24%(three-year interval).The ability to interpret these performance data is clearly biasedby the base-level performance. SOHO’s base of 40% will permithigher rates of improvement than Minor Food (a base of 92%).To provide a framework more conducive to performance comparisons and target setting, we shifted the focus of the measurefrom “customer satisfaction” (CS) to its converse, “customerdissatisfaction” (CDS). Customer dissatisfaction is the percentage of customers who do not identify themselves as satisfied:(CDS 1-CS).Successful Strategy Execution: What Does It Look Like? 7Copyright 2015 Palladium
Figure 3 shows the performance numbers in this new framework.Performance-level improvements range from 67% for SOHOand Deposit Trust Clearing (the US-based post-trade clearinghouse) to 10% for Rainbow Stores. The average rate of improvement (a reduction in the level of dissatisfaction) was 46%.Our conclusion, based on analysis of the customer satisfactionmetrics, is that organisations using the BSC to drive financialperformance (increased value of 150%) begin by reducing thelevel of customer dissatisfaction by approximately 50%. Weoffer the following guidelines for setting customer targets forBSC-based strategies: Reduce the percentage of dissatisfied customers by50% every three yearsEnhancing the Performance ofInternal Business ProcessesBusiness processes are the vehicles through which organisations create value. As an example of such value, we showedhow reducing customer dissatisfaction by 50% over three yearscan create as much as a 150% increase in shareholder value.An organisation can achieve such improvements in customersatisfaction by enhancing performance in internal processes thatgreatly affect its strategy. For instance, KeyCorp, a regional USbank, focused on reducing nonperforming loans as a foundation for its customer-intimacy strategy. Infosys achieved 44% ofits revenue (up from 30% three years earlier) from new products— the key measure of the company’s ability to innovate. ThaiCarbon Black achieved an overall plant effectiveness of nearly99% as the cornerstone of its lowest total cost strategy. Ineach case, executives and managers identified, managed andimproved processes that exerted the greatest impact on theirorganisation’s strategy.Figure 4 depicts the processes and results achieved by a sampleof 20 Hall of Fame organisations. The key processes, objectives and measures these companies used fell into the followingcategories: Timeliness: reduction in the time required to perform a keyprocess Quality: reduction in errors and defects associated with akey process Relationships: improvement in the teamwork between thecompany and key partners Innovation: improvement in the effectiveness of processesthat create new products or services Financial process: improvement in the effectiveness offinancial management Other operations: improvement in operations not coveredabove8 Successful Strategy Execution: What Does It Look Like?Copyright 2015 Palladium
QUALITY38%Immediate returns70%Post-three-month repairs40%Cost of quality35%Imperfect orders28%Machine 65%Key product production lead time92%Supply time reduction92%Reduction in late projects80%Supply chain delivery57%Product launch delays62%Time to answer complaints50%On-time delivery43%Sale to delivery time38%Average (3-year)Strategic ProcessImprovement50%FINANCIAL PROCESS39%Productivity per employee100%Days of inventory33%Selling volume30%OTHER OPERATIONS18%No. of collection days21%Level of dangerous waste23%13%Level of energy consumption19%Daily customer impressions12%Loss ratioRELATIONSHIPS41%Franchisee dissatisfaction70%Partner plan execution50%Supplier dissatisfaction28%Size of retail network17%INNOVATION41%Revenues from new products48%Usability of Internet bank34%Figure 4: On average, Hall of Fame companies achieved process improvements of 50% over three years.A typical Hall of Fame company uses between two and threeprocess measures to manage strategic performance. To illustrate, Millipore (a bioscience research and manufacturing firmcompeting through a product leadership strategy) measured“average product launch delays” (timeliness), “R&D projects ontime” (timeliness) and “cost of quality” (quality).Within the six categories identified In Figure 4, the processes theHall of Fame companies selected are identified, along with thepercentage improvement in performance over a three-year interval. Processes associated with timeliness are the most susceptible to improvement, showing a 65% gain over three years. TheIndonesian pharmaceutical firm SOHO, for instance, competingSuccessful Strategy Execution: What Does It Look Like? 9Copyright 2015 Palladium
with a product leadership strategy, achieved a 92% reductionin its measure “key product production lead time.” Meanwhile,Hindustan Petroleum (which has a customer intimacy strategy)reduced “supply time” by 92%. TNT (competing with a lowesttotal cost strategy) improved “on-time delivery” by 43%. Notethat practitioners of each generic strategy type cited above(product leadership, customer intimacy and lowest total cost) allused the timeliness dimension of key processes to improve theirperformance.We can make the same generalisation about quality-related processes. The overall quality category shown in Figure 4 depicts a38% improvement in key process performance over three years.Cisco (with a customer intimacy strategy) showed a 70% reduction in “immediate returns.” Volkswagen of Brazil (having defineda lowest total cost strategy) showed a 40% reduction in “postthree-month repairs.” And Millipore (using a product leadershipstrategy) showed a 35% reduction in “cost of quality.”Relationship-based processes showed an average improvementof 41%, approximately the same level as quality-based processes (38%). Consider Thailand-based Minor Food Group (witha customer-intimacy strategy), which achieved a 70% reduction in “franchisee dissatisfaction.” For its part, Chinese retailerRainbow Stores (competing through a lowest total cost strategy)brought “supplier dissatisfaction” down by 28%.Innovation-based processes achieved an average 41% improvement in performance. Infosys, for instance (with its productleadership strategy), saw a 48% increase in “revenues from newproducts.” And New Zealand’s KiwiBank (having defined a product leadership strategy) showed a 34% increase in “usability ofour Internet bank.”10 Successful Strategy Execution: What Does It Look Like?Copyright 2015 PalladiumFinally, several Hall of Fame companies identified financial management processes as most influential to their success. Theseorganisations were competing primarily on lowest total coststrategy. Rainbow Stores, for example, achieved a 33% reduction in “inventory levels”; Borusan (the Turkish logistics firm), a21% decrease in “collection days.” Financial services companyMapfre of Brazil (competing on a customer intimacy strategy)enjoyed a 100% increase in “employee productivity” and a 13%reduction in “loss ratio,” the measure of underwriting effectiveness.In summary, to successfully execute its strategy, an organisation must identify the key processes that will most affect itscustomer value proposition. Enterprises in this sample of Hall ofFame inductees typically selected three such processes and associated measures. Over a three-year period, the organisationsachieved performance improvements of approximately 50%.Timeliness-based process improvements saw rates of improvement considerably higher (65% over three years) than processesrelated to quality, relationships, innovation and financial management (40%), even though each company selected processesfrom each of these categories to execute its strategy. We offerthe following guidelines for setting internal process targets forBSC-based strategies: Select two or three key processes that have a dominant impact on the strategySet targets that strive for 50% improvement in theseprocesses over a three-year period
Establishing a Strong Learningand Growth FoundationHuman Capital Development ApproachCompanyEmployee EngagementEmployee roving critical business processes to create value for customers and shareholders hinges on a workforce’s competencies. Simply put, new processes require new skills. And newstrategies call for new cultural characteristics, values and attitudes. The learning and growth perspective in an organisation’sstrategy map and scorecard serves as the foundation for all ofthis. Figure 5 summarises the human capital practices deployedby 11 Hall of Fame companies we examined. Specifically, welooked at the following:Deposit TrustMission understood59% 70%not reportedKiwiBankEmployees engaged (%)not reported26% 14%66% 74%30% 17% AKSA Human capital development approach: The approachused to develop the human capital required by the organisation’s strategy. An emphasis on human capital development is a driver of human capital performance.Employee satisfaction: Emphasis on human capitaldevelopment and the strategy creates an improvement inemployee satisfaction (an outcome).Employee turnover: Improvement in employee satisfactioncreates a corresponding reduction in employee turnover (anoutcome).We observed two general approaches to driving human capitaldevelopment in these BSC Hall of Fame organisations:1. Engage employees with the strategy. The philosophyhere is an extension of our principle to “make strategyeveryone’s job.” Figure 5 shows that six of the 11 Hall ofFame companies we examined used statistical surveys toidentify the percentage of the workforce that understood thestrategy.DataCraftNo. of days trainingVolkswagen of BrazilEmployees engagedIdeas per employeenot reported2.8% 2.5%Hindustan PetroleumStrategic readiness (%)not reported11% 6%No. of days training76% 81%13% 6.5%No. of Black BeltsNo. of change agentsnot reported6.8% 2.7%not reported25% 8%MerckCustomer-focused culture (%)TNTEmployees engaged (%)BorusanNo. of hours training55% 89%14% 10%Minor Food GroupSuccession plan(no. of leaders per position)85% 90%26% 5%Rainbow StoresNo. of Six Sigma trainees55% 61%not reportedIncrease inSatisfactionDecrease inTurnover 20%-50%Figure 5: A strong emphasis on learning and growth objectives provides a solidfoundation for strategic success. Human capital — the talent and teamwork withinthe organisation — is an essential ingredient to achieve breakthrough performance.Successful Strategy Execution: What Does It Look Like? 11Copyright 2015 Palladium
2. Train employees in the new requirements. Three of thecompanies in Figure 5 (DataCraft, AKSA and Borusan) usedlevel of training (measured by number of days or hours) astheir surrogate for strategic readiness. Two of the organisations (Merck and Rainbow Stores) introduced Six Sigmaprograms as part of their process strategy. They monitoredthe number of Black Belts as well as other levels of certification. Merck specifically addressed the development of“change agents” to facilitate strategy execution. Minor Foodfocused on developing its next generation of leaders.Although no standard approach is apparent in these humancapital development practises, each company emphasiseseither employee engagement by creating awareness of andparticipation in the strategy or employee development throughtraining and education. Only Merck, an organisation known forits visionary human capital practises, emphasises both.The nine companies that measured employee turnover showeda 50% average reduction, led by TNT (25% to 8% turnover),Minor Food (26% to 5%), DataCraft (30% to 17%) and KiwiBank(26% to 14%). Four companies measured both satisfactionand turnover. Building on its leadership development program,Minor Food saw a 6% improvement in satisfaction (85% to 90%)complemented by an 81% reduction in staff turnover (26% to5%). Building on its staff training program, DataCraft achieveda 12% improvement in satisfaction (66% to 74%) and a 43%drop in turnover (30% to 17%). And thanks to its staff trainingprogram, AKSA Acrylic Chemical created a 6% improvement insatisfaction (76% to 81%) along with a 5
successful strategy execution would look like, what it would be worth and how it would be managed. 1R.S. Kaplan and D.P. Norton, "Develop the Strategy," chapter 2 in The Execution Premium (HBS Press, 2008). 2John Kotter, Leading Change (HBS Press, 1996). 3The Balanced Scorecard Hall of Fame for Executing Strategy comprises more