Transcription
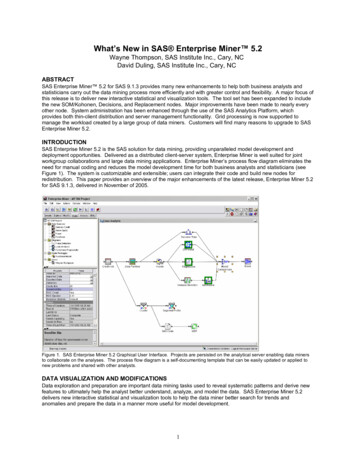
What’s New in SAS Enterprise Miner 5.2Wayne Thompson, SAS Institute Inc., Cary, NCDavid Duling, SAS Institute Inc., Cary, NCABSTRACTSAS Enterprise Miner 5.2 for SAS 9.1.3 provides many new enhancements to help both business analysts andstatisticians carry out the data mining process more efficiently and with greater control and flexibility. A major focus ofthis release is to deliver new interactive statistical and visualization tools. The tool set has been expanded to includethe new SOM/Kohonen, Decisions, and Replacement nodes. Major improvements have been made to nearly everyother node. System administration has been enhanced through the use of the SAS Analytics Platform, whichprovides both thin-client distribution and server management functionality. Grid processing is now supported tomanage the workload created by a large group of data miners. Customers will find many reasons to upgrade to SASEnterprise Miner 5.2.INTRODUCTIONSAS Enterprise Miner 5.2 is the SAS solution for data mining, providing unparalleled model development anddeployment opportunities. Delivered as a distributed client-server system, Enterprise Miner is well suited for jointworkgroup collaborations and large data mining applications. Enterprise Miner’s process flow diagram eliminates theneed for manual coding and reduces the model development time for both business analysts and statisticians (seeFigure 1). The system is customizable and extensible; users can integrate their code and build new nodes forredistribution. This paper provides an overview of the major enhancements of the latest release, Enterprise Miner 5.2for SAS 9.1.3, delivered in November of 2005.Figure 1. SAS Enterprise Miner 5.2 Graphical User Interface. Projects are persisted on the analytical server enabling data minersto collaborate on the analyses. The process flow diagram is a self-documenting template that can be easily updated or applied tonew problems and shared with other analysts.DATA VISUALIZATION AND MODIFICATIONSData exploration and preparation are important data mining tasks used to reveal systematic patterns and derive newfeatures to ultimately help the analyst better understand, analyze, and model the data. SAS Enterprise Miner 5.2delivers new interactive statistical and visualization tools to help the data miner better search for trends andanomalies and prepare the data in a manner more useful for model development.1
EXPLORATORY GRAPHSThe graphics libraries in the SAS Enterprise Miner 5.2 client have been significantly enhanced with improvedperformance and many new plot types, including two-dimensional and three-dimensional graphics. Tables andgraphs can be independently arranged. Interactive graphs are dynamically linked so that selecting data points in oneplot updates the displays of corresponding plots and tables.Figure 2. Explore your data interactively with parallel axis, density, 3-D rotating scatter, and other plots.NEW NODES IN SAS ENTERPRISE MINER 5.2Data preparation is known to be an important task for improving both the fit and reliability of a mining model. Variabletransformations can be used to stabilize variances, remove nonlinearity, improve additivity, and correct non-normalityin variables. Filtering extreme values from the training data can stabilize model parameter estimates. Replacingmiscoded values and imputing missing values are other common data preparation acitvities.Data preparation is also known to be one of the most time-consuming tasks, often cited as taking 50 to 75% of thetotal project effort. SAS Enterprise Miner 5.2 delivers several new interactive data preparation capabilities to help thedata miner create and modify variables with more control and flexibility.The Tranform Variables node now includes a formula expression builder to create customized variables from theinput variables (Figure 3). The expression builder provides a host of operands and functions for defining thetransformation, or you can type the SAS code. Distribution plots of the orignal variable and the new transformationcan be viewed. Formulas are tested by executing against a sample and testing for errors. The user can easily modifythe variable transformation definition at any time. The transformation logic is included the Enterprise Miner scorecode.2
Figure 3. Develop customized transformations using the interactive Transform Variables node Expression Builder.The Replacement node is a new tool for manipulating class variable values and includes both automated andmanual replacement options. You can use the node to interactively specify replacement values for class variablelevels, for instance to correct data miscoding, to combine levels or reduce dimensionality, or to regroup valuescreated by binning. The training data is scanned on the SAS server to generate a summary table containing all classinput and target levels. The summary table is displayed in the client where the user enters replacement values.In Figure 4, known and unknown values of input variables have been mapped to new values for the JOB andREASON variables. The node also has options for automatically replacing unknown values in the scoring code.Figure 4. Map new values manually in the Replacement node.3
The Filter node has been enhanced to support interactive user selection of filter values from both categorical andinterval inputs (Figure 5). A new algorithm has been implemented to identify regions of outliers in the data set.Rather than creating a naïve histogram style distribution, the new code recursively builds and merges percentiles tocreate a more valid representation of the data. The user can then manually enter filter ranges or select them using aslider bar for interval variables or selecting discrete to exclude for categorical variables. Optionally, the score codewill create a new variable that identifies observations selected for removal but not apply the where clause; thus, thenode can be used to identify outliers and selected regions for subsequent processing.Figure 5. Filter extreme values interactively with the Filter node. The shaded region defines the variable range to keep.The SOM node provides both data visualization and clustering capabilities. Self-organizing maps (SOMs) are a datavisualization technique used to reduce the dimensions of data through the use of self-organizing neural networks.This process of reducing the dimensionality of vectors is essentially a data compression technique known as vectorquantization. In addition, the Kohonen technique creates a network that stores information in such a way that anytopological relationships within the training set are maintained. Figure 6 shows the distribution of the variableDONOR AGE across the grid of SOM dimensions. The user can select any variable for display, even variables notused in building the SOM model.4
Figure 6. Cluster or reduce the dimensionality of the data using the SOM/Kohonen node.The Decision Node can make a new decision for each case in training and scoring data sets based on numericalconsequences specified via a decision matrix and cost variables or cost constants (Figure 7). This is useful forselecting models that maximize profit or minimize loss rather than relying on traditional statistical measures, such asmisclassification rates or Bayesian Information Criterion. Users can define a decision matrix specifying profit, loss, orrevenue, and define prior probabilities, which are often necessary when the sample proportions of the target classesin the historical training set differ considerably from the proportions in the operational data to be scored either throughdeliberate sampling bias or inherent variation. The decision function will multiply the decision values by the eventprobabilities to both select the optimal decision and also to estimate the profit or loss of the consequence. Thisfacilitates what-if analysis where a user can change the profit or loss and cost parameters to estimate their effect ondecision distributions. The node can also be used to apply the decision function to models created outside ofEnterprise Miner and to create comparable fit statistics, lift charts, and distribution charts.Figure 7. Configure decision processing using the Decision mode.5
CHANGES TO EXISTING NODESThe Decision Tree node provides a tree growth iteration plot that displays the value of a model assessment measureon the vertical axis for different subtrees on the horizontal axis (Figure 8). A reference line is superimposed on theplot indicating the subtree selected as the final model. The iteration plot is very helpful in understanding how large atree is needed for sufficient fit and whether large trees overfit the training data.Figure 8. Evaluate different-sized decision trees using the Decision Tree Iteration Plot.The Enterprise Miner Tree Desktop Application is used for interactive training or viewing decision trees created bythe Decision Tree node (Figure 9). Recent enhancements include the ability to export all graphics to a JPG file, theability to collapse and expand nodes in a tree display, and the choice of displaying variables labels or names. Usersalso gain greater flexibility in selecting splitting candidates when manually building the tree.Figure 9. Build decision trees interactively with the Tree Desktop Application.6
The Regression node now includes an iteration plot with a reference line for the selected step in the stepwiseregression along with a combo box for choosing the display statistic. The new Estimate Selection Plot displaysparameter estimates across the model selection steps (Figure 10). You can use the plot to characterize the size andstability of each parameter across iterations of the stepwise regression.Figure 10. Characterize the overall size and consistency of the parameter estimates in a stepwise regression with the EstimateSelection Plot.All modeling nodes benefit from improved assessment lift charts, classification charts, and distribution charts thathave been updated with new controls for easily changing the assessment statistic displayed. You can more quicklyswitch from captured response to cumulative captured response, for instance, without finding the correspondingvariable in the output table.Changes have been made to the statistics and plots displayed in the Model Comparison node and also to thepredictive modeling nodes to improve the consistency between reports. The Score Rankings and Score DistributionPlots now provide a selection control for conveniently changing the displayed statistics (Figure 11). The ModelComparison node now includes the Kolmogrov-Smirnov statistic in the results table. A baseline has been added tothe Receiver Operating Characteristic (ROC) chart that is produced for binary targets.Figure 11. Evaluate multiple models together in one easy-to-interpret framework using the Model Comparison node.7
The Principal Components node, used for both data exploration and dimension reduction, now provides a matrixplot that is useful in looking for patterns separated by the dimensions. The plots are color coded by the target event,if present (Figure 12). You select the the number of subplots that appear. The node now includes an interactiveprincipal components selector to choose how many components should be exported for subsequent analysis.Figure 12. Visualize the output of principal components.The Path node is used to search transactional data such as Web logs for frequent sequential patterns. Newgraphical enhancements have been added to help better explore the navigation habits of visitors. Plots include afunnel count plot depicting the drop-off in the number of visitors along a particular path of interest and a sequencerules matrix view.Figure 13. Use the funnel count plot to show the decay in Web session lengths.The program editor of the SAS Code node has Macro Variables and Macros tabs that contain lists of macro variablesand macros that are used in SAS training code. You can use your mouse to drag items from the Macro Variables andMacros lists and drop them in the SAS Code editor to enhance and simplify SAS code creation.8
You now have better control of the sample makeup when using the Sample node. The Level Based value has beenadded as an option to the Criterion property in the stratified sample properties. If Level Based is selected, then thesample is based on the proportion captured and sample proportion of a specific level.ADMINISTRATION AND CONFIGURATIONThe following changes and enhancements improve the administration and configuration of SAS Enterprise Miner.SAS ANALYTICS PLATFORMThe SAS Analytics Platform provides a common client/server architecture and implementation for a family of productsthat includes SAS Enterprise Miner, SAS Forecast Studio, and SAS Inventory Policy Studio. One instance of theAnalytics Platform middle-tier server can serve all three applications. It is easier for SAS administrators to install andconfigure multiple SAS analytical applications.In three-tier environments, administrators can monitor the status of the Analytics Platform server through both Webbased and client-based tools. Users can download and install the Enterprise Miner client directly from the AnalyticsPlatform server. Administrators who configure multi-user environments must manually configure and start theAnalytics Platform middle-tier services.The SAS Analytics Platform cannot be licensed separately. The Analytics Platform installation is triggered by theinstallation of any of the existing SAS Analytics Platform products.SAS MANAGEMENT CONSOLE PLUG-IN FOR ENTERPRISE MINER ADMINISTRATIONSome of the functionality that was in the configuration wizard in SAS Enterprise Miner 5.1 has been moved to a SASManagement Console plug-in. The SAS Management Console plug-in gives administrators better control overEnterprise Miner configurations. The following information is now stored in the SAS Management Console plug-in: server start-up code default project path and security maximum concurrent nodes per process execution model group definitions WebDAV location is now stored in the SAS Metadata Repository and configured by SAS ManagementConsole. As a result, users never need to know about the WebDAV location that is used by the ModelManager functions. WebDAV is Enterprise Miner's Web-based Distributed Authoring and Versioning. It is aset of extensions to the HTTP protocol that enable you to collaboratively edit and manage files on remoteWeb servers.GRID PROCESSINGGrid processing is available for enterprises that need to perform computing over multiple logical or physical systems.The execution of the process flow diagram in SAS Enterprise Miner is sent to a load balancing manager thatdistributes the jobs to a grid of systems. This is expected to benefit users who run multiple, large-process flowdiagrams, or users who manage a large multi-user environment.CONCLUSIONSAS is proud to present Enterprise Miner 5.2 to users at this year’s SUGI conference. A significant amount of workhas been devoted to meeting and exceeding users’ demands. Progress has been made in data exploration,selection, and transformation; in new and enhanced reports for predictive models; in ease of use; and in systemadministration and multi-server grid processing. All these issues are expected to significantly enhance the userexperience and lead to better predictive models for data mining.REFERENCESAdministrator Guide for SAS Analytics Platform doc/apcore/index.htmlWhat’s New in SAS Enterprise Miner 5.2 (2005). w900.htmACKNOWLEDGMENTSAppreciation is extended to the entire SAS Enterprise Miner family (development, testing, technical support,education, publications, marketing, and field strategy/support) for helping bring this product to market. We are alsovery grateful to our customer base for all of the great feedback and support of our product. Thank you.9
CONTACT INFORMATIONYour comments and questions are valued and encouraged. Contact the authors at:David DulingDevelopment DirectorSAS Institute Inc.SAS Campus Dr., S6102Cary, NC 27513Work Phone: (919) 531-5267Email: david.duling@sas.comWayne ThompsonProduct ManagerSAS Institute Inc.SAS Campus Dr., S6100Cary. NC 27513Work Phone: (919) 531-6485Email: wayne.thompson@sas.comSAS and all other SAS Institute Inc. product or service names are registered trademarks or trademarks of SASInstitute Inc. in the USA and other countries. indicates USA registration.Other brand and product names are trademarks of their respective companies.10
SAS Enterprise Miner 5.2 is the SAS solution for data mining, providing unparalleled model development and deployment opportunities. Delivered as a distributed client-server system, Enterprise Miner is well suited for joint workgroup collaborations and large data mining applications. Enterprise Miner's process flow diagram eliminates the
