Transcription
International Journal Of Multidisciplinary Research In Science,Engineering And Technology (IJMRSET)Volume 1, Issue 4, July 2020Solar Powered Water Quality MonitoringUsing Wireless Sensor NetworkK.S.Margaret, Kavima. KDepartment of Electrical and Electronics Engineering, S.A. Engineering College (Anna University) Thiruverkadu,Chennai, IndiaABSTRACT: Nowadays, the water pollution is a serious world issue. Observing the quality of water in recent days ismore essential as a result of environmental factors which causes pollution and health problem in human life likedysentery, cholera, diarrhoea, etc and also a great concern to the aquatic organisms. Testing the water in chemicallaboratory manually is very tedious and consumes more time. In order to reduce the time consumption and remotemonitoring the Arduino based water quality monitoring system that monitors the water quality in real time. This paperpresented a vision of low cost wireless water quality monitoring and collection of data from the water body. Waterquality parameters like temperature, turbidity and PH values are monitored and data are collected from the differentwater bodies. The acquired data have been shown on the graphical display.KEYWORDS: Water quality monitoring, Data collection and monitoring, Arduino cI. INTRODUCTIONWater pollution is a booming problem in India. A result obtained from a recent survey conducted over 180 countriesacross the world have placed India 145th position in concern with water quality and sanitation. According to CentralPollution And Control Board almost half of India’s interstate rivers are polluted day by day.The study found thatalmost one-fourth of the river locations had BOD values exceeding the normal limit.Water quality monitoring plays an important role in environmental monitoring, and its protection and maintenance ofwater environmental health. In order to overcome the above water quality issues, we described a solar based waterquality monitoring system using WSN technique. The present monitoring method is a regular manual analysis processto gather the data. The proposed system is used to monitor the data autonomously at regular intervals using Arduino. Itis programmed with C and C language.On the other hand, power supply to the system could be replaced with solar energy when the main energy sources areunavailable. Solar energy is a renewable energy source, thus it compliments the aim of the proposed model.This paper will mainly cover large water body monitoring, concentrating on pH, temperature and turbidity as waterquality factors using WSN technique. The information on quality of different water bodies are collected as data andsent to the graphical display for the purpose of analysis. This data can be regularly monitored from a remote locationand decreases the need for manpower. This monitoring system can be monitored throughout the day and improve theefficiency of the water quality monitoring.IJMRSET 2020www.ijmrset.com229
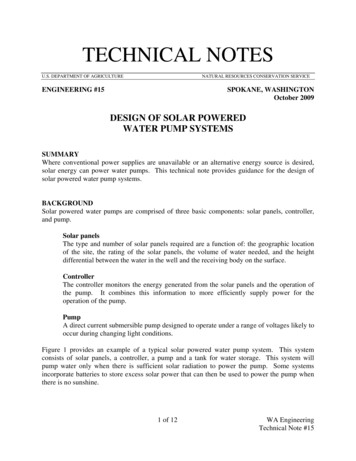
International Journal Of Multidisciplinary Research In Science,Engineering And Technology (IJMRSET)Volume 1, Issue 4, July 2020II. DESIGN OF SYSTEMThe system consists of three unit systems: control unit, sensor unit and display unit.The basic block diagram of thissystem is shown in Figure 1.Figure. 1 Basic block diagram of water quality monitoring system.Choice of platformBy relating the performance of several versions of Arduino IDE software and comparing the precision ratio, this systemplans to use Arduino 1.8.11 as a application platform. The Arduino software (IDE) is a open source which makessimpler to code and upload it to the board with the aid of third party cores. The software has built in functions and thedata obtained from the system can be displayed graphically.It enables the user to store the code in the cloud and can be backed up from any device. The data collected from waterbodies is stored and sent through the arduino to the excel. This data can be expressed in graphical form.Energy Systemi)Battery:The important problem in the consideration of energy source for water quality monitoring system is the location of thesensor system in the water body. The optimal performance of the system can be ensured with the implementation ofbattery source to power up the system. This battery has better long-term performance and self-discharge rates. Duringinterruption or in the event of battery dry-out condition solar power can be used as the backup energy system.ii) Solar powered system:For a successful working of a water quality monitoring system additional source for power supply is provided as solarpower. This solar panel can be connected in series or parallel based on the system requirements. The charge controllerare used to control the power fed to the battery to provide supply to the sensor block and the microcontroller unit.C. Materials Usedi) pH sensorA pH sensor is an instrument that measures the acidity and alkalinity or base level of the given solution. It is usuallyexpressed with a numeric scale which ranges from 0-14. The value 7 implies neutrality. If the value of pH increasesthen the given solution implies alkalinity. If the value of pH decreases then the given solution implies acidity. The pHvalue is also equal to the negative logarithm of the hydrogen ion concentration.Basically, there are three types of pH sensor. They are combinational, differential and laboratory. In this system,combinational pH sensor is used. Combination pH sensor is a electrochemical sensor that has a measuring electrodeand reference electrode. The measuring electrode identify changes in the value of pH while reference electrode gives astable signal.IJMRSET 2020www.ijmrset.com230
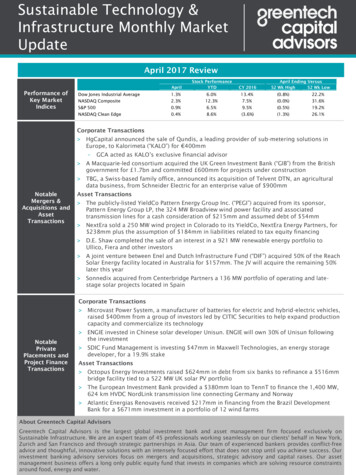
International Journal Of Multidisciplinary Research In Science,Engineering And Technology (IJMRSET)Volume 1, Issue 4, July 2020The pH values for some solutions are listed below:Name of the solutionpH valueBatteryStomach acidCoca colaLemonCoffeePure WaterHousehold Bleach0.522.532.935712.7Table1. pH values for different solutionsii) Temperature sensor:The temperature sensor is a thermocouple device that gives temperature measurement through an electrical signal.Temperature sensor mesasures the amount of heat energy or coldness generated by a system in the water according tothe atmospheric conditions. There are different types of temperature sensor and all have various characteristicsdepending upon their application. The sensor used in this system is thermistor which is the combination of thermal andresistor.The temperature sensor LM35 is a linearly proportional to the centigrade temperature. It does not require any externalcalibration or trimmer to provide exact accuracy.iii) Turbidity sensorTurbidity sensor measures the quantity of scattered particles that is suspended through the light. It checks the purity ofwater against microparticles. It is also used to analyze the formation of precipitation or algae and yeast formation.Turbidity is measured in NTU: Nephelometric turbidity unit. The instrument used for measuring is callednephelometric or turbidimetric.iv) Ultrasonic sensorThe ultrasonic ranging module HC-SR04 is used in this monitoring system. This module includes an ultrasonictransmitter and receiver and also a separate unit for control circuit. The module transmits eight separate wave of 40khzand detects whether the signal is received back. If the returning time of the signal is long then the distance isproportionally longer. It’s measuring range is from a minimum value of 2cm to the maximum value of 4m. This rangeis calculated through the time interval between the trigger signal and the received echo signal.D. Sensor nodeFigure2. Sensor nodeThis sensor node consists of seven blocks. For the water quality monitoring system prototype the sink node isconstructing the main building block by using sensor node by collecting and pre-processing data from electrodes andIJMRSET 2020www.ijmrset.com231
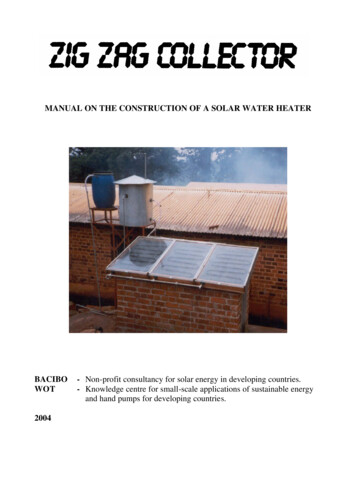
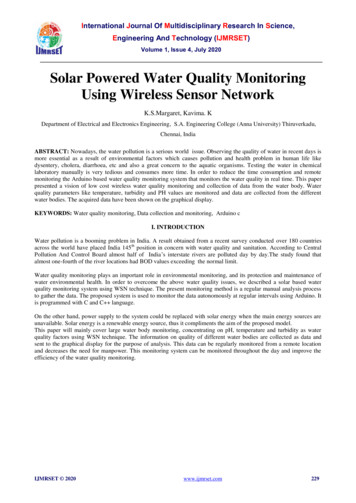
International Journal Of Multidisciplinary Research In Science,Engineering And Technology (IJMRSET)Volume 1, Issue 4, July 2020transferring it to the sink node. This prototype includes four sensors for measuring the turbidity level, temperature,ultrasonic (which detects the level of water) and ph. A excel sheet is used as a backup storage for all gathered data. Forpower supply it uses battery for powering sensors. During interruption or in the event of battery dry-out condition solarpower can be used as the backup energy system.Sink node is generally a sensor node with the ability to send data within the portable distance using wi-fi module asshown in Figure3.The availability, affordability and compatibility with Arduino- based architecture was the main reason for the selectionof water quality monitoring system using wireless sensor network.D. Wireless CommunicationThe sensed data from the nodes of the sensors are received directly from the water body or the test sample whosephysical parameters to be monitored. The data are collected through the electrodes submerged into the sample body bythe help of Arduino uno board. The sensors are calibrated primarily to acknowledge accurate operation resulting incorrect water quality parameter data using standard calibration methods.Figure3. Wireless communicationE. Analysis Of Arduino OutputFigure4. Arduino outputThe value of pH ranges 0 to 14. At room temperature, if the value is approximately 7 then the quality of water isneither acidic nor basic. The analysis conducted on highly acidicwater is shown in figure4. This test sample consistsof less amount of light scattered particles, thus showing the turbidity value of approximately 6NTU. This valueindicates that the turbidity level of the test sample is clean.The efficiency of the sensors such as ph, temperatare andturbidity are evaluated by comparing the observed data values, with the standard value.The monitoring of pH values and temperature of the water sample at different intervals is shown in Figure5.Identify applicable funding agency here. If none, delete this text box.IJMRSET 2020www.ijmrset.com232
International Journal Of Multidisciplinary Research In Science,Engineering And Technology (IJMRSET)Volume 1, Issue 4, July 2020Figure5.1. pH versus time intervalFigure5.2F. Function Of The Data AnalysisAccording to the results of the analysis of user demand, the system has realized the following information testingmethods: quality check, field check, bidirectional check between Graph and status check.1) The quality check appears through the dialog box. Users can input the value condition that needs to be queried, andthe system will provide a data records that corresponds to status of the water quality as a table.2) Field check runs on information check according to some field values determined by the system. Related Informationcan be obtained after the user has selected the target needs to interrogate the field that sets the system.3)Two methods of investigation can be realized for Bidirectional check between graph and status check. The first checkfeature is graph information and related information. As long as the status information is displayed in the form of a list,the user selects any layer object. Another is inquiring status information, and spatial object by relating the spatial objectis displayed until the user is exposed. Information required to query for input information.IJMRSET 2020www.ijmrset.com233
International Journal Of Multidisciplinary Research In Science,Engineering And Technology (IJMRSET)Volume 1, Issue 4, July 2020Figure6. Analysis of data in excelF. Data storage and visualizationThe system was designed to store and fetch data in two possible ways: a) in a system PC which can be used fortemporary storage; b) in a excel spreadsheet which can be used for long time storage and can be analysed with differentdata. In case of failure or interruption in a transmission of data through excel, data can be retrieved from the onboardmicrocontroller (Arduino). Date and time are added to the values of the water quality parameters like pH, temperature,and turbidity for simple analysis and display in the web.G. Challenges and RecommendationsSome developed countries are using real-time water quality monitoring systems to monitor their water resources such asthe United States Geological Survey and the European Innovation Partnership on Water. For developing countries likeIndia, this real-time monitoring is only in the experimental phase. Some of the following challenges are on therecommendation for real implementation and potential future studies of real-time water quality monitoring systems:reliability and stability of the sensor and its ability to support the entire system, power system and for the long term. Forimplementation, cost and affordability.Constant changes in weather conditions like temperature and water intrusion can affect some the functions of theelectronic component, thus, it is very important to consider this in the design phase of entire system. A well-designedsystem that houses all Electronics component may be considered as one solution.Also, the use of antenna-less transceivers may also be a factor to consider to avoid the risk of intrusion of water andstrong wind loading. Energy source issues can be addressed through design of energy management and high efficiencyutilization battery. Lithium-ion battery capacity can increase four times the capacity of Lead acid battery. Solar energyharvesting system has been proved to be an effective energy harvesting system and its fast charging capability would bea good fit. Lithium ion battery which has durable characteristics and capacity for high charging rate.Cost and affordability are one of the main problems for this comprehensive implementation of automated water qualitymonitoring system in developing countries. The cost of such unfamiliar technology is confusing, especially in placeswhere water quality monitoring is rarely conducted or not at all necessary. Perception has to be changed and correctionmust be done through the Government institutions, related private institutions and research community monitoring thatwater quality should be done regularly and efficiently. Standard sampling frequency / interval and water qualitymonitoring methods will reveal the high cost of manual monitoring (cost of laboratory equipment, wages of highlyskilled personnel, and transportation costs) against much less expensive automation and could change the perceptionabout costs and benefits of working on automatic monitoring. In addition, the following could further reduce the cost ofautomated water quality monitoring system: usage of local materials (material for floating system), tapping localresearchers to collect their own automated water quality monitoring system and using the latest technology such aslithium-ion batteries and more efficient types of solar panels.IJMRSET 2020www.ijmrset.com234
International Journal Of Multidisciplinary Research In Science,Engineering And Technology (IJMRSET)Volume 1, Issue 4, July 2020III. CONCLUSIONIn the water quality monitoring and analysis system we preliminarily accomplish the match between the standard waterquality and the different water sample bodies. For large area coverage, a low cost water quality monitoring system hasbeen proposed in this study. It attributes to long duration operation, flexibility, sensitivity, stability and reliability.Arduino based embedded platform is designed for data acquisition and data transfer.The water quality parameters are acquired through the Arduino board and sent over the wireless network to the servernode. Arduino is adopted for water quality objective management as well as dynamic display and simulation forpollution data. Practice shows that it is an inevitable trend to apply Arduino wi-fi in water quality management.REFERENCESLorna Fewtrel, Jamie Bartram, “ Water Quality: Guidelines, Standards and Health” . Published by IWAPublishing, London, UK, 2001.[2] B. Tangena, P. Janssen, G. Tiesjema, E. van den Brandhof, M. Klein Koerkamp, J. Verhoef, A. Filippi, and W.Vandelft, “A novel approach for early warning of drinking water contamination events” . Water ContaminationEmergencies: Monitoring, Understanding and Acting, pages 13. The Royal Society of Chemistry, 2011.[3] Soundarya Pappu, Prathyusha Vudatha, Niharika. A.V, Karthick. T and Suresh Sankaranarayanan, “Intelligent IOTBased Water Quality Monitoring System”. International Journal of Applied Engineering Research ISSN 0973-4562Volume 12, number 16 (2017) pp.5447-5454.[4] EGRI, Angela; SIRB, Vali Chivuta; Patrascoiu, Nicolae, Tomus, Adrian, “Intelligent Control And Monitoyring OfDrinking Water Distribution System”. Annals of DAAM for 2011 and Proceedings of the 22 nd international DAAM[5] Soundarya Pappu, Prathyusha Vudatha, Niharika. A.V, Karthick. T and Suresh Sankaranarayanan, “Intelligent IOTBased Water Quality Monitoring System”. International Journal of Applied Engineering Research ISSN 0973-4562Volume 12, number 16 (2017) pp.5447-5454.[6] EGRI, Angela; SIRB, Vali Chivuta; Patrascoiu, Nicolae, Tomus, Adrian, “Intelligent Control And Monitoyring OfDrinking Water Distribution System”. Annals of DAAM for 2011 and Proceedings of the 22 nd international DAAMthe 22nd international DAAM Symposium, Volume 22, No. 1, ISSN1726-9679 ISBN 978-3-901509-83-4, EditorB. Katalinic, Published by DAAM International, Vienna, Austria, EU, 2011.[5] Francis Campan, Blaise Kevin Guepie, Zineb Noumir, Paul Honeine, Igor Nikiforov, Cedric Richard, HichemSnoussi, Pierre-Antoine Jaarrige, “System The Surveillance Of Water Quality Disribution AndDetection “Troyes,2012.[6] Sean A. McKenna, David B. Hart, Katherine Kilse, Mark Koch, Eric D.Vugrin, Shawn Martin, Mark Wilson,Victoria Cruz, Laura Cutler, “Water Quality Event Detection Systems For Drinking Water Contamination WarningSystems”. EPA/600/R-10/036 May 2010 .[7] Sutharsan Rajasegarar, Christopher Leckie, Marimuthu Palaniswami, ET James C. Bezdek, “Distributed AnomalyDetection In Wireless Sensor Networks”. 2006[1]IJMRSET 2020www.ijmrset.com235
KEYWORDS: Water quality monitoring, Data collection and monitoring, Arduino c I. INTRODUCTION Water pollution is a booming problem in India. A result obtained from a recent survey conducted over 180 countries across the world have placed India 145 th position in concern with water quality and sanitation. According to Cen tral Pollution And Control Board almost half of India ¶s interstate .