Transcription
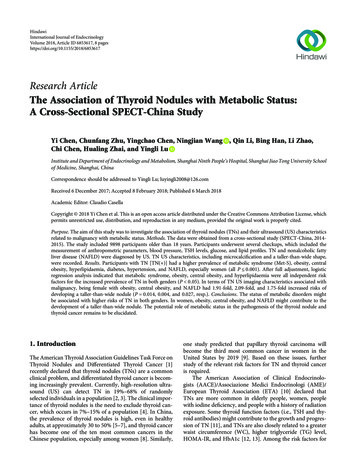
HindawiInternational Journal of EndocrinologyVolume 2018, Article ID 6853617, 8 pageshttps://doi.org/10.1155/2018/6853617Research ArticleThe Association of Thyroid Nodules with Metabolic Status:A Cross-Sectional SPECT-China StudyYi Chen, Chunfang Zhu, Yingchao Chen, Ningjian Wang , Qin Li, Bing Han, Li Zhao,Chi Chen, Hualing Zhai, and Yingli LuInstitute and Department of Endocrinology and Metabolism, Shanghai Ninth People’s Hospital, Shanghai Jiao Tong University Schoolof Medicine, Shanghai, ChinaCorrespondence should be addressed to Yingli Lu; luyingli2008@126.comReceived 6 December 2017; Accepted 8 February 2018; Published 6 March 2018Academic Editor: Claudio CasellaCopyright 2018 Yi Chen et al. This is an open access article distributed under the Creative Commons Attribution License, whichpermits unrestricted use, distribution, and reproduction in any medium, provided the original work is properly cited.Purpose. The aim of this study was to investigate the association of thyroid nodules (TNs) and their ultrasound (US) characteristicsrelated to malignancy with metabolic status. Methods. The data were obtained from a cross-sectional study (SPECT-China, 20142015). The study included 9898 participants older than 18 years. Participants underwent several checkups, which included themeasurement of anthropometric parameters, blood pressure, TSH levels, glucose, and lipid profiles. TN and nonalcoholic fattyliver disease (NAFLD) were diagnosed by US. TN US characteristics, including microcalcification and a taller-than-wide shape,were recorded. Results. Participants with TN [TN( )] had a higher prevalence of metabolic syndrome (Met-S), obesity, centralobesity, hyperlipidaemia, diabetes, hypertension, and NAFLD, especially women (all P 0 001). After full adjustment, logisticregression analysis indicated that metabolic syndrome, obesity, central obesity, and hyperlipidaemia were all independent riskfactors for the increased prevalence of TN in both genders (P 0 05). In terms of TN US imaging characteristics associated withmalignancy, being female with obesity, central obesity, and NAFLD had 1.91-fold, 2.09-fold, and 1.75-fold increased risks ofdeveloping a taller-than-wide nodule (P 0 014, 0.004, and 0.027, resp.). Conclusions. The status of metabolic disorders mightbe associated with higher risks of TN in both genders. In women, obesity, central obesity, and NAFLD might contribute to thedevelopment of a taller-than-wide nodule. The potential role of metabolic status in the pathogenesis of the thyroid nodule andthyroid cancer remains to be elucidated.1. IntroductionThe American Thyroid Association Guidelines Task Force onThyroid Nodules and Differentiated Thyroid Cancer [1]recently declared that thyroid nodules (TNs) are a commonclinical problem, and differentiated thyroid cancer is becoming increasingly prevalent. Currently, high-resolution ultrasound (US) can detect TN in 19%–68% of randomlyselected individuals in a population [2, 3]. The clinical importance of thyroid nodules is the need to exclude thyroid cancer, which occurs in 7%–15% of a population [4]. In China,the prevalence of thyroid nodules is high, even in healthyadults, at approximately 30 to 50% [5–7], and thyroid cancerhas become one of the ten most common cancers in theChinese population, especially among women [8]. Similarly,one study predicted that papillary thyroid carcinoma willbecome the third most common cancer in women in theUnited States by 2019 [9]. Based on these issues, furtherstudy of the relevant risk factors for TN and thyroid canceris required.The American Association of Clinical Endocrinologists (AACE)/Associazione Medici Endocrinologi (AME)/European Thyroid Association (ETA) [10] declared thatTNs are more common in elderly people, women, peoplewith iodine deficiency, and people with a history of radiationexposure. Some thyroid function factors (i.e., TSH and thyroid antibodies) might contribute to the growth and progression of TN [11], and TNs are also closely related to a greaterwaist circumference (WC), higher triglyceride (TG) level,HOMA-IR, and HbA1c [12, 13]. Among the risk factors for
2thyroid cancer, in addition to age, sex, radiation exposurehistory, and family history, other factors [4, 14, 15] includingobesity and central obesity may contribute to its aetiology.Currently, the association of metabolic status with TNand thyroid cancer has not been fully investigated. The metabolic mechanisms facilitating the development of TN andthyroid cancer are complex and have not been confirmed.The data used in this study were from a large investigation,the Survey on Prevalence in East China for MetabolicDiseases and Risk Factors (SPECT-China), which was performed in 2014-2015. The objective of the present studywas to investigate whether different metabolic risk factorsand metabolic diseases, including obesity, central obesity,hyperlipidaemia, hypertension, diabetes, metabolic syndrome(Met-S), and nonalcoholic fatty liver disease (NAFLD), wereassociated with TN and their US imaging characteristicsrelated to malignancy.International Journal of EndocrinologyTotal participant(n 10798)Exclusion:Complete missing lab data (n 191)Missing questionnaire data (n 159)Younger than 18 years old ( n 7)Subjects in SPECT-China study (2014-205)(n 10441)Exclusion:Missing thyroid US information(n 330)History of thyroid surgery or thyroiddiseases (n 330)Glucocorticoid treatment(n 32)Amoidarone treatment (n 32)Hormone replacement therapy ( n 6)2. Materials and Methods2.1. Study Participants. SPECT-China [16, 17] is apopulation-based survey that assessed the prevalence of metabolic diseases and risk factors in East China. A stratified andcluster sampling method was used. From February 2014 toDecember 2015, this study was performed in Shanghai,Zhejiang, Jiangxi, Jiangsu, and Anhui and in 22 sites in EastChina. Adults aged 18 years or older who were Chinese citizens and had lived in their current residence for more than 6months were invited to participate in our study. Those withsevere communication problems, with acute illness, or whowere unwilling to participate were excluded. All participantsprovided written informed consent before data collection.The study protocol was approved by the ethics committeeof the Shanghai Ninth People’s Hospital, Shanghai Jiao TongUniversity School of Medicine. All procedures used were inaccordance with the ethical standards of the responsiblecommittee on human experimentation (institutional andnational) and with the Helsinki Declaration of 1975, asrevised in 2008 [18, 19].Our study initially enrolled 10,441 participants olderthan 18 years [17–19]. Participants missing thyroid ultrasound (US) information (n 330) and those with a historythat included thyroid surgery, thyroid diseases (includinghyperthyroidism, hypothyroidism, subacute thyroiditis, andradioactive iodine treatment history) (n 174), glucocorticoid treatment (n 32), amiodarone treatment (n 1), orhormone replacement therapy including androgen and oestrogen (n 6) were excluded. Finally, 9898 subjects wereincluded in the final analysis. Figure 1 shows the inclusionand exclusion of participants in this analysis.When we analysed the association between TN andNAFLD, participants missing liver ultrasonographic results(n 213) and those with a history of excessive consumptionof alcohol (male 20 g/d, female 10 g/d) [17] (n 598),schistosomal hepatic disease (n 5), or self-reported viralhepatitis (including hepatitis B and hepatitis C viruses)(n 110) were excluded; finally, 8977 subjects were includedin this analysis.Subjects enrolled in this study(n 9898)Figure 1: Flowchart of participants’ inclusion and exclusion.2.2. Data Collection. All data collection in this study was performed by the same staff from the Department of Endocrinology and Metabolism at the Shanghai Ninth People’sHospital, Shanghai Jiao Tong University School of Medicine.All staffs successfully completed a standard training programme that familiarized them with the specific tools andmethods used. A standard questionnaire was administeredby trained staff to obtain information on demographic characteristics, personal and family medical history, and risk factors in their daily lives. Weight, height, and waist and hipcircumferences were measured according to a standard protocol. Blood pressure (BP) was measured on the nondominant arm 3 times consecutively with a 1-minute intervalbetween the measurements while the participant was in aseated position after 5 minutes of rest [20]. All anthropometric measurements were conducted at the same time as theserum sample collection.2.3. Laboratorial Assays. Serum samples for laboratorialassays were obtained by venipuncture after an 8-hour fastfrom 0700 to 1000 h in the morning. Blood samples werestored at 20 C when collected and shipped by air in dryice to one central laboratory, which was certified by theCollege of American Pathologists (CAP), within 2–4 hoursof collection.Fasting plasma glucose (FPG), low-density lipoprotein(LDL), high-density lipoprotein (HDL), triglycerides (TG),and total cholesterol (TC) were measured by BeckmanCoulter AU 680 (Brea, USA). Insulin was detected bychemiluminescence method (Abbott i2000 SR, Chicago,USA). Glycated hemoglobin (HbA1c) was assessed byhigh-performance liquid chromatography (MQ-2000PT,Medconn, Shanghai, China). Thyroid peroxidase antibody
International Journal of Endocrinology(TPOAb), thyroglobulin antibody (TgAb), thyroid stimulating hormone (TSH), triiodothyronine (T3), and thyroxine(T4) were measured by the chemiluminescence immunoassay (Siemens, immulite 2000, Erlangen, Germany).2.4. Thyroid and Liver Ultrasonography. Thyroid and liverUS examinations were performed by the same registeredphysicians who were unaware of the biochemical and histological data of the participants and had professional certificates for ultrasonography awarded by the Ministry ofHealth of China for the use of B-mode US imaging (M7,Mindray ShenZhen, P.R. China). The characteristics ofthe thyroid parenchyma were described according to theechogenicity and homogeneity. Nodule characteristics,including microcalcification and taller-than-wide shape,were recorded. Hepatic steatosis was defined as a diffuseincrease of the fine echoes in the liver parenchyma compared to that in the kidney or spleen parenchyma basedon standard criteria [21].2.5. Definition of Variables. Thyroid nodule: 2 mm indiameter. Microcalcification: calcification 2 mm.Obesity was defined based upon BMI measures 28 kg/m2. Central obesity was defined as a waist circumference 80 cm in women and 90 cm in men [20]. Based on theAmerican Diabetes Association 2014 criteria, diabetes wasdefined as a previous diagnosis by healthcare professionals,fasting plasma glucose 7.0 mmol/L, or HbA1c 6.5%.Hyperlipidaemia was defined as total cholesterol 6.22 mmol/L, triglycerides 2.26 mmol/L, LDL-C 4.14 mmol/L,HDL-C 1.04 mmol/L, or a self-reported previous diagnosisof hyperlipidaemia by physicians. Hypertension was definedas a systolic blood pressure of 140 mm Hg or higher, a diastolic blood pressure of 90 mm Hg or higher, or current useof antihypertensive treatment. Metabolic syndrome (Met-S)was defined based on the International Diabetes FederationCriteria (2005). A person with MS must have abdominalobesity (waist circumference: male 90 cm, female 80 cm,or BMI 30 kg/m2) and any two of the following fourparameters: (1) elevated TG 1.7 mmol/L or treatment fordyslipidaemia; (2) reduced HDL 1.03 mmol/L in men or 1.29 mmol/L in women or treatment for dyslipidaemia;(3) elevated blood pressure (systolic blood pressure 130 ordiastolic blood pressure 85 mmHg) or treatment of hypertension; and (4) elevated fasting plasma glucose 5.6 mmol/L or a history of type 2 diabetes [22].2.6. Statistical Analysis. We performed analyses of the surveyusing IBM SPSS Statistics, Version 22 (IBM Corporation,Armonk, NY, USA). All analyses were two-sided. AP value 0.05 indicated significance. Continuous variablesare presented as the mean ( standard deviation) values,and categorical variables are presented as percentages. Theprevalence of TN was calculated among all participants.The prevalence of nodule characteristics, including microcalcification and a taller-than-wide shape, was calculated amongthe participants with thyroid nodules. Continuous variableswere compared using Student’s t-test. The Mann–WhitneyU test was used for nonnormally distributed continuous3variables, and Pearson’s χ2 test was used for dichotomousvariables. The associations of thyroid nodules and their USimaging characteristics with metabolic diseases (categoricalvariables) were assessed by logistic regression. The regression models were adjusted for age, smoking history (including current and past), TSH, and waist-to-hip ratio (but notincluding obesity, central obesity, and metabolic syndrome.). The results are expressed as odds ratios (95% confidence interval).Body mass index (BMI) was calculated as weight inkilograms divided by height in metre squared. Insulinresistance was estimated by the homeostatic model assessment (HOMA-IR) index: f asting insulin mIU/L FPGmmol/L /22 5.3. Results3.1. Clinical Characteristics of Participants with and withoutTN. A total of 9898 subjects (4117 men; 5781 women) wereenrolled in this study. The mean age was 53.34 13.07 years,and the mean BMI was 24.52 3.52 kg/m2. The prevalenceof TN was 50.2% (41.3% in men and 56.5% in women).Compared to those without thyroid nodules [TN( )], menwith thyroid nodule(s) [TN( )] were significantly older;had a significantly greater BMI, waist circumference,waist-to-hip ratio, and systolic pressure; had higher levelsof FPG, HOMA-IR, HbA1c, LDL, TG, T4, TPOAb, andTgAb; and had lower levels of HDL (P 0 05). For women,significantly higher levels of TC and diastolic pressure werefound as well. Furthermore, participants with TN, for bothgenders, had a higher prevalence of metabolic syndrome,obesity, central obesity, hyperlipidaemia, diabetes, hypertension, and NAFLD (all P 0 001). The characteristics of thestudy subjects with and without TN are summarized inTable 1.3.2. Prevalence of TN according to the Presence of MetabolicDiseases. The participants were classified into different subgroups according to whether they presented with metabolicdiseases (Table 2). The prevalence of TN was significantlyincreased in subjects with metabolic syndrome, obesity, central obesity, hyperlipidaemia, diabetes, hypertension, andNAFLD for both genders (all P 0 001).3.3. The Relationship between TN and Metabolic Diseases.Then, the adjusted odds ratios (ORs) for TN in both genderswere calculated. After adjusting for age, smoking history(including current and past), TSH, and waist-to-hip ratio(but not including obesity, central obesity, and metabolicsyndrome), the logistic regression analysis indicated thatmetabolic syndrome (men: OR 1.31, 95% CI 1.12, 1.54,P 0 001; women: OR 1.24, 95% CI 1.09, 1.43, P 0 002),obesity (men: OR 1.43, 95% CI 1.20, 1.70, P 0 001;women: OR 1.24, 95% CI 1.05, 146, P 0 013), central obesity (men: OR 1.29, 95% CI 1.12, 1.49, P 0 001; women:OR 1.22, 95% CI 1.08, 1.38, P 0 001), and hyperlipidaemia (men: OR 1.27, 95% CI 1.11, 1.46, P 0 001; women:OR 1.14, 95% CI 1.00, 1.30, P 0 045) were associated withTN, whereas diabetes and NAFLD were only associated with
4International Journal of EndocrinologyTable 1: General characteristics of all subjects with and without thyroid nodules.TN( )N (%)Age (year)Smokers (%)Metabolic factorsBMI (kg/m2)WC (cm)WHRFPG (mmol/L)HOMA-IRHbA1c (%)LDL (mmol/L)HDL (mmol/L)TG (mmol/L)TC (mmol/L)SBP (mmHg)DBP (mmHg)Metabolic diseasesMet-S (%)Obesity (%)Central obesity (%)Diabetes (%)Hyperlipidaemia (%)Hypertension (%)NAFLD (%)Thyroid hormonesTSH (mIU/L)T3 (nmol/L)T4 (nmol/L)TPOAb (U/ml)TgAb (U/ml)MenTN( )PTN( )WomenTN( )P2417 (58.7)51.86 13.2653.31700 (41.3)57.25 12.3655.6— 0.0010.1542516 (43.5)48.41 12.362.63265 (56.5)56.19 12.392.9— 0.0010.53724.64 3.3983.43 9.530.89 0.075.62 1.381.46 2.945.55 0.943.05 0.761.37 0.321.88 2.015.14 1.12133.40 20.6982.02 12.9925.19 3.2385.65 9.590.90 0.085.82 1.681.54 2.575.73 1.113.12 0.751.33 0.321.89 1.685.17 1.11136.22 20.8982.44 13.04 0.001 0.001 0.0010.0010.011 0.0010.001 0.0010.0230.331 0.0010.31023.74 3.6575.80 9.650.82 0.075.43 1.151.45 1.825.33 0.832.99 0.791.49 0.301.40 0.965.04 1.01126.28 21.6676.41 12.7324.70 3.5679.45 9.950.85 0.115.68 1.481.65 1.995.57 0.953.15 0.811.46 0.321.59 1.365.25 1.21134.02 22.3578.45 12.99 0.001 0.001 0.001 0.001 0.001 0.001 0.0010.007 0.001 0.001 0.001 7.257.635.7 0.0010.001 0.001 0.001 0.001 0.001 .549.125.8 0.001 0.001 0.001 0.001 0.001 0.001 0.0012.44 2.681.80 0.56112.80 22.4266.26 198.5126.68 56.332.47 3.761.79 0.50115.19 23.8176.14 217.0330.77 71.780.5860.5810.001 0.0010.0013.12 4.771.72 0.39113.63 20.59139.92 339.8254.41 111.913.01 2.801.76 0.41116.33 20.55139.42 333.4654.55 130.440.748 0.001 0.0010.1770.488BMI: body mass index; WC: waist circumference; WHR: waist to hip ratio; FPG: fasting blood glucose; HOMA-IR: homeostasis model assessment of insulinresistance; HbA1c: glycated hemoglobin; LDL: low-density lipoprotein; HDL: high-density lipoprotein; TG: triglycerides; TC: total cholesterol; SBP: systolicblood pressure; DBP: diastolic blood pressure; Met-S: metabolic syndrome; NAFLD: nonalcoholic fatty liver disease; TSH: thyroid stimulating hormone;T3: triiodothyronine; T4: thyroxine; TPOAb: thyroid peroxidase antibody; TgAb: thyroglobulin antibody.TN in men (OR 1.27, 95% CI 1.06, 1.52, P 0 010 andOR 1.43, 95% CI 1.22, 1.67, P 0 001, resp.). Hypertensionwas not an independent significant risk factor for theincreased prevalence of TN in both genders (P 0 05)(Figure 2).3.4. The Association of the US Imaging Characteristics of TNand Metabolic Diseases. Among the participants with TN (n 4965), the prevalence of TN with microcalcification was1.1% (1.3% in men and 1.0% in women), and the prevalenceof taller-than-wide-shaped TN was 2.3% (2.0% in men and2.5% in women).We evaluated the relationship between the above UScharacteristics associated with malignancy (microcalcification and a taller-than-wide shape) with metabolic diseases(including metabolic syndrome, obesity, central obesity,hyperlipidaemia, diabetes, hypertension, and NAFLD).Among women with TN, the prevalence of taller-thanwide TN was significantly increased in participants withobesity, central obesity, and NAFLD (all P 0 01). Nosignificant difference was found among men with TN(Table 2).Then, we calculated the adjusted ORs for these US characteristics associated with malignancy and found that womenwith obesity, central obesity, and hypertension had 1.91-fold(95% CI 1.14, 3.21, P 0 014), 2.09-fold (95% CI 1.27, 3.46,P 0 004), and 1.75-fold (95% CI 1.07, 2.87, P 0 027)increased risks of developing a taller-than-wide nodule. Formen, metabolic syndrome had a marginal correlation withhigher risks of a nodule with microcalcification (OR 2.67,95% CI 1.01, 7.04, P 0 048). No other significant association was detected.
International Journal of Endocrinology5Table 2: Prevalence of TN and US characteristics (%) according to the status of metabolic diseases.TNMet-SWithout Met-SP valueObesityWithout obesityP valueCentral obesityWithout central obesityP valueDiabetesWithout diabetesP valueHyperlipidaemiaWithout hyperlipidaemiaP valueHypertensionWithout hypertensionP valueNAFLDWithout NAFLDP valueMenMicrocalcification Taller-than-wide shape48.239.6 0.00146.940.20.00147.139.0 0.00150.339.7 0.00145.338.3 0.00145.836.3 0.00144.838.3 02.30.699TNWomenMicrocalcification Taller-than-wide shape67.652.3 0.00166.055.0 0.00165.050.2 0.00169.554.7 0.00164.752.5 0.00166.149.6 0.00163.554.0 82.00.008Met-S: metabolic syndrome; NAFLD: nonalcoholic fatty liver disease.MenWomenMet-SObesityCentral -SObesityCentral 1.01.21.41.61.8OR (95%CI)0.00.51.01.52.0OR (95%CI)Figure 2: Associations of TN with metabolic diseases. The associations were analysed using logistic regression analysis. The regressionmodels were adjusted for age, smoking history (including current and past), TSH, and waist-to-hip ratio (but not including obesity,central obesity, and metabolic syndrome).4. DiscussionThyroid US is strongly recommended as the first-line screening diagnostic test to detect thyroid lesions [23] due to itssafety, noninvasive nature, and high sensitivity, and it hasalso been widely used to stratify the risk of malignancy inthyroid nodules and aid decision-making about whether fineneedle aspiration is indicated. Researchers have consistentlyreported that several US grey-scale features in multivariateanalyses were found to be highly likely to be malignant,including the presence of nodules with microcalcificationand a taller-than-wide shape measured on a transverse view[1, 10]. In this study, the association of TN and their US characteristics with different metabolic diseases including obesity,central obesity, hyperlipidaemia, hypertension, diabetes,Met-S, and NAFLD was explored.A previous study [24–27] reported that TNs are closelyrelated to several components of Met-S. In this study, regardless of age, participants with TN had a significantly greaterBMI, waist circumference, waist-to-hip ratio, and bloodpressure as well as worse glucose and lipid profiles for bothgenders. Furthermore, a higher prevalence of metabolic syndrome, obesity, central obesity, hyperlipidaemia, diabetes,and hypertension was seen in the TN( ) group as well. Given
6the findings that the subjects in the TN( ) group had worsemetabolic parameters with a higher prevalence of metabolicdiseases, we evaluated the adjusted ORs for TN. After fulladjustment, participants of both genders with metabolic syndrome, obesity, central obesity, and hyperlipidaemia had significantly greater risks of TN, while diabetes was associatedwith TN in only men. To our knowledge, the literature aboutthe relationship between NAFLD and TN remains scarce.Most recently, one published study [26] reported that theprevalence of TN in NAFLD was significantly increased inwomen; however, after logistic regression analyses, therewas no significant difference observed. In this study, after fulladjustment, the risk of TN increased by 43% in men withNAFLD. Although higher blood pressure was found in subjects with TN and the prevalence of TN was also significantlyhigher in participants with hypertension, there was no association between TN and hypertension after full adjustment.In terms of thyroid cancer, currently, most studies concerning thyroid cancer and metabolic factors have focusedon obesity. Several researchers have indicated that overweight and obesity are related to a modestly increased thyroid cancer risk for both genders [28–30], while similarresults were found in only women in other studies [31–33].Consistent with a previous study, in this study, the prevalence of taller-than-wide TN was significantly increased inparticipants with obesity and central obesity in only women.According to the logistic regression analysis, the adjustedORs of taller-than-wide nodules were 1.91 and 2.09 inwomen with obesity and central obesity, respectively. Yeoet al. found that compared with nondiabetic subjects, womenwith preexisting DM have an increased risk of thyroid cancer[34]. Similarly, another study that focused on diabetes andthyroid cancer risk also indicated that diabetes increases therisk of differentiated thyroid cancer [35]. However, anotherstudy found the opposite result, showing that there was aninverse association between glucose and thyroid cancer riskin women [31]. In this present study, among women withTN, the prevalence of nodules with microcalcifications or ataller-than-wide shape had no significant association withdiabetes. Balkan et al. [36] reported that Met-S was not a significant risk factor of thyroid cancer following logistic regression analysis. A similar result was found in which there wasno association between some metabolic factors (blood pressure, cholesterol, triglycerides, and a combined Met-S score)and thyroid cancer [31]. This study showed a 2.67-foldincrease in the risk for TN with microcalcifications amongmen with Met-S after full adjustment. Furthermore, womenwith NAFLD had a 1.75-fold increased risk of developingtaller-than-wide nodules. Thus, data from this study suggested a potential role of metabolic factors besides obesityon the pathogenesis of thyroid cancer, which expanded ourcurrent understanding of the relationship between metabolism status and thyroid cancer.Our study has several important strengths. First, we evaluated a relatively large sample of participants to examine theassociation of TN and their US findings related to malignancywith almost all common metabolic diseases. To our knowledge, this is the most comprehensive report to date addressing this issue. Second, all anthropometric measurementsInternational Journal of Endocrinologyand questionnaires were completed by the same trainedresearch group using strong quality controls. Third, weavoided a clinic-based population, and instead, communitydwelling participants living in multiple sites in China wererecruited so that their results may be more representative.However, our study also has several limitations. First,owing to the cross-sectional study nature, no causal inferencecan be drawn, and the reverse effect of TN and thyroid cancercausing metabolic status changes still needs to be excluded.Second, the gold standard for diagnosing a thyroid nodule,especially for thyroid cancer and NAFLD, is biopsy, and theuse of ultrasonography has limitations. However, thyroidand liver biopsies may not be feasible in such a large sample.In our study, all liver and thyroid ultrasounds were performed by the same ultrasound physicians, minimizing theinterobserver variability. Third, additional nodule characteristics associated with malignancy, such as hypoechoic nodules, nodules with irregular and indefinite borders, were notrecorded, which needs to be further explored. Finally, selfreporting of viral hepatitis may have introduced recall bias.5. ConclusionThe status of metabolic disorders might be associated withhigher risks of TN in both genders. In women, obesity, central obesity, and NAFLD might contribute to the development of a taller-than-wide nodule. The potential role ofmetabolic status in the pathogenesis of thyroid nodules andthyroid cancer remains to be elucidated.Conflicts of InterestThe authors declare that they have no competing interests.Authors’ ContributionsYingli Lu designed the study. Yi Chen, Chunfang Zhu,Yingchao Chen, Ningjian Wang, Qin Li, Bing Han, Li Zhao,Chi Chen, and Hualing Zhai participated in the acquisition ofdata. Yingli Lu evaluated the literature. Yi Chen, ChunfangZhu, and Yingchao Chen contributed equally to this work.Yi Chen undertook the statistical analysis and wrote the firstdraft of the manuscript. Chunfang Zhu and Yingchao Chencontributed to the discussion. Yingli Lu edited and revisedthe manuscript. All authors read and approved the finalmanuscript for publication. Yi Chen, Chunfang Zhu, andYingchao Chen contributed equally to this work.AcknowledgmentsThis study was supported by the National Natural ScienceFoundation of China (81570726); Shanghai Jiao Tong University School of Medicine (2014); Science and TechnologyCommission of Shanghai Municipality (16411971200);Commission of Health and Family Planning of Pudong District (PW2015D-5); the Fourth Round of Three-Year PublicHealth Action Plan of Shanghai by the Shanghai MunicipalCommission of Health and Family Planning (15GWZK0202);Clinical Research Plan of SHDC (16CR3076B).
International Journal of EndocrinologyReferences[1] B. R. Haugen, E. K. Alexander, K. C. Bible et al., “2015American Thyroid Association Management Guidelines foradult patients with thyroid nodules and differentiated thyroid cancer: the American Thyroid Association guidelinestask force on thyroid nodules and differentiated thyroidcancer,” Thyroid, vol. 26, no. 1, pp. 1–133, 2016.[2] M. J. Yeung and J. W. Serpell, “Management of the solitarythyroid nodule,” The Oncologist, vol. 13, no. 2, pp. 105–112,2008.[3] S. Guth, U. Theune, J. Aberle, A. Galach, and C. M. Bamberger,“Very high prevalence of thyroid nodules detected by high frequency (13 MHz) ultrasound examination,” European Journalof Clinical Investigation, vol. 39, no. 8, pp. 699–706, 2009.[4] L. Hegedus, “Clinical practice. The thyroid nodule,” The NewEngland Journal of Medicine, vol. 351, no. 17, pp. 1764–1771,2004.[5] W. Xu, Z. Chen, N. Li et al., “Relationship of anthropometricmeasurements to thyroid nodules in a Chinese population,”BMJ Open, vol. 5, no. 12, article e008452, 2015.[6] H. Jiang, Y. Tian, W. Yan et al., “The prevalence of thyroidnodules and an analysis of related lifestyle factors in Beijingcommunities,” International Journal of EnvironmentalResearch and Public Health, vol. 13, no. 12, p. 442, 2016.[7] Z. Chen, W. Xu, Y. Huang et al., “Associations of noniodizedsalt and thyroid nodule among the Chinese population: a largecross-sectional study,” The American Journal of Clinical Nutrition, vol. 98, no. 3, pp. 684–692, 2013.[8] W. Chen, R. Zheng, P. D. Baade et al., “Cancer statistics inChina, 2015,” CA: A Cancer Journa
The data used in this study were from a large investigation, the Survey on Prevalence in East China for Metabolic Diseases and Risk Factors (SPECT-China), which was per-formed in 2014-2015. The objective of the present study was to investigate whether different metabolic risk factors and metabolic diseases, including obesity, central obesity,