Transcription
The Johns Hopkins Hospital&Johns Hopkins Bayview Medical CenterCommunity Health Needs Assessment&Implementation StrategyJune 20161 Page
2 Page
Table of ContentsIntroduction . 4Community Benefits Service Area (CBSA) . 7Key Community Health Needs . 13Improving Socioeconomic Factors . 15Education . 16Employment . 18Access to Livable Environments . 20Housing . 21Food Environment . 23Crime and Safety . 27Access to Behavioral Health Services. 30Mental Health . 30Substance Abuse . 33Access to Health Services. 35Dental Care . 36Uninsured . 40Chronic Diseases. 44Conclusions and Recommendations . 50Implementation Strategy . 52Appendix A: Primary Data . 61Appendix B: Truven Health Analytics . 70Appendix C: Secondary Data Profile . 72Appendix D: General Description of the Johns Hopkins Institutions . 79Appendix E: Communities Served by JHH and JHBMC. 80Appendix F: JHH and JHBMC CBSA Demographic Snapshot . 83Appendix G: Community Stakeholder Interviewees . 87Appendix H: Community Organizations and Partners . 89Appendix I: Reference List . 92Appendix J: Executive Planning Committee Members & Task Force/Working Group Members . 95Appendix K: Hand Survey (English and Spanish Version). 97Appendix L: Tripp Umbach . 1033 Page
IntroductionWith the enactment of the Patient Protection and Affordable Care Act (PPACA) on March 23, 2010,tax-exempt hospitals require community health needs assessments (CHNA) and implementationstrategies, which are approaches and plans to actively improve the health of communities served byhealth systems. These strategies provide hospitals and health systems with the information they needto deliver community benefits that can be targeted to address the specific needs of theircommunities. Coordination and management strategies based upon the outcomes of a CHNA, andimplementing strategies, can improve the impact of hospital community benefits.To adhere to the requirements imposed by the IRS, tax-exempt hospitals and health systems must: Conduct a CHNA every three years. Adopt an implementation strategy to meet the community health needs identified throughthe assessment. Report how they are addressing the needs identified in the CHNA and a description ofneeds that are not being addressed, with the reasons why.The Department of the Treasury and the IRS require a CHNA to include:1. A description of the community served by the hospital facility and how the description wasdetermined.2. A description of the process and methods used to conduct the assessment. A description of the sources and dates of the data and other information used in theassessment and the analytical methods applied to identify community health needs. A description of information gaps that impact the hospital organization’s ability toassess the health needs of the community served by the hospital facility. Identification of organizations that collaborated with the hospital/health system and anexplanation of their qualifications.3. A description of how the hospital organizations took into account input from persons whorepresent the broad interests of the community served by the hospital. In addition, the reportmust identify any individual providing input that has special knowledge of or expertise in publichealth. The report must also identify any individual providing input who is a “leader” or“representative” of populations.4. A prioritized description of all of the community health needs identified through the CHNA, aswell as a description of the process and criteria used in prioritizing such health needs.5. A description of the existing health care facilities and other resources within the communityavailable to meet the community health needs identified through the CHNA.4 Page
6. A description of the needs identified that the hospital intends to address, the reasons thoseneeds were selected, and the means by which the hospital will undertake to address theselected needs.1The CHNA process for The Johns Hopkins Hospital (JHH) and Johns Hopkins Bayview Medical Center(JHBMC) included the collection and analysis of primary and secondary data. Both public and privateorganizations, such as faith-based organizations, government agencies, educational systems andhealth and human services entities were engaged to assess the needs of the community. In total,the extensive primary data collection phase resulted in the contribution of more than 750community stakeholders/leaders and community residents. The 2013 CHNA served as a baseline toprovide a deeper understanding of the health, as well as the socioeconomic needs of thecommunity.Primary data in the form of an online and a paper survey gathered feedback from communityresidents and health system staff. Fifty-two stakeholder interviews were conducted with individualswho represented a) broad interests of the community, b) populations of need or c) persons withspecialized knowledge in public health. Six focus groups with a total of 83 participants wereconducted with vulnerable populations, along with the distribution and collection of a paper handsurvey, which gathered a wide range of information from 648 community residents. A communityhealth forum was facilitated with over 30 key community leaders and representatives. The forumprioritized health needs, which helped outline implementation and planning. An interactive resourceinventory was created to highlight available programs and services within The Johns HopkinsHospital (JHH) and Johns Hopkins Bayview Medical Center’s (JHBMC) community benefits servicearea (CBSA)2. The inventory identifies organizations and agencies in the community that are servingthe various target populations within each of the priority needs.A secondary data profile was compiled with local, state and federal figures to provide essentialinformation, insight and knowledge on a broad range of health and social issues. Collecting andexamining information about different community aspects and behaviors help explain and identifyfactors that influence the community’s health.Information collected from secondary data provided reliable facts from multiple government andsocial agencies. The collection of a comprehensive database provides information to understand thehealth of a community overall. Data collected encompassed socioeconomic information, healthstatistics, demographics, children’s health, mental health issues, etc. This report is a summary ofprimary and secondary data collected throughout the CHNA.As part of the secondary data profile, data from Truven Health Analytics3 was analyzed to gain adeeper understanding of community health care needs. The Community Needs Index (CNI), jointly1The outcomes from the CHNA will be addressed through an implementation planning phase.The Community Benefits Service Area (CBSA) or the overall study area referenced in the report refers to the nineZIP codes that defined the communities for JHH and JHBMC in the CHNA. The ZIP codes included are 21202, 21205,21206, 21213, 21218, 21219, 21222, 21224 and 21231.3Truven Health Analytics, formerly known as Thomson Reuters, is a multinational health care company thatdelivers information, analytic tools, benchmarks, research and services to a variety of organizations andcompanies. Truven Health Analytics uses: Demographic data, poverty data (from The Nielsen Company) and25 Page
developed by Dignity Health and Truven Health, assists in the process of gathering vitalsocioeconomic factors in the community. The tool is a strong indicator of a community’s demand forvarious health care services.Based on a wide array of demographic and economic statistics, the CNI provides a score for everypopulated ZIP code in the United States on a scale of 1.0 to 5.0. A score of 1.0 indicates a ZIP codewith the least need, while a score of 5.0 represents a ZIP code with the most need. The CNI shouldbe used as a part of the larger community needs assessment to assist in pinpointing specific areasthat have greater needs compared to others. The information collected was used to identify actionitems for inclusion in the Implementation Strategy.The development of the CHNA and the Implementation Strategy was led by the Office ofGovernment and Community Affairs (Tom Lewis, Vice President), Dr. Redonda Miller (JHH VicePresident for Medical Affairs) and Dr. Richard Bennett (JHBMC President), and involved thecontributions of over 750 individuals through direct interviews, surveys, focus groups and acommunity forum. Key stakeholder groups included but were not limited to, community residents,members of faith based organizations, neighborhood association leaders, health professionals,Johns Hopkins Medicine leadership and other experts both internal and external to Johns Hopkins.JHH and JHBMC engaged Tripp Umbach to assist in producing a CHNA for their hospitals. This reportis the result of the collaborative efforts of Tripp Umbach consultants Ha Pham and Barbara Terryand senior Johns Hopkins leadership.The overall CHNA involved multiple steps that are depicted in the flow chart below. Additionalinformation regarding each component of the project, and the results, can be located in theAppendices section of this report.Flow Chart 1: CHNA Processinsurance coverage estimates (from Truven Health Analytics) to provide Community Needs Index (CNI) scores atthe ZIP code level. Additional information on Truven Health Analytics can be found in the Appendices.6 Page
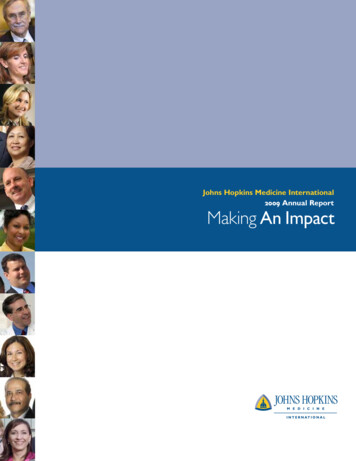
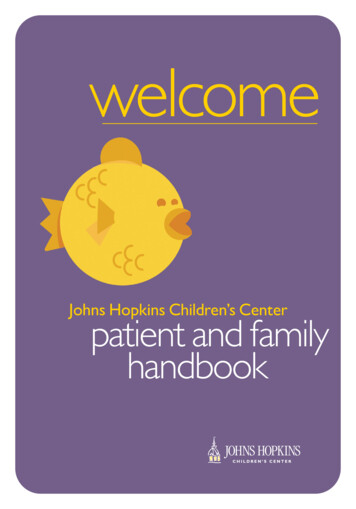
Community Benefits Service Area (CBSA)In 2015, a total of nine ZIP codes were analyzed for the Johns Hopkins Institutions. These ZIP codesrepresent the community benefit service area (CBSA) for The Johns Hopkins Hospital and Johns HopkinsBayview Medical Center. The Johns Hopkins Institutions provide services to communities throughoutMaryland, adjoining states and internationally. The community health needs assessment focused onnine specific ZIP codes: 21202, 21205, 21206, 21213, 21218, 21219, 21222, 21224 and 21231. This areareflects the population with the largest usage of the emergency departments and the majority ofrecipients of community benefit contributions and programming. Within the CBSA, JHH and JHBMC havefocused on certain target populations such as the elderly, at-risk children and adolescents, uninsuredindividuals and households, and underinsured and low-income individuals and households.The following map geographically depicts the community benefits service area by showing thecommunities that are shaded. Again, the CBSA encompasses nine ZIP codes across East Baltimore Cityand southeast Baltimore County (See Map 1).Map 1: Overall Community Benefits Service Area – 2015 Study Area MapSource: Truven Health Analytics 2015The overall study area for JHH and JHBMC shows that all of the ZIP codes in the CBSA, with theexception of ZIP code 21213, are expected to have population growth from 2015 to 2020. ZIP code21213 is anticipated to have a decrease in population of -0.2 percent. ZIP code 21202 and BaltimoreCounty are expected to have the greatest population increase from 2015 to 2020, each reporting a 3.5percent rise. (See Table 1).7 Page
% Change2015-20203.5%1.3%1.1%-0.2%0.9%Baltimore CountyBaltimore City2123149,310 10,012 58,438 51,513 16,575 646,775 864,0792122450,903 32,091212222020 Total 24,648 16,509Population212192121848,8902120650,347 32,146212052015 Total 23,812 16,300Population2120221213Table 1: Area Population Snapshot9,743 56,953 50,053 16,032 637,630 834,5552.8%2.6%2.9%3.4%1.4%3.5%Source: Truven Health Analytics 20158 Page
There is a close representation of males and females in the overall study area and the state. ZIP code21202 has a higher percentage of males than the rest of the study area ZIP codes in 2015, a trend that isexpected to continue into 2020 (See Table 2).MarylandOverall Study able 2: Gender Snapshot2015 MalePopulation59.7% 45.9% 46.5% 45.7%48.1% 49.4% 48.4% 50.0% 49.3% 48.8% 48.5%2020 MalePopulation59.4% 46.3% 46.7% 46.0%48.3% 49.4% 48.5% 50.0% 49.3% 49.0% 48.5%2015 FemalePopulation40.3% 54.1% 53.5% 54.3%51.9% 50.6% 51.6% 50.0% 50.7% 51.2% 51.5%2020 FemalePopulation40.6% 53.7% 53.3% 54.0%51.7% 50.6% 51.5% 50.0% 50.7% 51.0% 51.5%Source: Truven Health Analytics 20159 Page
The data reveal a higher representation in the overall study area of Black, Non-Hispanic when comparedto the state and the nation. ZIP codes 21219 (92.4 percent), 21222 (76.4 percent), 21224 (57.2 percent)and 21231 (52.9 percent) are predominately White, Non-Hispanic. ZIP codes 21202 (60.6 percent),21205 (69.3 percent), 21206 (70.2 percent), 21213 (90.5 percent) and 21218 (61.0 percent) arepredominately Black, Non-Hispanic (See Table 3). ZIP code 21224 has the highest rate of Hispanic (21.7 percent) population. ZIP code 21218 has the highest rate of Asian/Pacific Islander, Non-Hispanic (6.1 percent)population.USAMDOverall Study able 3: Race/Ethnicity SnapshotWhite NonHispanic29.6% 16.5% 22.6%6.1% 27.1% 92.4% 76.4% 57.2% 52.9% 41.4% 52.6% 61.8%Black NonHispanic60.6% 69.3% 70.2% 90.5% 61.0% 3.5% 11.9% 15.8% 28.5% 45.9% 29.0% 12.3%Hispanic3.3% 11.0%2.4%1.4%3.2% 1.5%5.6% 21.7% 11.2%7.2%9.4% 17.6%Asian/PacificIslander NonHispanicAll Others4.3% 1.1%1.9%0.4%6.1% 0.8%2.0% 2.7%5.2%2.9%6.2%5.3%2.2% 2.2%2.8%1.7%2.5% 1.8%4.2% 2.5%2.2%2.7%2.8%3.1%Source: Truven Health Analytics 201510 P a g e
It is important to review the CNI scores obtained by Truven Health Analytics. The CNI ZIP code summaryprovides valuable background information to begin addressing and planning for the community’scurrent and future needs. The CNI provides greater ability to diagnose community needs as it exploresZIP code areas with significant barriers to health care access.In assessing the CNI scores for the overall study area or CBSA, the CNI score in 2014 was 4.2*; while theCNI for 2015 was 4.3*. This is an increase of 0.1 from 2014 to 2015, indicating that the overall studyarea now faces increased barriers to accessing care. Again, a CNI score of 1.0 indicates a ZIP code withthe least need, while a score of 5.0 represents a ZIP code with significant need. It is important to notethat ZIP codes with a low score (e.g., 1.0) do not imply that no attention should be given to thatneighborhood; rather, hospital leadership should decipher what specifically is strategically working wellto ensure a low neighborhood score (See Table 4).Source: Truven Health Analytics 2015House Rank2014 CNI Score*CNI Score ChangeInsurance Rank2015 CNI Score *Education RankOverall 304,276 18.55% 28.32% 40.82% 2.98% 58.62% 20.72% 14.52% 11.19% 46.57% 3StudyAreaCultural RankIncome RankRentUninsuredUnemploymentNo High School DiplomaMinorityLimited EnglishSingle w/ Children PovertyPoverty ChildPoverty 65 years 2015 PopulationTable 4: Overall Study Area Summary54454.2 4.3 0.1* Weighted average of total market11 P a g e
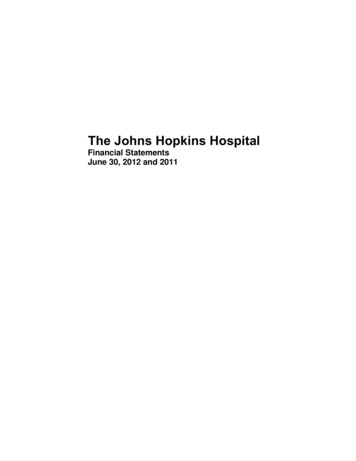
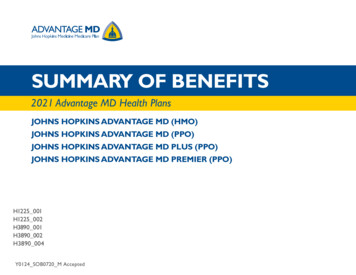
Continuing to review CNI information, the map below provides a geographic representation of the CNIscores depicted from Table 4. ZIP codes that have higher socioeconomic barriers (5.0) are represented indark green. As the socioeconomic scores decrease, the coding color lightens. There are concentratedareas within Baltimore City that signify high socioeconomic barriers to care (See Map 2).Map 2: CNI Study Area MapSource: Truven Health Analytics 2015Higher socioeconomic barriersLower socioeconomic barriers12 P a g e
Key Community Health NeedsThe health status of a community depends on many factors, including quality of health care, social andeconomic determinants, individual behaviors, heredity, education and the physical environment.Healthy People 2020 creates targets for the nation for improving health status, promoting communityhealth, and challenging individuals, communities and professionals to take specific steps to ensure thatgood health, as well as long life, are enjoyed by all. Because “health” is more than just the absence ofdisease, a focus on socioeconomic factors is required.Socioeconomic status is often defined as the social and economic experiences that shape and frame aperson’s lifestyle. The environment—in particular, where we work and live—as well as education,income and age play a significant role in an individual’s socioeconomic status. It is well documented thatresidents who are uneducated and have limited financial resources often experience challenges such aspoor housing, limited employment advancement and a low quality of life. All of these challengesultimately affect their health outcomes.Children attending school in poor conditions may have low educational achievements and lack a richeducational infrastructure. Parents who struggle with employment opportunities will be less likely toafford educational resources for their children such as computers, tutors and books—materials whichoften assist students becoming successful.Similarly, community residents living in neighborhoods that are underserved may face higher levels ofstress if their community is plagued with crime, drugs and poverty. The increased tension due to thecity’s social injustices and inequalities have produced higher levels of stress leading to civil unrest,mental and behavioral health problems, and the potential for increased use and abuse of drugs andalcohol products.Residents in East Baltimore City and southeast Baltimore County are aware of the health and socialinequalities and disparities that exist. Addressing these disparities and working to reduce thesocioeconomic gaps can bridge and provide sustainable support for those who have limited options.Residents who have a low socioeconomic status have significant challenges when accessing resourcesand services.The Johns Hopkins Institutions have significant strategies that are geared towards addressing the healthand well-being of the community’s marginalized youths and residents. As a large economic driver in theregion, JHH and JHBMC’s leaders have encouraged the health and well-being of the marginalizedpopulations through their programs, community initiatives and economic development projects.Providing programs that offer employment opportunities, platforms which address the social and healthneeds of the disparate population, and continued regional support working in close collaboration withregional and local community organizations, the Johns Hopkins Institutions have placed a substantialfootprint in the region.The Johns Hopkins Hospital and Johns Hopkins Bayview Medical Center will continue to address thesocioeconomics of their community residents with innovative and effective programs, communityoutreach efforts, and collaboration and partnerships with nonprofits and local organizations to reachvulnerable residents and those most affected by the health and social disparities across the city.13 P a g e
In the summer of 2015, JHH and JHBMC continued their commitment to the community through acomprehensive CHNA process and engaged a variety of community organizations, community leadersand agencies in order to identify the needs of their community residents. The CHNA focused on nine ZIPcodes within the study area known as the community benefits service area (CBSA). With support fromkey community representatives, health officials, hospital leadership and community stakeholders within-depth knowledge regarding East Baltimore City and southeast Baltimore County, the CHNA helpedidentify and prioritize the community’s needs.One of the objectives of the Patient Protection and Affordable Care Act (PPACA) is to identify ways tobetter coordinate health services to allow greater accessibility, while reducing health care costs forpatients and caregivers. As a result, health care organizations are streamlining services and collaboratingwith community agencies and organizations to capitalize on the ability to share resources. By providingaffordable health care insurance, a large portion of the previously uninsured population now has apathway to affordable and accessible preventive services.Four key need areas were identified during the CHNA process through the gathering of primary andsecondary data from local, state and national resources, community stakeholder interviews, handdistributed surveys, focus groups with vulnerable populations, a community forum and a health providerinventory (highlighting organizations and agencies that serve the community). The identified communityneeds are depicted in order of priority in the graph below (See Graph 1).Graph 1: Key Community Health NeedsImprovingSocioeconomicFactorsAccess to LivableEnvironmentsAccess toBehavioral HealthServicesAccess to HealthServicesEducationHousingMental HealthDental nsuredCrime andSafetyChronicDiseases14 P a g e
Improving Socioeconomic FactorsWhile biological makeup or genetics determine some health issues an individual will experience,socioeconomic factors, like income, education and employment opportunities, can shape how peoplemake decisions related to their health and the access they have to health care services. There is a directand indirect correlation between community residents’ overall health and low levels of educationalattainment and the inability to secure employment. It is not uncommon that residents living in povertyface multiple challenges related to high crime rates, poor home conditions and low educationalattainment. Often, individuals in these situations are focused on obtaining basic living needs (e.g. food,affording utilities and housing) for themselves and their families. Without access to higher educationand associated employment opportunities, community residents will continue to struggle with thesechallenges.The table below provides a snapshot from County Health Rankings and Roadmaps of where BaltimoreCity compares to Baltimore County in years 2012 and 2015. The ranking scale enables communities,organizations and agencies to assess where their communities lie in comparison to the remaining 23counties in Maryland. Baltimore City ranks 24 out of 24 on Socioeconomic Factors in years 2012 and2015; while Baltimore County ranks 12 in years 2012 and 2015 (See Table 5).Factors that are used to derive the overall socioeconomic rankings are high school graduation, somecollege, unemployment, children in poverty, income inequality, children in single-parent households,social associations, violent crime and injury deaths.Table 5: County Health Rankings and Roadmaps Social and Economic FactorsCounty Health Rankings and Roadmaps4Social and Economic Factors RankingsBaltimore City201224201524Baltimore County201212201512Source: County Health Rankings & Roadmaps 2015 and 20124Maryland has 24 counties; the rating scale for Maryland is 1 to 24 (1 being the healthiest county and 24 being theleast healthy). Counties are ranked relative to the health of other counties in the same state on specific measures.15 P a g e
EducationAn individual’s level of education affects their health status, as it can dictate employment opportunitiesand comprehension capabilities. The role of education is essential due to the connection betweenincome and employment. Educated individuals are more likely to have job security, are often betterequipped to navigate to and access the services they need, and understand the importance of serviceslike preventive health measures and making healthy choices for themselves and their families. Educatedresidents are more aware of their own health status and the health status of their family. Beingeducated can mitigate some of the environmental factors that negatively affect the health status ofdisadvantaged populations by providing them with the tools they need to better understand theirenvironment and to take advantage of opportunities to improve their situation.Higher education attainment statistics of the overall study area compared poorly with the state and thenation. Slightly more than one-third (34.0 percent) of community residents have a high school diploma,higher than the state (26.0 percent) and the nation (28.1 percent), just 21.6 percent or one in fivecommunity residents have a bachelor’s degree or greater; much lower than the overall rates for boththe state (36.8 percent) and the nation (28.9 percent) (See Table 6).Less than HighSchool5.6% 12.9% 4.8% 5.3%4.9%5.2%6.5% 12.5%8.1%USAMDOverall Study able 6: Education Level7.2%4.4% 5.9%8.6% 13.5%6.7% 8.0%Some HighSchool17.4% 23.6% 10.4% 18.2% 12.6% 12.0% 12.7% 12.6%High SchoolDiploma28.3% 37.0% 37.0% 42.1% 27.5% 41.1% 43.9% 28.1% 16.5% 34.0% 26.0% 28.1%Some College /Assoc. Degree18.4% 19.1% 31.5% 24.0% 24.2% 30.6% 27.3% 18.4% 13.9% 23.8% 26.1% 29.1%Bachelor'sDegree orGreater30.3%7.4% 16.2% 10.4% 30.9% 11.1%9.6% 28.4% 52.9% 21.6% 36.8% 28.9%Source: Truven Health Analytics 201516 P a g e
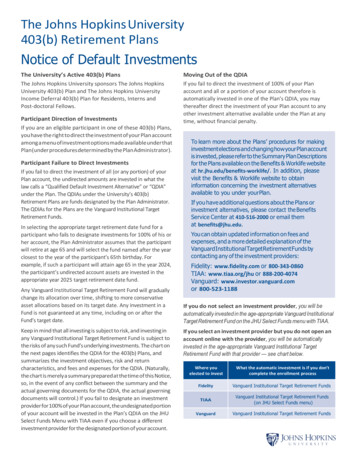
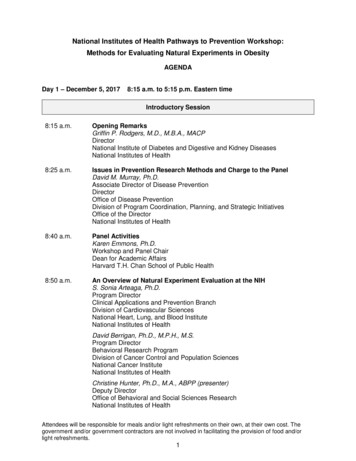
Data from The Annie E. Casey Foundation highlights the dropout rate. Baltimore City had the highestdropout rate (6.3 percent) of students in grades 9-12 in 2013-2014. This rate is more than double that ofBaltimore County (2.7 percent) and the state (2.9 percent). Baltimore City saw a marked increase in thedropout rate from 2012-2013 to 2013-2014, going from 4.5 percent to 6.3 percent (See Chart 1), whileboth Baltimore County and the overall state rate saw a slight decline.Chart 1: Dropout Rate (Students in Grades .5%3.6%3.0%BaltimoreCounty, 14BaltimoreCity, e: Kids Count 2015, The Annie E. Casey FoundationCommunity stakeholders reported that education begins at the elementary stage, addressing andreinforcing information beyond basic subjects (e.g., nutrition, health topics/disease, mental health, etc.).It was cited that most often community residents do not foresee nor comprehend how education islinked to a pathway towards a healthier, more productive life.A greater emphasis needs to be placed on the correlation between education and income, noting thereare greater employment opportunities, options and availability to those who have a higher level ofeducational attainment. Higher education enables community residents to understand concepts andtheories, expanding their overall knowledge base; which in turn, leads to residents having a strongerunderstanding of their community, environment and health.In February 2014, a new Baltimore City School Superintendent was appointed. With this appointment,there is hope that education in the City will improve and community residents an
The Johns Hopkins Institutions provide services to communities throughout Maryland, adjoining states and internationally. The community health needs assessment focused on nine specific ZIP codes: 21202, 21205, 21206, 21213, 21218, 21219, 21222, 21224 and 21231. This area