Transcription
AssessmentsLeadership PracticesInventory: LPIJAMES M. KOUZES & BARRY Z. POSNERIndividual Feedback ReportPrepared for Amanda Lopez February 22, 2012
CONTENTSThe Five Practices of Exemplary Leadership and the LPI Report1The Five Practices Data Summary2The Five Practices Bar Graphs3Leadership Behaviors Ranking4-5Model the Way Data Summary6Model the Way Bar Graphs7Inspire a Shared Vision Data Summary8Inspire a Shared Vision Bar Graphs9Challenge the Process Data Summary10Challenge the Process Bar Graphs11Enable Others to Act Data Summary12Enable Others to Act Bar Graphs13Encourage the Heart Data Summary14Encourage the Heart Bar Graphs15Percentile Ranking16Essay Question Responses17
Amanda LopezFebruary 22, 2012The Five Practices of Exemplary Leadership Created by James M. Kouzes and Barry Z. Posner in the early 1980s and first identified in their internationally best-selling book, TheLeadership Challenge, The Five Practices of Exemplary Leadership approaches leadership as a measurable, learnable, and teachableset of behaviors. After conducting hundreds of interviews, reviewing thousands of case studies, and analyzing more than two millionsurvey questionnaires to understand those times when leaders performed at their personal best, there emerged five practices commonto making extraordinary things happen. The Five Practices areThe Leadership Practices Inventory (LPI) instrument is an essential tool to help you gain perspective into how you see yourselfas a leader, how others view you, and what actions you can take to improve your use of The Five Practices, which research hasdemonstrated, year after year, make for more effective leaders.ABOUT YOUR LPI REPORTThe LPI measures the frequency of thirty specific leadership behaviors on a 10-point scale, with six behavioral statements for eachof The Five Practices. You and the observers you selected rated how frequently you engage in each of these important behaviorsassociated with The Five Practices. The response scale is:1–Almost Never2–RarelyRESPONSE SCALE3–Seldom4–Once in a While5–Occasionally6–Sometimes7–Fairly Often8–Usually9–Very Frequently10–Almost AlwaysIn the following report pages, you’ll see your LPI Self (S) responses and your observer responses, which are categorized into Manager(M), Direct Report (D), Co-Worker (C), and Other (O). Observer responses are categorized as “Other” when there are not enoughresponses in the Direct Report or Co-Worker categories to preserve observer anonymity. The average observer rating (AVG) is anaverage of all LPI observer responses including Manager.RATER ABBREVIATIONS:S–SelfM–ManagerD–Direct ReportC–Co-WorkerO–OtherAVG– Average of all Observer ResponsesYou requested a total of 10 observers to rate you; of these, 9 have submitted an Observer survey as of report date and are included inyour report results. Copyright 2013 by James M. Kouzes and Barry Z. Posner. Published by Pfeiffer. All rights reserved.LPI FEEDBACK REPORTPAGE1
Amanda LopezFebruary 22, 2012The Five Practices Data SummaryThis page summarizes your LPI responses for each leadership practice. The Self column shows the total of your own responses to thesix behavioral statements about each practice. The Individual Observers columns show the total of each Observer’s six responses forthe practice. The AVG column shows the average of all your Observers’ total responses. Total responses for each practice can rangefrom 6 to 60; which represents adding up the response score (ranging from 1–Almost Never to 10–Almost Always) for each of the sixbehavioral statements related to that practice.SELFAVGINDIVIDUAL lthe WayInspire aShared VisionChallengethe ProcessEnableOthers to ActEncouragethe HeartM–ManagerD–Direct ReportC–Co-WorkerO–OtherAVG–Average of all Observer Responses Copyright 2013 by James M. Kouzes and Barry Z. Posner. Published by Pfeiffer. All rights reserved.LPI FEEDBACK REPORTPAGE2
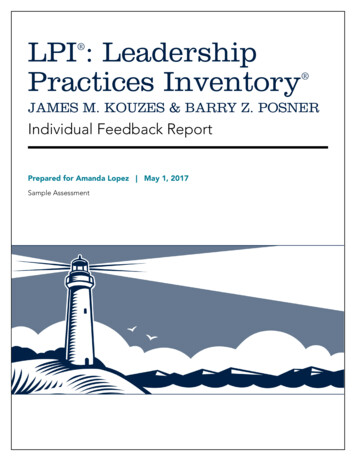
Amanda LopezFebruary 22, 2012The Five Practices Bar GraphsThese bar graphs, one set for each leadership practice, provide a graphic representation of the numerical data recorded on TheFive Practices Data Summary page. By practice, it shows the total response for Self and the average total for each category ofObserver. Average refers to the average for all categories of Observers (including Manager). Total responses can range from 6 to 60;which represents adding up the response score (ranging from 1–Almost Never to 10–Almost Always) for each of the six behavioralstatements related to that practice.Model the Way0SELFAVERAGEMANAGERDIRECT 53035404550556053.045.851.045.344.746.0Inspire a Shared Vision0SELFAVERAGEMANAGERDIRECT hallenge the Process0SELFAVERAGEMANAGERDIRECT nable Others to Act0SELFAVERAGEMANAGERDIRECT ncourage the Heart0SELFAVERAGEMANAGERDIRECT REPORTCO-WORKEROTHER5101539.040.647.036.042.048.0 Copyright 2013 by James M. Kouzes and Barry Z. Posner. Published by Pfeiffer. All rights reserved.LPI FEEDBACK REPORTPAGE3
Amanda LopezFebruary 22, 2012Leadership Behaviors RankingThe following page shows the ranking, from most frequent to least frequent, of all thirty leadership behaviors based on the averageof your Observers’ responses. The average (AVG) includes the Manager response, which is also shown separately. Horizontal linesseparate the 10 most and the 10 least frequent behaviors from the middle 10. A plus sign ( ) next to the AVG or Manager (M)response indicates that the response is more than 1.5 points higher than your Self response; a minus sign (-) indicates that theresponse is more than 1.5 points lower than your Self response. Since 1.5 is approximately the average difference between Self andObserver scores, any difference greater than that merits attention. When the /- column is blank in a given row, this indicates areasonable degree of agreement between the SELF and AVG or SELF and MANAGER scores. The response scale runs from 1–AlmostNever to 10–Almost Always.The AVG of All Observersincluding ManagerPRACTICE14. Treats others with dignity and respectSELF AVG /-8EnableLPI behavior #and statementThe averageObserver responseis more than 1.5points higher thanthe Self responseIndicates thebehavior is related tothe practice of EnableOthers to ActPRACTICE14. Treats others with dignity and respectEnable1–Almost Never2–Rarely3–Seldom4–Once in a While5–Occasionally6–Sometimes7–Fairly Often8–Usually86-The Managerresponse is morethan 1.5 pointslower than theSelf responseSELF AVG /-The averageObserver responseis less than a 1.5point differencecompared to SelfRESPONSE SCALE9.6 M /-9.2M /-7The Managerresponse is less thana 1.5 point differencecompared to Self9–Very Frequently10–Almost Always Copyright 2013 by James M. Kouzes and Barry Z. Posner. Published by Pfeiffer. All rights reserved.LPI FEEDBACK REPORTPAGE4
Amanda LopezFebruary 22, 2012MOST FREQUENTPRACTICESELF AVG /-14. Treats others with dignity and respectEnable109.61011. Follows through on promises and commitments he/she makesModel109.0103. Seeks out challenging opportunities that test his/her own skills and abilitiesChallenge108.991. Sets a personal example of what he/she expects of othersModel108.7102. Talks about future trends that will influence how our work gets doneInspire108.610Challenge108.4 -7-Challenge98.494. Develops cooperative relationships among the people he/she works withEnable88.489. Actively listens to diverse points of viewEnable98.29Challenge88.2823.Makes certain that we set achievable goals, make concrete plans, and establishmeasurable milestones for the projects and programs we work on28. Experiments and takes risks, even when there is a chance of failure13.Searches outside the formal boundaries of his/her organization for innovative waysto improve what we doM /-24. Gives people a great deal of freedom and choice in deciding how to do their workEnable108.1 -9Spends time and energy making certain that the people he/she works with adhereto the principles and standards that we have agreed onModel98.18Challenge97.9819. Supports the decisions that people make on their ownEnable87.9822. Paints the “big picture” of what we aspire to accomplishInspire67.9 8 Inspire77.8826. Is clear about his/her philosophy of leadershipModel87.6821. Builds consensus around a common set of values for running our organizationModel97.4 7.27Encourage67.18 Encourage57.1 8 Encourage97.0 -7-Enable86.86-12. Appeals to others to share an exciting dream of the futureInspire96.4 -6-20. Publicly recognizes people who exemplify commitment to shared valuesEncourage56.08 25. Finds ways to celebrate accomplishmentsEncourage65.98 16. Asks for feedback on how his/her actions affect other people’s performanceModel75.0 -76.8. Challenges people to try out new and innovative ways to do their work7. Describes a compelling image of what our future can be like30.Gives the members of the team lots of appreciation and support for theircontributions18. Asks “What can we learn?” when things don’t go as expected17.Shows others how their long-term interests can be realized by enlisting in acommon vision27. Speaks with genuine conviction about the higher meaning and purpose of our work5. Praises people for a job well done15.Makes sure that people are creatively rewarded for their contributions to thesuccess of projects10. Makes it a point to let people know about his/her confidence in their abilities29.Ensures that people grow in their jobs by learning new skills and developingthemselvesLEAST FREQUENT Copyright 2013 by James M. Kouzes and Barry Z. Posner. Published by Pfeiffer. All rights reserved.LPI FEEDBACK REPORTPAGE5
Amanda LopezFebruary 22, 2012Model the Way Data Summary Clarify values by finding your voice and affirming shared values Set the example by aligning actions with shared valuesThis page shows the responses for each of the six leadership behaviors related to this practice. The Self column shows the responsesyou gave yourself for each behavior. The AVG column shows the averages of the Observers’ responses. The Individual Observerscolumns show each Observer’s response for each behavioral item. Responses can range from 1–Almost Never to 10–Almost Always.SELFAVGINDIVIDUAL 10849889109.01091010688101016. Asks for feedback on howhis/her actions affect otherpeople’s performance75.076761555321. Builds consensus arounda common set of values forrunning our organization97.488995967626. Is clear about his/herphilosophy of leadership87.68998487781.Sets a personal example ofwhat he/she expects of others6.Spends time and energymaking certain that thepeople he/she works withadhere to the principles andstandards that we haveagreed on11. Follows through on promisesand commitments he/shemakesRESPONSE SCALEM–Manager1–Almost Never2–RarelyD–Direct ReportC–Co-Worker3–Seldom4–Once in a rly Often8–Usually9–Very Frequently10–Almost AlwaysAVG–Average of all Observer Responses Copyright 2013 by James M. Kouzes and Barry Z. Posner. Published by Pfeiffer. All rights reserved.LPI FEEDBACK REPORTPAGE6
Amanda LopezFebruary 22, 2012Model the Way Bar Graphs Clarify values by finding your voice and affirming shared values Set the example by aligning actions with shared valuesThe set of bar graphs for each of the six leadership behaviors related to this practice provides a graphic representation of your andyour Observers’ average responses for that behavior. By behavior, it shows the response for Self and the average response for eachcategory of Observer. Average refers to the average response for all categories of Observers (including Manager). Responses canrange from 1–Almost Never to 10–Almost Always.1.Sets a personal example of what he/she expects of others6.Spends time and energy makingcertain that the people he/she workswith adhere to the principles andstandards that we have agreed onSAVGMDCOS 10.0AVG 9.0M 10.0D 8.8C 8.7O 10.016. Asks for feedback on how his/her actions affect other people’sperformanceSAVGMDCO7.05.07.05.05.03.021. Builds consensus around a commonset of values for running ourorganizationSAVGMDCO9.07.48.07.87.36.026. Is clear about his/her philosophy Manager1–Almost Never2–RarelyD–Direct 9100123456789100123456789109.08.18.07.88.39.011. Follows through on promises andcommitments he/she makesRESPONSE SCALE0S 10.0AVG 8.7M 10.0D 8.5C 8.0O 10.03–Seldom4–Once in a etimes7–Fairly Often8–Usually9–Very Frequently10–Almost AlwaysAVG–Average of all Observer Responses Copyright 2013 by James M. Kouzes and Barry Z. Posner. Published by Pfeiffer. All rights reserved.LPI FEEDBACK REPORTPAGE7
Amanda LopezFebruary 22, 2012Inspire a Shared Vision Data Summary Envision the future by imagining exciting and ennobling possibilities Enlist others in a common vision by appealing to shared aspirationsThis page shows the responses for each of the six leadership behaviors related to this practice. The Self column shows the responsesyou gave yourself for each behavior. The AVG column shows the averages of the Observers’ responses. The Individual Observerscolumns show each Observer’s response for each behavioral item. Responses can range from 1–Almost Never to 10–Almost Always.SELFAVGINDIVIDUAL OBSERVERSM1D1D2D3D4C1C2C3O2.Talks about future trends thatwill influence how our workgets done108.6109910688897.Describes a compelling imageof what our future could belike77.889895887812. Appeals to others to share anexciting dream of the future96.466774777717. Shows others how theirlong-term Interests can berealized by enlisting in acommon vision77.387795876922. Paints the “big picture” ofwhat we aspire to accomplish67.989895869927. Speaks with genuineconviction about the highermeaning and purpose of ourwork67.27991066657RESPONSE SCALEM–Manager1–Almost Never2–RarelyD–Direct ReportC–Co-Worker3–Seldom4–Once in a rly Often8–Usually9–Very Frequently10–Almost AlwaysAVG–Average of all Observer Responses Copyright 2013 by James M. Kouzes and Barry Z. Posner. Published by Pfeiffer. All rights reserved.LPI FEEDBACK REPORTPAGE8
Amanda LopezFebruary 22, 2012Inspire a Shared Vision Bar Graphs Envision the future by imagining exciting and ennobling possibilities Enlist others in a common vision by appealing to shared aspirationsThe set of bar graphs for each of the six leadership behaviors related to this practice provides a graphic representation of your andyour Observers’ average responses for that behavior. By behavior, it shows the response for Self and the average response for eachcategory of Observer. Average refers to the average response for all categories of Observers (including Manager). Responses canrange from 1–Almost Never to 10–Almost Always.2.Talks about future trends that willinfluence how our work gets done7.Describes a compelling image ofwhat our future could be likeSAVGMDCO7.07.88.07.87.78.012. Appeals to others to share anexciting dream of the futureSAVGMDCO9.06.46.06.07.07.017. Shows others how their long-termInterests can be realized by enlistingin a common visionSAVGMDCO7.07.38.07.07.09.022. Paints the “big picture” of what weAspire to accomplishSAVGMDCO6.07.98.07.87.79.027. Speaks with genuine convictionAbout the higher meaning andpurpose of our workSAVGMDCO6.07.27.08.55.77.0RESPONSE SCALES–SelfM–Manager1–Almost Never2–RarelyD–Direct 8910012345678910012345678910S 10.0AVG 8.6M 10.0D 8.5C 8.0O 9.03–Seldom4–Once in a etimes7–Fairly Often8–Usually9–Very Frequently10–Almost AlwaysAVG–Average of all Observer Responses Copyright 2013 by James M. Kouzes and Barry Z. Posner. Published by Pfeiffer. All rights reserved.LPI FEEDBACK REPORTPAGE9
Amanda LopezFebruary 22, 2012Challenge the Process Data Summary Search for opportunities by seizing the initiative and by looking outward for innovativeways to improve Experiment and take risks by constantly generating small wins and learning from experienceThis page shows the responses for each of the six leadership behaviors related to this practice. The Self column shows the responsesyou gave yourself for each behavior. The AVG column shows the averages of the Observers’ responses. The Individual Observerscolumns show each Observer’s response for each behavioral item. Responses can range from 1–Almost Never to 10–Almost Always.SELFAVGINDIVIDUAL OBSERVERSM1D1D2D3D4C1C2C3O3.Seeks out challengingopportunities that test his/herown skills and abilities108.99101095999108.Challenges people to try outnew and innovative ways to dotheir work97.981010836971013. Searches outside the formalboundaries of his/herorganization for innovativeways to improve what we do88.28101095995918. Asks “What can we learn?”when things don’t go asexpected87.3868848771023. Makes certain that weset achievable goals, makeconcrete plans, and establishmeasurable milestones forthe projects and programs wework on108.478101069810828. Experiments and takes risks,even when there is a chance offailure98.4910101067969RESPONSE SCALEM–Manager1–Almost Never2–RarelyD–Direct ReportC–Co-Worker3–Seldom4–Once in a rly Often8–Usually9–Very Frequently10–Almost AlwaysAVG–Average of all Observer Responses Copyright 2013 by James M. Kouzes and Barry Z. Posner. Published by Pfeiffer. All rights reserved.LPI FEEDBACK REPORTPAGE10
Amanda LopezFebruary 22, 2012Challenge the Process Bar Graphs Search for opportunities by seizing the initiative and by looking outward for innovativeways to improve Experiment and take risks by constantly generating small wins and learning from experienceThe set of bar graphs for each of the six leadership behaviors related to this practice provides a graphic representation of your andyour Observers’ average responses for that behavior. By behavior, it shows the response for Self and the average response for eachcategory of Observer. Average refers to the average response for all categories of Observers (including Manager). Responses canrange from 1–Almost Never to 10–Almost Always.3.Seeks out challenging opportunitiesthat test his/her own skills andabilities8.Challenges people to try out newand innovative ways to do their workSAVGMDCO18. Asks “What can we learn?” whenthings don’t go as expectedS 8.0AVG 7.3M 8.0D 6.5C 7.3O 10.023. Makes certain that we setachievable goals, make concreteplans, and establish measurablemilestones for the projects andprograms we work onS 10.0AVG 8.4M 7.0D 8.5C 9.0O 8.028. Experiments and takes risks, evenwhen there is a chance of failureSAVGMDCOS–SelfM–Manager1–Almost Never2–RarelyD–Direct 910012345678910012345678910S 9.0AVG 7.9M 8.0D 7.8C 7.3O 10.013. Searches outside the formalboundaries of his/her organizationfor innovative ways to improve whatwe doRESPONSE SCALE0S 10.0AVG 8.9M 9.0D 8.5C 9.0O 4–Once in a etimes7–Fairly Often8–Usually9–Very Frequently10–Almost AlwaysAVG–Average of all Observer Responses Copyright 2013 by James M. Kouzes and Barry Z. Posner. Published by Pfeiffer. All rights reserved.LPI FEEDBACK REPORTPAGE11
Amanda LopezFebruary 22, 2012Enable Others to Act Data Summary Foster collaboration by building trust and facilitating relationships Strengthen others by increasing self-determination and developing competenceThis page shows the responses for each of the six leadership behaviors related to this practice. The Self column shows the responsesyou gave yourself for each behavior. The AVG column shows the averages of the Observers’ responses. The Individual Observerscolumns show each Observer’s response for each behavioral item. Responses can range from 1–Almost Never to 10--Almost Always.SELFAVGINDIVIDUAL OBSERVERSM1D1D2D3D4C1C2C3O4.Develops cooperativerelationships among thepeople he/she works with88.4891010688989.Actively listens to diversepoints of view98.2981095879914. Treats others with dignity 99995689986.865784877919. Supports the decisions thatpeople make on their own24. Gives people a great dealof freedom and choice indeciding how to do their work29. Ensures that people growin their jobs by learningnew skills and developingthemselvesRESPONSE SCALEM–Manager1–Almost Never2–RarelyD–Direct ReportC–Co-Worker3–Seldom4–Once in a rly Often8–Usually9–Very Frequently10–Almost AlwaysAVG–Average of all Observer Responses Copyright 2013 by James M. Kouzes and Barry Z. Posner. Published by Pfeiffer. All rights reserved.LPI FEEDBACK REPORTPAGE12
Amanda LopezFebruary 22, 2012Enable Others to Act Bar Graphs Foster collaboration by building trust and facilitating relationships Strengthen others by increasing self-determination and developing competenceThe set of bar graphs for each of the six leadership behaviors related to this practice provides a graphic representation of your andyour Observers’ average responses for that behavior. By behavior, it shows the response for Self and the average response for eachcategory of Observer. Average refers to the average response for all categories of Observers (including Manager). Responses canrange from 1–Almost Never to 10–Almost Always.4.Develops cooperative relationshipsamong the people he/she works with9.Actively listens to diverse pointsof viewSAVGMDCOSAVGMDCO9.08.29.08.08.09.014. Treats others with dignity andrespectSAVGMDCO10.09.610.09.010.010.019. Supports the decisions that peoplemake on their ownSAVGMDCO8.07.98.08.07.39.024. Gives people a great deal of freedomand choice in deciding how to dotheir workS 10.0AVG 8.1M 9.0D 8.0C 7.7O 9.029. Ensures that people grow in theirjobs by learning new skills anddeveloping themselvesSAVGMDCORESPONSE SCALES–SelfM–Manager1–Almost Never2–RarelyD–Direct .86.06.07.39.03–Seldom4–Once in a etimes7–Fairly Often8–Usually9–Very Frequently10–Almost AlwaysAVG–Average of all Observer Responses Copyright 2013 by James M. Kouzes and Barry Z. Posner. Published by Pfeiffer. All rights reserved.LPI FEEDBACK REPORTPAGE13
Amanda LopezFebruary 22, 2012Encourage the Heart Data Summary Recognize contributions by showing appreciation for individual excellence Celebrate the values and victories by creating a spirit of communityThis page shows the responses for each of the six leadership behaviors related to this practice. The Self column shows the responsesyou gave yourself for each behavior. The AVG column shows the averages of the Observers’ responses. The Individual Observerscolumns show each Observer’s response for each behavioral item. Responses can range from 1–Almost Never to 10–Almost Always.SELFAVGINDIVIDUAL OBSERVERSM1D1D2D3D4C1C2C3OPraises people for a job welldone67.187675968810. Makes it a point to let peopleknow about his/her confidencein their abilities97.076786767915. Makes sure that people arecreatively rewarded for theircontributions to the success ofprojects57.185510410105720. Publicly recognizes peoplewho exemplify commitment toshared values56.086563945825. Finds ways to celebrateaccomplishments65.986673565730. Gives the members of theteam lots of appreciationand support for theircontributions87.48669596995.RESPONSE SCALEM–Manager1–Almost Never2–RarelyD–Direct ReportC–Co-Worker3–Seldom4–Once in a rly Often8–Usually9–Very Frequently10–Almost AlwaysAVG–Average of all Observer Responses Copyright 2013 by James M. Kouzes and Barry Z. Posner. Published by Pfeiffer. All rights reserved.LPI FEEDBACK REPORTPAGE14
Amanda LopezFebruary 22, 2012Encourage the Heart Bar Graphs Recognize contributions by showing appreciation for individual excellence Celebrate the values and victories by creating a spirit of communityThe set of bar graphs for each of the six leadership behaviors related to this practice provides a graphic representation of your andyour Observers’ average responses for that behavior. By behavior, it shows the response for Self and the average response for eachcategory of Observer. Average refers to the average response for all categories of Observers (including Manager). Responses canrange from 1–Almost Never to 10–Almost Always.5.Praises people for a job well doneSAVGMDCO10. Makes it a point to let people knowabout his/her confidence in theirabilitiesSAVGMDCO9.07.07.06.86.79.015. Makes sure that people arecreatively rewarded for theircontributions to the success ofprojectsSAVGMDCO5.07.18.06.08.37.020. Publicly recognizes people whoexemplify commitment to sharedvaluesSAVGMDCO5.06.08.05.06.08.025. Finds ways to 30. Gives the members of the team lotsof appreciation and support fortheir contributionsSAVGMDCO8.07.48.06.58.09.0RESPONSE SCALES–SelfM–Manager1–Almost Never2–RarelyD–Direct Seldom4–Once in a etimes7–Fairly Often8–Usually9–Very Frequently10–Almost AlwaysAVG–Average of all Observer Responses Copyright 2013 by James M. Kouzes and Barry Z. Posner. Published by Pfeiffer. All rights reserved.LPI FEEDBACK REPORTPAGE15
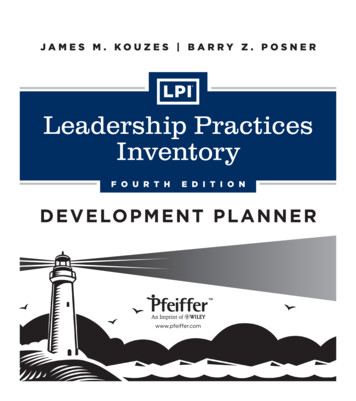
Amanda LopezFebruary 22, 2012Percentile RankingThe leaders and observers who make up the LPI database include a mix of males and females at all levels, from all types oforganizations, and from all over the world. This page compares your Self responses and those of your Observers to over one millionObserver responses for other leaders who have taken the LPI. The horizontal lines at the 30th and 70th percentiles divide the graphinto three segments, roughly approximating a normal distribution of scores. Each line on the graph shows what percentile your Self oran Observer category response falls into for each practice. For example, if your Self score for Model the Way is at the 50th percentile,half of the leaders in the database were rated higher by their Observers on the practice, and half were rated lower.MODELTHE WAYINSPIREA SHARED VISIONCHALLENGETHE PROCESSENABLEOTHERS TO ACTENCOURAGETHE HEARTMOST FREQUENT100908070FREQUENT605040LEAST FREQUENT3020100SelfManagerDirect ReportCo-WorkerOtherAverage of all Observers Copyright 2013 by James M. Kouzes and Barry Z. Posner. Published by Pfeiffer. All rights reserved.LPI FEEDBACK REPORTPAGE16
Amanda LopezFebruary 22, 2012Essay Question ResponsesThis page contains Observer responses to the open-ended essay questions presented with the Leadership Practices Inventory. Sinceanswering these questions is optional, each question may not have the same number of responses as the other question. If no Observerchose to answer a particular question, the response “No one answered this feedback question” will appear in the answer field.Q: What would you like to see this leader do more of?A: When I go the extra mile, he should acknowledge me and give me a nod of recognition.A: Give us more information about what’s going on in the long view.Q: What would you like to see this leader do less of?A: It would help if she let me have control over my tasks, when and how I accomplish them, as long as I get thejob done.A: MicromanagingA: I would like to see this Leader make fewer commitments that are not followed through. There have been too manytimes when the Leader has said one thing to me, and then not followed through to make that commitment happen.Q: What would you like to see this leader keep doing?A: She’s great at giving me challenging new jobs to tackle.A: She’s a good proponent for the department and I like that she fights for us with allocations and such.A: I would like to see this leader keep recognizing people for their good work. This leader does an excellent job ofmaking sure that you know that your work and contributions are appreciated and are rewarded.A: Planning fun events for our team.Q: What do you see as this leader’s weakness?No one answered this feedback question. Copyright 2013 by James M. Kouzes and Barry Z. Posner. Published by Pfeiffer. All rights reserved.LPI FEEDBACK REPORTPAGE17
The Five Practices of Exemplary Leadership Created by James M. Kouzes and Barry Z. Posner in the early 1980s and fi rst identifi ed in their internationally best-selling book, The Leadership Challenge, The Five Practices of Exemplary Leadership approaches leadership as a measurable, learnable, and teachable set of behaviors.