Transcription
LPI : LeadershipPractices Inventory JAMES M. KOUZES & BARRY Z. POSNERIndividual Feedback ReportPrepared for Amanda Lopez May 1, 2017Sample Assessment
CONTENTSThe Five Practices of Exemplary Leadership and the LPI Report . . . . . . . . . . . . . . . . .The Five Practices Data SummaryThe Five Practices Bar Graphs. . . . . . . . . . . . . . 1. . . . . . . . . . . . . . . . . . . . . 2. . . . . . . . . . . . . . . . . . . . . . . . 3Leadership Behaviors Ranking. . . . . . . . . . . . . . . . . . . . . . . 4Model the Way Data Summary. . . . . . . . . . . . . . . . . . . . . . . . 6Model the Way Bar Graphs. . . . . . . . . . . . . . . . . . . . . . . . . . 7Inspire a Shared Vision Data SummaryInspire a Shared Vision Bar Graphs. . . . . . . . . . . . . . . . . . . . 9Challenge the Process Data SummaryChallenge the Process Bar Graphs. . . . . . . . . . . . . . . . . .10. . . . . . . . . . . . . . . . . . . .11Enable Others to Act Data Summary .Enable Others to Act Bar Graphs. . . . . . . . . . . . . . . . . .12. . . . . . . . . . . . . . . . . . . . .13Encourage the Heart Data Summary. . . . . . . . . . . . . . . . . .14. . . . . . . . . . . . . . . . . . . . .15. . . . . . . . . . . . . . . . . . . . . . . . . . . . . .16Encourage the Heart Bar GraphsPercentile Ranking. . . . . . . . . . . . . . . . . . 8
Profile for Amanda LopezSample AssessmentMay 1, 2017The Five Practices of Exemplary Leadership Created by James M. Kouzes and Barry Z. Posner in the early 1980s and first identified in their internationally best-selling book, TheLeadership Challenge, The Five Practices of Exemplary Leadership approaches leadership as a measurable, learnable, and teachableset of behaviors. After conducting hundreds of interviews, reviewing thousands of case studies, and analyzing more than two millionsurvey questionnaires to understand those times when leaders performed at their personal best, there emerged five practices commonto making extraordinary things happen. The Five Practices are:The Leadership Practices Inventory (LPI) instrument is an essential tool to help you gain perspective into how you see yourself as aleader, how others view you, and what actions you can take to improve your use of The Five Practices, which research hasdemonstrated, year after year, make for more effective leaders.ABOUT YOUR LPI REPORTThe LPI measures the frequency of 30 specific leadership behaviors on a 10-point scale, with six behavioral statements for each of TheFive Practices. You and the observers you selected rated how frequently you engage in each of these important behaviors associatedwith The Five Practices. The response scale is:RESPONSE SCALE1-Almost Never3-Seldom5-Occasionally7-Fairly Often9-Very Frequently2-Rarely4-Once in a While6-Sometimes8-Usually10-Almost alwaysIn the following report pages, you'll see your LPI Self (S) responses and your observer responses, which are categorized into Manager(M), Direct Report (D), Co-Worker (C), and Other (O). Observer responses are categorized as "Other" when there are not enoughresponses in the Direct Report or Coworker categories to preserve observer anonymity. The average observer rating (AVG) is anaverage of all LPI observer responses including Manager.RATER ABBREVIATIONS:M-ManagerD-Direct ReportC-Co-WorkerO-OtherS-SelfAVG-Average of all Observer ResponsesYou requested a total of 9 observers to rate you; of these, 9 have submitted an Observer survey as of report date and are included inyour report results. Copyright 2017 by James M. Kouzes and Barry Z. Posner. Published by The Leadership Challenge, A Wiley Brand. All rights reserved. www.leadershipchallenge.com.LPI INDIVIDUAL REPORTPAGE 1
Profile for Amanda LopezSample AssessmentMay 1, 2017The Five Practices Data SummaryThis page summarizes your LPI responses for each leadership Practice. The Self column shows the total of your own responses to the sixbehavioral statements about each Practice. The Individual Observers columns show the total of each Observer's six responses for thePractice. The AVG column shows the average of all your Observers' total responses. Total responses for each Practice can range from 6to 60; which represents adding up the response score (ranging from 1-Almost Never to 10-Almost Always) for each of the six behavioralstatements related to that practice.SELF AVGModelthe WayInspire aShared VisionChallengethe ProcessEnableOthers to ActEncouragethe HeartM-ManagerD-Direct ReportM1D1INDIVIDUAL OBSERVERSD2 D3 D4 C1 AVG-Average of all Observer Responses Copyright 2017 by James M. Kouzes and Barry Z. Posner. Published by The Leadership Challenge, A Wiley Brand. All rights reserved. www.leadershipchallenge.com.LPI INDIVIDUAL REPORTPAGE 2
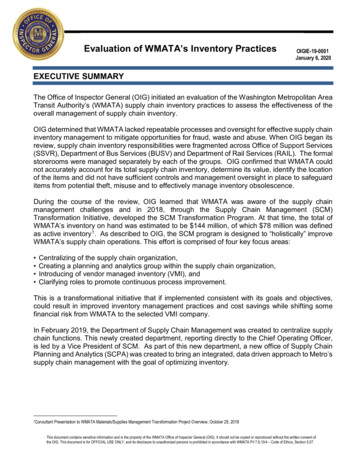
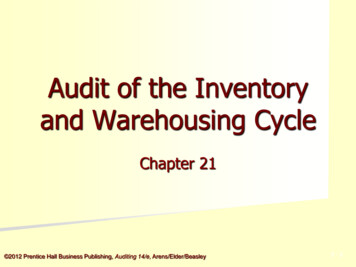
Profile for Amanda LopezSample AssessmentMay 1, 2017The Five Practices Bar GraphsThese bar graphs, one set for each leadership Practice, provide a graphic representation of the numerical data recorded on The FivePractices Data Summary page. By Practice, it shows the total response for Self and the average total for each category of Observer.Average refers to the average for all categories of Observers (including Manager). Total responses can range from 6 to 60; whichrepresents adding up the response score (ranging from 1-Almost Never to 10-Almost Always) for each of the six behavioral statementsrelated to that practice.Model the Way0SELFAVERAGEMANAGERDIRECT 5303540455055605345.851.045.344.746.0Inspire a Shared Vision0SELFAVERAGEMANAGERDIRECT llenge the Process0SELFAVERAGEMANAGERDIRECT ble Others to Act0SELFAVERAGEMANAGERDIRECT ourage the Heart0SELFAVERAGEMANAGERDIRECT REPORTCO-WORKEROTHER510153940.647.036.042.048.0 Copyright 2017 by James M. Kouzes and Barry Z. Posner. Published by The Leadership Challenge, A Wiley Brand. All rights reserved. www.leadershipchallenge.com.LPI INDIVIDUAL REPORTPAGE 3
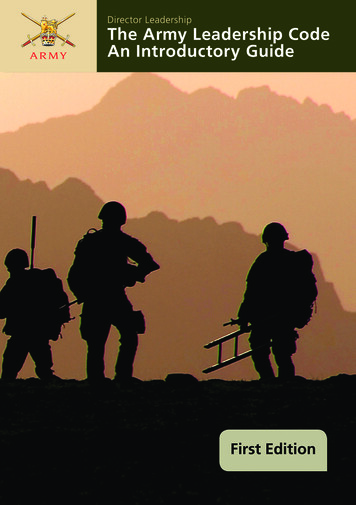
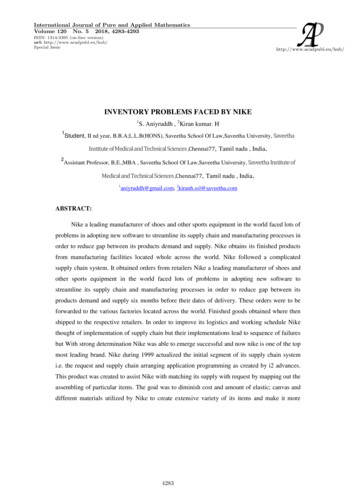
Profile for Amanda LopezSample AssessmentMay 1, 2017Leadership Behaviors RankingThe following page shows the ranking, from most frequent to least frequent, of all 30 leadership behaviors based on the average ofyour Observers’ responses. The average (AVG) includes the Manager response, which is also shown separately. Horizontal linesseparate the 10 most and the 10 least frequent behaviors from the middle 10. A plus sign ( ) next to the AVG or Manager (M) responseindicates that the response is more than 1.5 points higher than your Self response; a minus sign (-) indicates that the response is morethan 1.5 points lower than your Self response. Since 1.5 is approximately the average difference between self and observer scores, anydifference greater than that merits attention. When the /- column is blank in a given row, this indicates a reasonable degree ofagreement between the SELF and AVG or SELF and MANAGER scores. The response scale runs from 1-Almost Never to 10-AlmostAlways. Copyright 2017 by James M. Kouzes and Barry Z. Posner. Published by The Leadership Challenge, A Wiley Brand. All rights reserved. www.leadershipchallenge.com.LPI INDIVIDUAL REPORTPAGE 4
Profile for Amanda LopezSample AssessmentMay 1, 2017MOST FREQUENTPRACTICESELF AVG /-M /-14.Treats people with dignity and respectEnable109.610.011.Follows through on promises and commitmentsModel109.010.03.Seeks challenging opportunities to test skillsChallenge108.99.01.Sets a personal example of what is expectedModel108.710.02.Talks about future trends influencing our workInspire108.610.023.Identifies measurable milestones that keep projects moving forwardChallenge108.4 -7.0 -28.Takes initiative in anticipating and responding to changeChallenge98.49.04.Develops cooperative relationshipsEnable88.48.09.Actively listens to diverse points of viewEnable98.29.013.Actively searches for innovative ways to improve what we doChallenge88.28.024.Gives people choice about how to do their workEnable108.1 -9.0Model98.18.0Challenges people to try new approachesChallenge97.98.019.Involves people in the decisions that directly impact their job performanceEnable87.98.022.Paints "big picture" of group aspirationsInspire67.9 8.0 Describes a compelling image of the futureInspire77.88.026.Is clear about his/her philosophy of leadershipModel87.68.021.Builds consensus around organization's valuesModel97.4 -8.030.Gets personally involved in recognizing people and celebrating accomplishmentsEncourage87.48.018.Asks "What can we learn?"Challenge87.38.017.Shows others how their interests can be realizedInspire77.38.027.Speaks with conviction about meaning of workInspire67.27.0Praises people for a job well doneEncourage67.18.0 Encourage57.1 8.0 6.Makes certain that people adhere to the principles and standards that have beenagreed upon8.7.5.15.Makes sure that people are creatively recognized for their contributions to the successof our projects10.Expresses confidence in people's abilitiesEncourage97.0 -7.0 -29.Ensures that people grow in their jobsEnable86.86.0 -12.Appeals to others to share dream of the futureInspire96.4 -6.0 -20.Recognizes people for commitment to shared valuesEncourage56.08.0 25.Tells stories of encouragement about the good work of othersEncourage65.98.0 16.Asks for feedback on how his/her actions affect people's performanceModel75.0 -7.0LEAST FREQUENT Copyright 2017 by James M. Kouzes and Barry Z. Posner. Published by The Leadership Challenge, A Wiley Brand. All rights reserved. www.leadershipchallenge.com.LPI INDIVIDUAL REPORTPAGE 5
Profile for Amanda LopezSample AssessmentMay 1, 2017Model the Way Data SummaryClarify values by finding your voice and affirming shared valuesSet the example by aligning actions with shared valuesThis page shows the responses for each of the six leadership behaviors related to this Practice. The Self column shows the responsesyou gave yourself for each behavior. The AVG column shows the averages of the Observers responses. The Individual Observerscolumns show each Observers response for each behavioral item. Responses can range from 1-Almost Never to 10-Almost Always.SELF AVGM1D1INDIVIDUAL OBSERVERSD2 D3 D4 C1 C2C3O11.Sets a personal example ofwhat is expected108.710101095888106.Makes certain that peopleadhere to the principles andstandards that have beenagreed upon98.1891084988911. Follows through on promisesand commitments109.01091010688101016. Asks for feedback on how his/her actions affect people'sperformance75.076761555321. Builds consensus aroundorganization's values97.488995967626. Is clear about his/herphilosophy of leadership87.6899848778RESPONSE SCALEM-Manager1-Almost Never3-Seldom5-Occasionally7-Fairly Often9-Very Frequently2-Rarely4-Once in a While6-Sometimes8-Usually10-Almost alwaysD-Direct ReportC-Co-WorkerO-OtherS-SelfAVG-Average of all Observer Responses Copyright 2017 by James M. Kouzes and Barry Z. Posner. Published by The Leadership Challenge, A Wiley Brand. All rights reserved. www.leadershipchallenge.com.LPI INDIVIDUAL REPORTPAGE 6
Profile for Amanda LopezSample AssessmentMay 1, 2017Model the Way Bar GraphsClarify values by finding your voice and affirming shared valuesSet the example by aligning actions with shared valuesThe set of bar graphs for each of the six leadership behaviors related to this Practice provides a graphic representation of your and yourObservers' average responses for that behavior. By behavior, it shows the response for Self and the average response for each categoryof Observer. Average refers to the average response for all categories of Observers (including Manager). Responses can range from1-Almost Never to 10-Almost Always.1.6.Sets a personal example of what isexpectedS10AVG 8.7D8.5C8.0M 10.0O 10.0Makes certain that people adhere tothe principles and standards thathave been agreed uponSAVGDCMO11. Follows through on promises andcommitments16. Asks for feedback on how his/heractions affect people's performanceSAVGDCMO75.05.05.07.03.021. Builds consensus aroundorganization's valuesSAVGDCMO97.47.87.38.06.026. Is clear about his/her philosophy 891001234567891098.17.88.38.09.0S10AVG 9.0D8.8C8.7M 10.0O 10.0RESPONSE SCALE01-Almost Never3-Seldom5-Occasionally7-Fairly Often9-Very Frequently2-Rarely4-Once in a While6-Sometimes8-Usually10-Almost alwaysD-Direct ReportC-Co-WorkerO-OtherS-SelfAVG-Average of all Observer Responses Copyright 2017 by James M. Kouzes and Barry Z. Posner. Published by The Leadership Challenge, A Wiley Brand. All rights reserved. www.leadershipchallenge.com.LPI INDIVIDUAL REPORTPAGE 7
Profile for Amanda LopezSample AssessmentMay 1, 2017Inspire a Shared Vision Data SummaryEnvision the future by imagining exciting and ennobling possibilitiesEnlist others in a common vision by appealing to shared aspirationsThis page shows the responses for each of the six leadership behaviors related to this Practice. The Self column shows the responsesyou gave yourself for each behavior. The AVG column shows the averages of the Observers responses. The Individual Observerscolumns show each Observers response for each behavioral item. Responses can range from 1-Almost Never to 10-Almost Always.SELF AVGM1D1INDIVIDUAL OBSERVERSD2 D3 D4 C1 C2C3O12.Talks about future trendsinfluencing our work108.6109910688897.Describes a compelling imageof the future77.889895887812. Appeals to others to sharedream of the future96.466774777717. Shows others how theirinterests can be realized77.387795876922. Paints "big picture" of groupaspirations67.989895869927. Speaks with conviction aboutmeaning of work67.27991066657RESPONSE SCALEM-Manager1-Almost Never3-Seldom5-Occasionally7-Fairly Often9-Very Frequently2-Rarely4-Once in a While6-Sometimes8-Usually10-Almost alwaysD-Direct ReportC-Co-WorkerO-OtherS-SelfAVG-Average of all Observer Responses Copyright 2017 by James M. Kouzes and Barry Z. Posner. Published by The Leadership Challenge, A Wiley Brand. All rights reserved. www.leadershipchallenge.com.LPI INDIVIDUAL REPORTPAGE 8
Profile for Amanda LopezSample AssessmentMay 1, 2017Inspire a Shared Vision Bar GraphsEnvision the future by imagining exciting and ennobling possibilitiesEnlist others in a common vision by appealing to shared aspirationsThe set of bar graphs for each of the six leadership behaviors related to this Practice provides a graphic representation of your and yourObservers' average responses for that behavior. By behavior, it shows the response for Self and the average response for each categoryof Observer. Average refers to the average response for all categories of Observers (including Manager). Responses can range from1-Almost Never to 10-Almost Always.Talks about future trends influencingour workS10AVG 8.6D8.5C8.0M 10.0O9.0Describes a compelling image of thefutureSAVGDCMO77.87.87.78.08.012. Appeals to others to share dream ofthe futureSAVGDCMO96.46.07.06.07.017. Shows others how their interests canbe realizedSAVGDCMO77.37.07.08.09.022. Paints "big picture" of groupaspirationsSAVGDCMO67.97.87.78.09.027. Speaks with conviction aboutmeaning of workSAVGDCMO67.28.55.77.07.02.7.RESPONSE 0123456789100123456789100123456789101-Almost Never3-Seldom5-Occasionally7-Fairly Often9-Very Frequently2-Rarely4-Once in a While6-Sometimes8-Usually10-Almost alwaysD-Direct ReportC-Co-WorkerO-OtherS-SelfAVG-Average of all Observer Responses Copyright 2017 by James M. Kouzes and Barry Z. Posner. Published by The Leadership Challenge, A Wiley Brand. All rights reserved. www.leadershipchallenge.com.LPI INDIVIDUAL REPORTPAGE 9
Profile for Amanda LopezSample AssessmentMay 1, 2017Challenge the Process Data SummarySearch for opportunities by seizing the initiative and by looking outward for innovative ways toimproveExperiment and take risks by constantly generating small wins and learning from experienceThis page shows the responses for each of the six leadership behaviors related to this Practice. The Self column shows the responsesyou gave yourself for each behavior. The AVG column shows the averages of the Observers responses. The Individual Observerscolumns show each Observers response for each behavioral item. Responses can range from 1-Almost Never to 10-Almost Always.SELF AVGM1D1INDIVIDUAL OBSERVERSD2 D3 D4 C1 C2C3O13.Seeks challengingopportunities to test skills108.99101095999108.Challenges people to try newapproaches97.981010836971013. Actively searches forinnovative ways to improvewhat we do88.28101095995918. Asks "What can we learn?"87.3868848771023. Identifies measurablemilestones that keep projectsmoving forward108.478101069810828. Takes initiative in anticipatingand responding to change98.4910101067969RESPONSE SCALEM-Manager1-Almost Never3-Seldom5-Occasionally7-Fairly Often9-Very Frequently2-Rarely4-Once in a While6-Sometimes8-Usually10-Almost alwaysD-Direct ReportC-Co-WorkerO-OtherS-SelfAVG-Average of all Observer Responses Copyright 2017 by James M. Kouzes and Barry Z. Posner. Published by The Leadership Challenge, A Wiley Brand. All rights reserved. www.leadershipchallenge.com.LPI INDIVIDUAL REPORTPAGE 10
Profile for Amanda LopezSample AssessmentMay 1, 2017Challenge the Process Bar GraphsSearch for opportunities by seizing the initiative and by looking outward for innovative ways toimproveExperiment and take risks by constantly generating small wins and learning from experienceThe set of bar graphs for each of the six leadership behaviors related to this Practice provides a graphic representation of your and yourObservers' average responses for that behavior. By behavior, it shows the response for Self and the average response for each categoryof Observer. Average refers to the average response for all categories of Observers (including Manager). Responses can range from1-Almost Never to 10-Almost Always.3.Seeks challenging opportunities totest skillsS10AVG 8.9D8.5C9.0M9.0O 10.08.Challenges people to try newapproachesS9AVG 7.9D7.8C7.3M8.0O 10.013. Actively searches for innovative waysto improve what we doSAVGDCMO18. Asks "What can we learn?"S8AVG 7.3D6.5C7.3M8.0O 10.023. Identifies measurable milestones thatkeep projects moving forwardSAVGDCMO108.48.59.07.08.028. Takes initiative in anticipating andresponding to changeSAVGDCMO98.49.07.39.09.0RESPONSE .01-Almost Never3-Seldom5-Occasionally7-Fairly Often9-Very Frequently2-Rarely4-Once in a While6-Sometimes8-Usually10-Almost alwaysD-Direct ReportC-Co-WorkerO-OtherS-SelfAVG-Average of all Observer Responses Copyright 2017 by James M. Kouzes and Barry Z. Posner. Published by The Leadership Challenge, A Wiley Brand. All rights reserved. www.leadershipchallenge.com.LPI INDIVIDUAL REPORTPAGE 11
Profile for Amanda LopezSample AssessmentMay 1, 2017Enable Others to Act Data SummaryFoster collaboration by building trust and facilitating relationshipsStrengthen others by increasing self-determination and developing competenceThis page shows the responses for each of the six leadership behaviors related to this Practice. The Self column shows the responsesyou gave yourself for each behavior. The AVG column shows the averages of the Observers responses. The Individual Observerscolumns show each Observers response for each behavioral item. Responses can range from 1-Almost Never to 10-Almost Always.SELF AVGM1D1INDIVIDUAL OBSERVERSD2 D3 D4 C1 C2C3O14.Develops cooperativerelationships88.4891010688989.Actively listens to diversepoints of view98.2981095879914. Treats people with dignity andrespect109.6109101071010101019. Involves people in thedecisions that directly impacttheir job performance87.9891085877924. Gives people choice about howto do their work108.199995689929. Ensures that people grow intheir jobs86.8657848779RESPONSE SCALEM-Manager1-Almost Never3-Seldom5-Occasionally7-Fairly Often9-Very Frequently2-Rarely4-Once in a While6-Sometimes8-Usually10-Almost alwaysD-Direct ReportC-Co-WorkerO-OtherS-SelfAVG-Average of all Observer Responses Copyright 2017 by James M. Kouzes and Barry Z. Posner. Published by The Leadership Challenge, A Wiley Brand. All rights reserved. www.leadershipchallenge.com.LPI INDIVIDUAL REPORTPAGE 12
Profile for Amanda LopezSample AssessmentMay 1, 2017Enable Others to Act Bar GraphsFoster collaboration by building trust and facilitating relationshipsStrengthen others by increasing self-determination and developing competenceThe set of bar graphs for each of the six leadership behaviors related to this Practice provides a graphic representation of your and yourObservers' average responses for that behavior. By behavior, it shows the response for Self and the average response for each categoryof Observer. Average refers to the average response for all categories of Observers (including Manager). Responses can range from1-Almost Never to 10-Almost Always.4.9.Develops cooperative relationshipsSAVGDCMO88.48.88.38.08.0Actively listens to diverse points ofviewSAVGDCMO98.28.08.09.09.014. Treats people with dignity andrespectS10AVG 9.6D9.0C10.0M 10.0O 10.019. Involves people in the decisions thatdirectly impact their job performanceSAVGDCMO87.98.07.38.09.024. Gives people choice about how to dotheir workSAVGDCMO108.18.07.79.09.029. Ensures that people grow in their jobsSAVGDCMO86.86.07.36.09.0RESPONSE 0123456789100123456789100123456789101-Almost Never3-Seldom5-Occasionally7-Fairly Often9-Very Frequently2-Rarely4-Once in a While6-Sometimes8-Usually10-Almost alwaysD-Direct ReportC-Co-WorkerO-OtherS-SelfAVG-Average of all Observer Responses Copyright 2017 by James M. Kouzes and Barry Z. Posner. Published by The Leadership Challenge, A Wiley Brand. All rights reserved. www.leadershipchallenge.com.LPI INDIVIDUAL REPORTPAGE 13
Profile for Amanda LopezSample AssessmentMay 1, 2017Encourage the Heart Data SummaryRecognize contributions by showing appreciation for individual excellenceCelebrate the values and victories by creating a spirit of communityThis page shows the responses for each of the six leadership behaviors related to this Practice. The Self column shows the responsesyou gave yourself for each behavior. The AVG column shows the averages of the Observers responses. The Individual Observerscolumns show each Observers response for each behavioral item. Responses can range from 1-Almost Never to 10-Almost Always.SELF AVG5.Praises people for a job welldoneM1D1INDIVIDUAL OBSERVERSD2 D3 D4 C1 C2C3O167.187675968810. Expresses confidence inpeople's abilities97.076786767915. Makes sure that people arecreatively recognized for theircontributions to the success ofour projects57.185510410105720. Recognizes people forcommitment to shared values56.086563945825. Tells stories of encouragementabout the good work of others65.986673565730. Gets personally involved inrecognizing people andcelebrating accomplishments87.4866959699RESPONSE SCALEM-Manager1-Almost Never3-Seldom5-Occasionally7-Fairly Often9-Very Frequently2-Rarely4-Once in a While6-Sometimes8-Usually10-Almost alwaysD-Direct ReportC-Co-WorkerO-OtherS-SelfAVG-Average of all Observer Responses Copyright 2017 by James M. Kouzes and Barry Z. Posner. Published by The Leadership Challenge, A Wiley Brand. All rights reserved. www.leadershipchallenge.com.LPI INDIVIDUAL REPORTPAGE 14
Profile for Amanda LopezSample AssessmentMay 1, 2017Encourage the Heart Bar GraphsRecognize contributions by showing appreciation for individual excellenceCelebrate the values and victories by creating a spirit of communityThe set of bar graphs for each of the six leadership behaviors related to this Practice provides a graphic representation of your and yourObservers' average responses for that behavior. By behavior, it shows the response for Self and the average response for each categoryof Observer. Average refers to the average response for all categories of Observers (including Manager). Responses can range from1-Almost Never to 10-Almost Always.Praises people for a job well doneSAVGDCMO67.16.37.78.08.010. Expresses confidence in people'sabilitiesSAVGDCMO97.06.86.77.09.015. Makes sure that people are creativelyrecognized for their contributions tothe success of our projectsSAVGDCMO57.16.08.38.07.020. Recognizes people for commitment toshared valuesSAVGDCMO56.05.06.08.08.025. Tells stories of encouragement aboutthe good work of othersSAVGDCMO65.95.55.38.07.030. Gets personally involved inrecognizing people and 5.RESPONSE 0123456789100123456789100123456789101-Almost Never3-Seldom5-Occasionally7-Fairly Often9-Very Frequently2-Rarely4-Once in a While6-Sometimes8-Usually10-Almost alwaysD-Direct ReportC-Co-WorkerO-OtherS-SelfAVG-Average of all Observer Responses Copyright 2017 by James M. Kouzes and Barry Z. Posner. Published by The Leadership Challenge, A Wiley Brand. All rights reserved. www.leadershipchallenge.com.LPI INDIVIDUAL REPORTPAGE 15
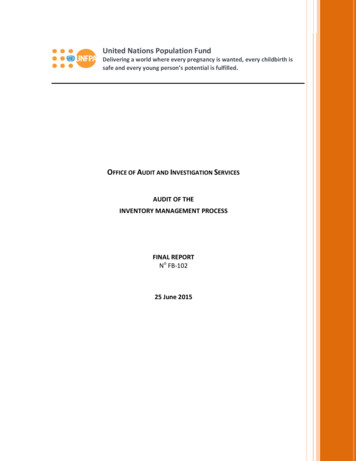
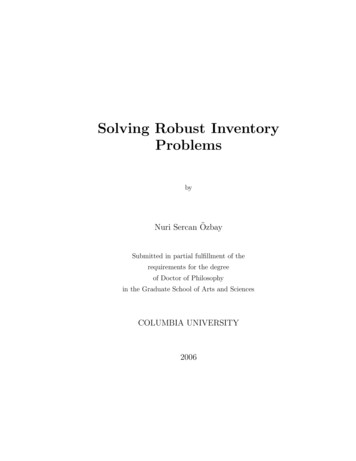
Profile for Amanda LopezSample AssessmentMay 1, 2017Percentile RankingThe leaders and observers who make up the LPI database include a mix of males and females at all levels, from all types oforganizations, and from all over the world. This page compares your Self responses and those of your Observers to all Observerresponses for other leaders who have taken the LPI. The horizontal lines at the 30th and 70th percentiles divide the graph into threesegments, roughly approximating a normal distribution of scores. Each line on the graph shows what percentile your Self or anObserver category response falls into for each Practice. For example, if your Self score for Model the Way is at the 50th percentile, halfof the leaders in the database were rated higher by their Observers on the Practice, and half were rated lower.MOST FREQUENT100MODELTHE WAYINSPIRE ASHARED VISIONCHALLENGETHE PROCESSENABLEOTHERS TO ACTENCOURAGETHE HEART908070FREQUENT605040LEAST FREQUENT3020100SelfManagerDirect ReportCo-WorkerOtherAverage of all Observers Copyright 2017 by James M. Kouzes and Barry Z. Posner. Published by The Leadership Challenge, A Wiley Brand. All rights reserved. www.leadershipchallenge.com.LPI INDIVIDUAL REPORTPAGE 16
The Five Practices of Exemplary Leadership Created by James M. Kouzes and Barry Z. Posner in the early 1980s and first identified in their internationally best-selling book,The Leadership Challenge, The Five Practices of Exemplary Leadership approaches leadership as