Transcription
Movement with the Moon: White-tailed Deer Activity and Solunar EventsJeffery D. Sullivan, School of Forestry and Wildlife Sciences, Auburn University, 602 Duncan Drive, Auburn, AL 36849Stephen S. Ditchkoff, School of Forestry and Wildlife Sciences, Auburn University, 602 Duncan Drive, Auburn, AL 36849Bret A. Collier, School of Renewable Natural Resources, Louisiana State University Agricultural Center, Baton Rouge, LA 70803Charles R. Ruth, South Carolina Department of Natural Resources, Columbia, SC 29201Joshua B. Raglin, Norfolk Southern Railway, Brosnan Forest, P.O. Box 27, Dorchester, SC 29437Abstract: White-tailed deer (Odocoileus virginianus) activity patterns are predominately crepuscular. However, the general populace believes that deeractivity is also influenced by lunar factors. This belief is demonstrated by the countless “solunar charts” claiming to provide peak periods of deer activity.While research has identified solar and lunar influences on behavioral patterns in some species, descriptions of solunar factors on white-tailed deer arerare. Our goal was to evaluate whether solunar charts can predict periods of increased activity in white-tailed deer. We used 38 adult male, white-taileddeer equipped with GPS collars programmed to collect locations every 30 minutes from August–December during 2010–2012. Deer were classified asactive or inactive based on total distance moved between consecutive GPS fixes. We used logistic regression to estimate the odds of activity dependenton solunar events. Based on our results, on those days furthest from the full or new moon, deer were less likely to be active during moonrise and moonset periods, and more likely to be active during moon overhead and moon underfoot periods. On days with greater proximity to the new or full moonthe probability of activity during moonrise and moonset periods increased from 0.384 (SE 0.005) to 0.564 (SE 0.010) and 0.403 (SE 0.005) to 0.591(SE 0.011), respectively, while decreasing during moon overhead and moon underfoot periods from 0.540 (SE 0.005) to 0.413 (SE 0.011) and 0.516(SE 0.005) to 0.305 (SE 0.010), respectively. Our data suggest events identified by solunar charts have some association with deer activity. However,the relationships between lunar events and lunar phase expressed in solunar charts may be misleading.Key words: solunar charts, white-tailed deer, hunting, deer movement, solunarJournal of the Southeastern Association of Fish and Wildlife Agencies 3:225–232Animal movements are influenced by a variety of factors ranging from physiological requirements to short term weather events(Ran et al. 2008). Lunar phase has been suggested to play a major role in movement patterns of all species, with multiple studiesdocumenting the influence of lunar phases and cycles on animalmovement patterns. For example, prey species such as the kangaroo rat (Dipodomys spectabilis; Daly et al. 1992) and snowshoe hare(Lepus americanus; Griffin et al. 2005) reduce nocturnal activityduring brightly illuminated nights, caused by the full moon, inan effort to decrease predation risk (Lima and Dill 1990, Sabatoet al. 2006). Similarly, reduced prey availability has been found todecrease predator activity in the maned wolf (Chrysocyon brachyurus; Sabato 2006) and white-throated round-eared bat (Lophostoma silvicolum; Lang et al. 2006). Although lunar phase and illumination impact daily activity patterns of many species, lunarphase also appears to influence activity in relation to key life history events. Examples include horseshoe crabs (Limulus polyphemus; Barlow et al. 1986) and various fish species (Takemura et al.2004) whose peak of breeding occurs near the full and new moons,along with Barau’s petrels (Pterodroma baraui) whose mean arriv-2016 JSAFWAal date to their breeding colony is closely associated with the fullmoon phase (Pinet et al. 2011). An additional lunar factor with thepotential to influence animal activity is the position of the moonin the sky. Though there is a paucity of research detailing the impact this factor has on animal movement, Brown (1954) found thatwhen removed from their tidal water bodies, oysters (Ostrea virginica) have daily activity peaks associated with moon overhead andmoon underfoot periods. However, a similar trend has yet to bedocumented in other organisms.The hunting public has come to believe that lunar factors influences animal movement patterns, and this is particularly apparentamong white-tailed deer (Odocoileus virginianus) hunters (Webbet al. 2010). While entirely anecdotal, this belief is perpetuatedvia regular discussion in the non-scientific (e.g., popular) literature (Taylor 1985, Alsheimer 1999, Couch 2014). One lunar factorcommonly believed to impact deer activity is lunar phase, althoughpeer-reviewed works have failed to document any association between lunar phase and white-tailed deer activity (Michael 1970,Zagata and Haugen 1974, Beier and McCullough 1990, Webb et al.2010). Hunters have also expressed a belief that the location of the225
White-tailed Deer Activity and Solunar Eventsmoon may influence deer activity, an idea popularized by John Alden Knight through his book, “Moon Up — Moon Down” (Knight1942). Within this text, Knight suggests that animal activity increases during periods of time around four solunar events: moonrise (RISE), moon set (SET), moon overhead (OVERHEAD), andmoon underfoot (UNDERFOOT). Today many companies provide products known as “solunar charts” based on Knight’s claims.These charts report periods of time that animals should be moreactive with windows around moon OVERHEAD and moon UNDERFOOT represented as major periods and moon RISE andmoon SET represented as minor periods. Though solunar chartsall appear to follow the same general trends suggested by Knight(1942), there tend to be minor variations between charts, such aspredicted periods differing in length by a half hour. Solunar chartsalso often report a ranking for each day based upon lunar phase(Roseberry and Woolf 1986), where days are ranked from 1–4 with4 being the period of the most predicted deer activity. The greaterthe proximity to the new or full moon, the closer to 4 that particular day’s rating will be. However, as with major and minor period prediction, there tends to be slight variation between solunarcharts regarding day rank. The relationship between lunar phaseand deer activity implied by this ranking system is not that deerwill increase total activity near the full and new moons, but insteadthat the position of the moon in relation to the sun during thesephases magnifies the effect of solunar periods, leading to increasedactivity during the predicted windows (Knight 1942).While solunar charts tend to be very popular within the deerhunting community, there has only been one published study (Roseberry and Woolf 1986) that evaluated the validity of solunar charts.Roseberry and Wolfe (1986) found that during fall, deer were moreactive on days with higher ratings than on poorly rated days, yetthis trend was not seen during winter. Roseberry and Woolf (1986)also reported that deer were not found to be significantly moreactive within the solunar periods they observed than during nonsolunar periods for either season. However, the data were collectedusing visual observations of unmarked deer; thus there is the potential for more advanced technology to detect patterns that werenot apparent to the naked eye. In order to evaluate the relationship between solunar events and deer activity patterns we collectedGPS data on white-tailed deer activity patterns to compare thesepatterns to lunar events and phases. Our specific objectives were todetermine if: (1) deer display elevated activity during the periodsof time surrounding lunar events identified in solunar charts, and(2) deer display elevated activity during predicted periods withhigher rankings. If the relationships with lunar position and lunarphase suggested by solunar charts accurately predict deer activity, then activity rates should be greater during predicted windows2016 JSAFWASullivan et al.226than surrounding windows, and activity rates should be greateston highly ranked days.MethodsStudy AreaOur research was conducted at Brosnan Forest, a 5,830 ha tractof lower coastal plain habitat in Dorchester County, South Carolina (33.08591 N, 80.25726 W). This project took place exclusivelyon the 2,552-ha portion of the property located north of Highway78. Approximately 93% forested, the study area contained mostly open longleaf pine (Pinus palustris) stands interspersed withmixed hardwoods (Collier et al. 2007). As the area was historicallyswampy prior to drainage, hardwood drains were found throughout the property. Mixed pine-hardwood areas were comprised ofloblolly (Pinus taeda), slash (Pinus elliottii), and pond (Pinus serotina) pine, along with oak (Quercus spp.), sweetgum (Liquidambar styraciflua), and red maple (Acer rubrum). Bottomland drainsincluded oak, sweetgum, black gum (Nyssa sylvatica), and yellowpoplar (Liriodendron tulipifera). The majority of forest stands wereactively managed for timber production, and burned on a 2–3 yearrotation, maintaining an open understory (Lauerman 2007, Collier et al. 2007). Food plots on the study area ranged in size from0.16 to 9.1 ha, and comprised a total of 126 ha. These plots wereplanted annually with a cool season mix of various clovers (Trifolium spp.), grains (oats, Avena fatua; wheat, Triticum aestivum;rye, Secale cereale), chicory (Cichorium intybus), and winter peas(Pisum sativum) (McCoy 2013). There were also 59 feeders distributed throughout the study area dispensing protein pellets during winter and shelled corn during the hunting season, which ranfrom 15 August–1 January.CaptureDuring May-August of 2009–2011 a total of 38 male whitetailed deer (ranging from 1 to 4 years, with a nearly uniform distribution) were immobilized via a 2-cc transmitter dart (Pneu-dartInc., Williamsport, Pennsylvania) containing a Xylazine (LloydLaboratories, Shenandoah, Iowa; 100mg/ml given at a rate of 2.2mg/kg) and Telazol (Fort Dodge Animal Health, Fort Dodge, Iowa;100mg/ml given at a rate of 4.5 mg/kg) mixture. Deer were fittedwith an ATS G2110D GPS Collar (Advanced Telemetry Systems,Isanti, Minnesota) tightened to within approximately two fingerwidths of the neck, allowing the collar to stay in the proper upright position and improving data accuracy (D’Eon and Delaparte2005). After processing was complete a 3-ml intramuscular injection of Tolazoline (Lloyd Laboratories, Shenandoah, Iowa; 100mg/ml given at a rate of 6.6 mg/kg) was administered to act as a reversal to the Xylazine/Telazol mixture, and deer were observed until
White-tailed Deer Activity and Solunar Eventsthey moved away under their own power. All protocols involvinganimals were approved by the Auburn University Animal Care andUse Committee (PRN# 2008-1489).Data Collection and ManipulationGPS collars were programmed to take fixes at 30-minute intervals from 23 August–23 November, recording position in UTM coordinates, date, time, altitude, fix status, satellites, position dilutionof precision (PDOP), horizontal dilution of precision (HDOP), andtemperature with each fix. Collars automatically fell off the deer atthe end of the study period and were collected via radio telemetry.Data were offloaded using ATS WinCollar software, and likely erroneous 3-dimensional fixes with PDOP 10 or HDOP 6 and 2-dimensional fixes with HDOP 3 were removed (D’Eon and Delparte2005, Lewis et al. 2007).Following the lunar data acquisition method of Webb et al.(2010), the times of three lunar events, moon rise, moon set, andmoon overhead, along with sunrise and sunset were downloadedfrom the naval observatory website, for Summerville, South Carolina ( 20 miles from the study site). As the fourth lunar event,moon underfoot, was not reported, this event was estimated as halfway between moonset and moonrise. Any events reported in daylight savings time were converted to standard time so as to maintain consistency across datasets. Times were then set to match thenearest half hour interval of the GPS fix schedule, and three hoursbefore and after every solunar event were denoted in half hourincrements. Similar windows, lasting only 1.5 hours before until1.5 hours after, were built around sunrise and sunset. All pointswere classified as taking place during either the day or night, withday representing times within legal hunting hours. Additionally,the ranking for each day as reported by Solunar Forecast (2015) apopular online solunar chart, was applied to each GPS location using a scale of 1–4, with 4 representing the highest rated days. Givenproximity to the new and full moons is the primary driver behindday rank, changes in activity corresponding to an increase in dayrank can be interpreted as the result of increasing proximity to thenew and full moons. As there are only minor differences betweenthe numerous solunar charts available, the ranking system fromthis single chart was sufficient to represent the ranking systemused in all solunar charts.To determine locational error, three collars were deployed forfive days at the end of the research period among various habitat types found within the study site: an immature pine stand, amature pine stand, and a mature hardwood stand. Collars wereplaced approximately 1 m above the ground, the neck height of astanding deer (Frair et al. 2010), with the antenna pointing directlyupwards (Lewis et al. 2007, D’Eon and Delparte 2005, Frair et al.2016 JSAFWASullivan et al.2272004). Coordinates for the deployment locations were taken witha Trimble GeoXT GPS unit, with all locations accurate to within 1m. As all collars were of the same model, the assumption was madethat each collar had comparable precision and that any variancebetween collars was habitat driven (Lewis et al. 2007). The Euclidean distance of each fix from its corresponding known location wascalculated (x̄ 12.95 m, SD 9.81 m) and the mean locational error was multiplied by 4 to determine a distance threshold of 51.78m. This threshold represented the minimum Euclidean distancebetween consecutive fixes to be certain that movement had occurred and was utilized to classify all consecutive fixes as active orinactive. This threshold meets the minimum necessary distance of5 error standard deviations suggested by Jerde and Visscher (2005)to be certain movement occurred. Activity was treated as a binary variable to allow examination of if activity rates changed surrounding solunar events. Treating this movement as a continuousvariable would suggest that an animal with further displacement ismore active than an animal browsing through an area and wouldreduce the ability to detect changes in activity rates.Data AnalysisWe developed nine candidate models, using varying predictedperiods of deer movement, for each of the four solunar events. Thepredicted periods ranged in duration from one hour before andone hour after to two hours before and two hours after the solunarevent being tested. The time remaining within the overall six-hourwindow surrounding each event was used as a bordering period.We used logistic regression to compare the odds of activity duringany 30-minute interval within the predicted window to the odds ofactivity during any 30-minute interval within the bordering times,using day rank as an interaction term. The only change betweenmodels was the length of the predicted period while the base model, activity predicted period predicted period * day rank, remained constant. The model with the lowest Akaike’s InformationCriterion (AICc) rank was the best fit for each of the four solunarevents (Burnham and Anderson 1998). We exponentiated the betaestimates to determine the comparative odds of activity during anygiven 30-minute interval within the predicted versus borderingperiods of each solunar event as day rank increased.The probability of activity during a given half hour interval alongwith its standard error was calculated for the predicted and bordering periods of each solunar event by day rank. Intervals which werenot classified due to missed fixes were excluded in the creation offit. Probability of activity during a given half hour interval was alsocalculated for five reference periods: the entirety of the study period(24-HOUR), half an hour before sunrise to half an hour after sunset(DAY), half an hour after sunset until half an hour before sunrise
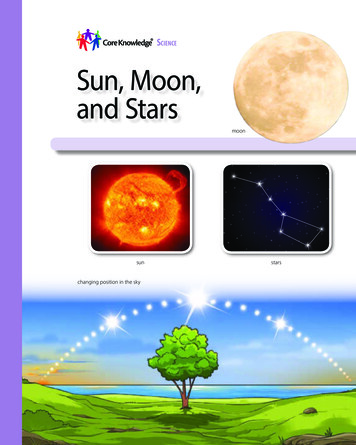
White-tailed Deer Activity and Solunar Events(NIGHT), 1.5 hours before until 1.5 hours after sunrise (SUNRISE), and 1.5 hours before until 1.5 hours after sunset (SUNSET).All analysis was conducted in R (R Core Development Team 2015).ResultsThe 38 collars deployed throughout the experiment had an average fix rate, after data censoring, of 81.54% (n 153,077) whileTable 1. Candidate models, number of model parameters (K), Akaike’s Information Criterion (AICc ),and associated model ranks (ΔAICc ) and model weights (wi) used to predict periods of peak malewhite-tailed deer activity surrounding moonrise, moonset, moon overhead, and moon underfoot atBrosnan Forest, South Carolina.Solunar eventHoursbefore aHoursafter .01.02.02.01.52.01.01.51.01.51.0Δ ntMoonriseMoonsetMoon overheadMoon underfootKAICca. The length of time prior to the solunar event included in the window of predicted activityb. The length of time after the solunar event included in the window of predicted activity2016 JSAFWASullivan et al.228the stationary collars had an average fix rate of 99.87% (n 792).Our model selection results indicated that the period from 2 hoursbefore until 1.5 hours after moon RISE was the best fitting model,given the data, while the periods from 2 hours before until 1 hourafter were the best fitting models, given the data, for moon SET,moon OVERHEAD, and moon UNDERFOOT (Table 1; Table2). The probability of activity during any given half hour intervalthroughout our study period was 0.465 (SE 0.003, n 124,825),and remained nearly constant as day rank increased from 1 to4 (Figure 1). This consistency across day rank was also seen forthe probabilities of activity during the night, day, sunrise, andsunset, which had values of 0.596 (SE 0.004, n 58,576), 0.348(SE 0.003, n 66,249), 0.578 (SE 0.007, n 17,635), and 0.634(SE 0.007, n 18,090), respectively.Deer were 2.351 (CI 2.208–2.494) and 2.806 (CI 2.666–2.946) times as likely to move during any half hour interval of thepredicted versus bordering periods, as determined by the best fitmodel, surrounding moon RISE and moon SET, respectively, on4-star days as they were during 1-star days (Table 3). However,Table 2. The coefficient estimates of the top model used to predict periods of peak male white-taileddeer activity surrounding moonrise, moonset, moon overhead, and moon underfoot, respectively, formale white-tailed deer at Brosnan Forest, South Carolina.CoefficientPredicted PeriodDay Rank 2Day Rank 3Day Rank 4Predicted Period*Day Rank 2Predicted Period*Day Rank 3Predicted Period*Day Rank –0.585–0.387–0.547–0.300Table 3. The comparative likelihood of activity within predicted solunar periods versuscorresponding bordering periods as interacted with day rank for male white-tailed deer at BrosnanForest, South Carolina.Day 550.0790.0600.0730.001 0.001 0770.0580.0720.221 0.001 0.0010.9101.5972.806Moon overhead234–0.559–0.457–0.3350.0800.0590.072 0.001 0.001 0.0010.5720.6330.715Moon 5 0.001 0.001 0.0010.6790.5790.741Solunar eventa. Likelihood represents the exponentiated effect estimate provided by logistic regression, comparinglikelihood of activity during any half hour interval to the same event with a day rank of 1
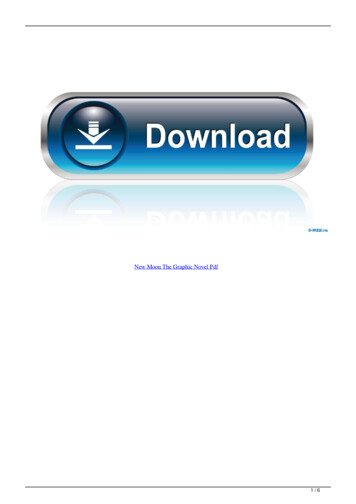
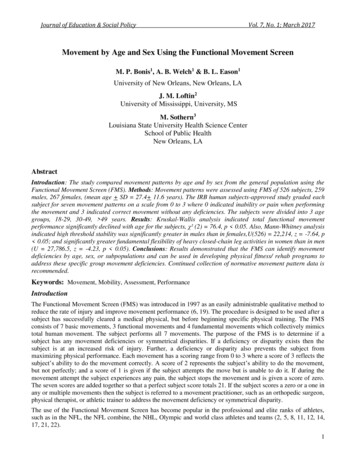
White-tailed Deer Activity and Solunar EventsSullivan et al.229Figure 1. The probability of white-tailed deer activity during any half hour interval within five periods: the entire study period,day, night, around sunrise (1.5 hours before until 1.5 hours after), and around sunset (1.5 hours before until 1.5 hours after) atBrosnan Forest, South Carolina. Error bars represent one standard error.for the predicted versus bordering periods surrounding moonOVERHEAD and moon UNDERFOOT, deer were only 0.715(CI 0.575–856) and 0.741 (CI 0.595–0.887) times as likely, respectively, to be active on 4-star days compared to 1-star days.As day rank increased from 1 to 4, probability of activity duringany half hour interval of the predicted moon RISE and moon SETperiods increased from 0.384 (SE 0.005, n 11,458) and 0.4032016 JSAFWA(SE 0.005, n 10,321) to 0.564 (SE 0.010, n 2,992) and 0.591(SE 0.011, n 2,095), respectively, while decreasing during moonOVERHEAD and moon UNDERFOOT predicted periods from0.540 (SE 0.005, n 10,656) and 0.516 (SE 0.005, n 10,793) to0.413 (SE 0.011, n 1,907) and 0.305 (SE 0.010, n 1,987), respectively (Figure 2).
White-tailed Deer Activity and Solunar EventsSullivan et al.230Figure 2. The probability of white-tailed deer activity during any half hour interval within the predicted windows for each solunar eventat Brosnan Forest, South Carolina. Error bars represent one standard error.DiscussionOur data suggest that there is a varied relationship betweenmale white-tailed deer activity, solunar events, and moon phase.This relationship is characterized by two distinct trends; deer become more active during the periods predicted by the best fit model for moon RISE and moon SET, and less active during the predicted periods for moon OVERHEAD and moon UNDERFOOT,as proximity to the new and full moons becomes greater. This canbe summarized as a positive relationship between deer activity andproximity to the new and full moon during moon RISE and moonSET and a negative relationship between proximity to the new andfull moon and deer activity during moon OVERHEAD and moonUNDERFOOT. A relationship between the position of the moonin the sky and animal activity had previously only been documented in oysters (Ostrea virginica; Brown 1954). Brown (1954)found that following removal from tidal waterways, oysters would2016 JSAFWAexpress peaks in feeding activity when the moon was directly overhead and underfoot, and documented that these peaks increasedin intensity during the new and full moons. In concurrence withBrown (1954), our study also documented change in the intensityof activity surrounding moon OVERHEAD and moon UNDERFOOT periods associated with change in proximity to the new andfull moons. However, while oyster activity during these solunarevents had a positive association with the new and full moons,deer activity had a negative association.While supported by the data collected in this study and previous findings in oysters, the observance of a relationship betweenwhite-tailed deer activity and solunar events contradicts the results of a previous study with white-tailed deer. Roseberry andWoolf (1986), observed deer on Crab Orchard National WildlifeRefuge at 15-minute intervals during diurnal hours from elevatedstands. They found no difference in deer activity during the periods of time surrounding solunar events versus non-solunar peri-
White-tailed Deer Activity and Solunar Eventsods. However, the results reported by Roseberry and Woolf (1986)may have been influenced by data collection methods, as they wereonly able to observe deer during daylight hours and were limited tocollecting data from deer that were visible. Due to GPS technology,we were able to continuously document deer activity regardless oftheir location on the study area or the time of day. Roseberry andWoolf (1986) also failed to take moon phase into account, potentially allowing cyclical changes which could average out over thecourse of a month to be masked.While the data from our research found relationships betweendeer activity and lunar factors that had previously not been documented, other trends observed in our data corroborated deer activity patterns that had previously been documented. Deer activityduring day, night, around sunrise, around sunset, and throughoutthe entire 24-hour period did not seem to be affected by proximityto the new or full moon. Though our study focused on proximity tothe new and full moon and categorized days accordingly, Webb etal. (2010) categorized moon phase as either new, crescent, quarter,gibbous, or full. Even with this approach, no difference in overallactivity was found for male or female white-tailed deer in relationto moon phase, a conclusion supported by other previous studies(Michael 1970, Zagata and Haugen 1974, Beier and McCullough1990). Interestingly, peak values associated with the probabilityof activity for each solunar event were most comparable with theprobability of activity found around sunrise. Deer have a greaterprobability of activity during the respective peaks of each solunar event than during any given half hour interval during diurnalhours, while still being less active than during the period surrounding sunset. This indicates that while deer do have increased activityrates during various solunar periods as a function of moon phase,the crepuscular hours surrounding sunset appear to be when deerare most likely to be active, which was already commonly accepted(Beier and McCullough 1990, Webb et al. 2010).Although we detected relationships between solunar events andwhite-tailed deer activity, there are problems with the manner inwhich solunar charts express the relationship between deer activity,solunar events, and moon phase. A primary concern with solunarcharts is found in the conflicting relationships with moon phasebetween solunar events. The existence of these conflicting trendssuggests that the day ranking system currently used by solunarchart producers is not an effective predictor of deer activity, as itonly correctly identifies peak periods of activity for moon RISEand moon SET. In contrast, peak periods of activity associatedwith moon OVERHEAD and moon UNDERFOOT are not wellpredicted by day rank. As a result, solunar charts will have a naturaltendency to accurately predict periods of activity only half the time.A second, but perhaps less fundamental issue with solunar charts is2016 JSAFWASullivan et al.231that classifying moon RISE and moon SET as minor periods whileclassifying moon OVERHEAD and moon UNDERFOOT as major periods is misleading. The greatest probabilities of activity formoon RISE and moon SET, which occurred on days closest to thenew and full moon, were actually greater than the peak values formoon OVERHEAD and moon UNDERFOOT, which occurred ondays furthest from the new and full moon. These differences suggest that solunar chart developers need to reconsider their use ofday rankings.Our findings should not be interpreted as suggesting that deerhave increased susceptibility to hunter harvest during solunar periods, as increased activity does not necessarily increase a deer’svulnerability to harvest. While a deer may increase its activity during predicted solunar periods, it may remain in areas that are notaccessible to hunters or it may avoid permanent hunting stand locations, a behavior which has been documented in studies of deerbehavior during the hunting season (Pilcher and Wampler 1981,Naugle et al. 1997, Kilgo et al. 1998, Kilpatrick et al. 2002, Rhoadset al. 2013). Additionally, our research focused solely on examining relationships between activity (e.g., a deer changed locationsduring a 30-minute period) and lunar periods commonly definedin solunar charts. We examined these relationships only during aperiod that included both the breeding season and hunting season on our study area. It is possible that the propensity for deerto be active during these defined periods may vary with season,environmental factors, habitat, and hunting pressure. Finally, as weonly examined data for males, it is possible that females display differing patterns of activity.AcknowledgmentsThis research was supported by the South Carolina Departmentof Natural Resources, and Norfolk Southern Railway—BrosnanForest. We thank J.C. McCoy, J.M. Smith, and staff at Brosnan Forest for their assistance with data collection throughout the study.Literature CitedAlsheimer, C. J. 1999. Hunting whitetails by the moon. Krause Publications,Iola, Wisconsin.Barlow, R.B., M. K. Powers, H. Howard, and L. Kass. 1986. Migration of Limulus for mating: relation to lunar phase, tide height, and sunlight. Biological Bulletin 171:310–329.Beier, P. and D. R. McCullough. 1990. Factors influencing white-tailed deeractivity patterns and habitat use. Wildlife Monographs 109:1–51.Burnham, K.P. and D. R. Anderson. 1998. Model selection and multimodelinference. Springer, New York, New York.Brown, F.A. 1954. Persistent activity rhythms in
the relationships between lunar events and lunar phase expressed in solunar charts may be misleading. Key words: solunar charts, white-tailed deer, hunting, deer movement, solunar Journal of the Southeastern Association of Fish and Wildlife Agencies 3:225-232 Animal movements are inluenced by a variety of factors rang-