Transcription
DRIVINGPERFORMANCE2021 FULL YEAR RESULTS
AGENDAPageIntroduction3Highlights7Portfolio Review10Market Outlook21Summary24Appendix26URBAN LOGISTICS 2021 FULL YEAR RESULTS2
INTRODUCTIONA highly experienced logistics investment management teamRICHARD MOFFITTCEOCHRISTOPHER TURNERASSET MANAGERFormer Head of UK Industrial and Logistics at CBREQualified Chartered SurveyorTotal of 25 years of Logistics market experience.25 years of experience in acquisition, performanceand disposal of investmentsExperience includes: Qualified as Chartered Surveyor 1988CBRE Head of Industrial and Logistics 2010-2015Experience includes: Co-Founder M3 Agency 2000-2010 (specialistlogistics consultancy) Chairman European Logistics Real Estate Partners2018-present Member Chartered Institute of Logistics andTransport URBAN LOGISTICS 2021 FULL YEAR RESULTSAcquired, managed and traded 175 million assetportfolioAcquired and repositioned 135 million industrialportfolio in GermanyFormerly Director of Hill Samuel InvestmentManagementFormerly Director and Head of Asset Managementat Lambert Smith Hampton3
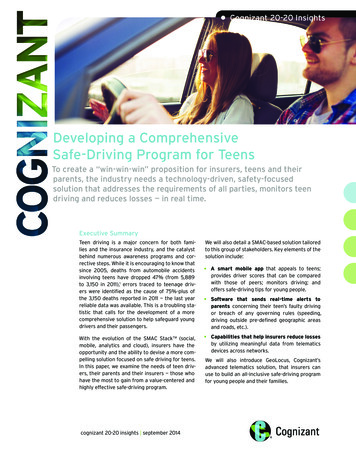
URBAN LOGISTICS REIT PLCA pure play on urban logistics UK REIT quoted on the AIM market of the London StockExchangeIncome and Total Return strategy through active assetmanagementDIFFERENTIATORSFOCUS ON “LAST MILE”20,000-200,000 sq.ft Most appropriate size for last-mile delivery operatorsInvests in mid-box logistics buildings up to200,000 sq.ft.Assets located in key urban “last touch”/“last mile”locationsThe only London listed REIT with such a focusManagement team with specific logistics experiencewithin the broader real estate market13.9% p.a. average Total Accounting Return from IPOto 31 March 2021.STRATEGIC LOCATIONS31% South East bias¹ Area had among the strongest take-up of logistics spaceSTRONG COVENANTS89% low/low-moderate risk² Single-let assetsHigh-quality tenantsNo fashion retail1. Expressed as a percentage of capital value as at 31 March 20212. Per Dun & Bradstreet (Overall Business Risk) as at 3 May 2021URBAN LOGISTICS 2021 FULL YEAR RESULTS4
URBAN LOGISTICS REITHow we create value for our shareholders1BUY WELL2MANAGE WELL3PERFORM82 assetsacquired since IPO18 rent reviews and23 new lettings/re-gearscompleted in the year4.8%average disposal yieldon assets sold in the year6.4%average purchase yield onproperties acquired since IPO219% average LFL incomegrowth for rent reviewssettled in the year35% average premium to bookvalue on disposals in year30-70%replacement cost69% of valuation upliftachieved throughasset management in the year79%Total Property Return generatedfrom assets sold in the yearVALUE CREATION39.0%34.75p13.9%average EPRA NAV per sharegrowth paTotal dividends declaredaverage Total AccountingReturn pa1. Excluding forward funded developments2. The average purchase yield is based on headline purchase price, and excludes forward funded development assets3. Performance from IPO to 31 March 2021URBAN LOGISTICS 2021 FULL YEAR RESULTS5
URBAN LOGISTICS REITDriving performance through asset managementTotal Property Return (“TPR”)2Like for like increase in portfolio -20Asset managementMarket 21Driven by active management22%6%31%IncomeCapitalCAPITAL GROWTH ATTRIBUTEDTO ASSET MANAGEMENT3AVERAGE TPR PER ANNUM275%15%69%Mar-211. The like-for-like increase for the financial year ended 31 March 2021 includes 5 assets sold on 25 March 20212. Total Property Return is calculated as the capital growth in the portfolio, plus net rental income and profit or loss on the sale of investment properties expressed as a percentage return on the capital employedduring the year, however, this excludes acquisitions3. Performance from IPO to 31 March 2021URBAN LOGISTICS 2021 FULL YEAR RESULTS6
HIGHLIGHTSURBAN LOGISTICS 2021 FULL YEAR RESULTS7
FINANCIAL HIGHLIGHTSRobust balance sheet with earnings momentum into FY22 Net rental income of 22.9m for the year, representing anincrease of 88.0%, driven primarily from new acquisitionsGross to net rental income ratio of 96.5%Declared interim dividend of 4.35p for the six-months to31 March 2021EPRA Net Tangible Assets (NTA) per share of152.33p at 31 March 2021, an increase of 10.5% from31 March 2020Successfully completed two new loan facilities in theyear totalling 199.4m, including a 7-year SustainableGreen debt facility with Aviva InvestorsNet debt of 141.7m representing an LTVof 27.9%, slightly below our target of 30-40% 92m of equity capital raised in the yearNET RENTAL INCOMEDIVIDEND PER SHARE 22.9m7.60p(Mar 2020: 12.2m)(Mar 2020: 7.60p)EPRA NTA PER SHARE1LOAN TO VALUE (“LTV”)152.33p27.9%(Mar 2020: 137.89p)(Mar 2020: nil)TOTAL ACCOUNTING RETURNTOTAL SHAREHOLDER RETURN15.6%29.8%(Mar 2020: 5.6%)(Mar 2020: 11.2%)1. In October 2019, EPRA introduced new best practice recommendations for reporting of net asset value. The Group considers EPRA Net Tangible Assets (NTA) to be the most relevant measure for its operatingactivities and has been adopted as the Group’s primary measure of net asset value.URBAN LOGISTICS 2021 FULL YEAR RESULTS8
OPERATIONAL HIGHLIGHTSActive asset management during the yearACQUISITIONS 295m1of investments into attractive assetsSourced off-market with a weighted average NIY of 6.2%32% (by value) located in South EastASSET MANAGEMENT 8 rent reviews, 23 new lettings and lease re-gears agreedin the yearActive asset management on properties which accounted for 69%of the growth in the yearLow EPRA vacancy rate of 6.9% at period end, of which 1.5%is undergoing refurbishmentPORTFOLIO VALUELFI VALUATION UPLIFT2 507.6m 13.2%(Mar 2020: 207.0m)(Mar 2020: 4.6%)TOTAL PROPERTY RETURN3EPRA VACANCY RATE17.1%6.9%(Mar 2020: 10.1%)(Mar 2020: 2.4%)RENT COLLECTIONDISPOSAL TPR99.9%78.8%(Mar 2020: 100.0%)(Mar 2020: 50%)DISPOSALS 1.2.3. 30m portfolio sale in March 202135.4% premium to book valueAchieving a Total Property Return of 78.8%Average purchase yield of 7.0% vs. 4.8% disposal yield36 assets acquired for a total consideration of 269 million (including acquisition costs and 5 million of refurbishment works) and advanced 26 million across 5 forward funded development assetsThe like-for-like increase for the financial year ended 31 March 2021 includes 5 assets sold as part of a portfolio on 25 March 2021Total Property Return is calculated as the capital growth in the portfolio, plus net rental income and profit or loss on the sale of investment properties expressed as a percentage return on the capital employedduring they year, however, this excludes acquisitionsURBAN LOGISTICS 2021 FULL YEAR RESULTS9
PORTFOLIOREVIEWURBAN LOGISTICS 2021 FULL YEAR RESULTS10
URBAN LOGISTICS REITPortfolio optimized for value creationPORTFOLIO VALUE1VALUATION NIY1 andsNorth WestPURCHASE NIY37.4 years6.4%AREACONTRACTED RENT5.3m sq.ft 30.3MGROSS TO NET RENTEPC RATINGS: A-C596.5%76%South EastYorkshire & NE14%Other29%Portfolio metrics are stated as per CBRE independent valuation as at 31 March 2021Based on contracted rent as at 31 March 2021, excluding short-term lettings and licencesAverage purchase NIY for all stabilised properties acquired from IPO to 31 March 2021, therefore, excludes forward funded developmentsBy capital valueBy floor areaURBAN LOGISTICS 2021 FULL YEAR RESULTS11
URBAN LOGISTICS REITHigh quality tenants provide secure incomeTenant credit ratings1,2Top 10 tenants (% of contracted rent)1,34%7%9.3%Culina GroupLow/low-moderate risk6.9%XPOModerate riskModerate-high/high risk6.1%Unipart Group (NHS)89%5.6%Fidens Studios4.7%Giant Booker LtdTenant diversity13.9%Amazon23%3.8%Pegler Yorkshire Group Ltd42%Third Party LogisticsLarge CorporateTuffnells Parcels Express Ltd2.6%SMEAgility Logistics2.4%Iron Mountain2.4%35%1.2.3.As a percentage of contracted rent as at 31 March 2021 (excluding short-term lettings and licences)Per Dun & Bradstreet (Overall Business Risk) as at 3 May 2021Top 10 tenants represent 47.7% of the contracted rent as at 31 March 2021 (excluding short-term lettings and licences)URBAN LOGISTICS 2021 FULL YEAR RESULTS12
URBAN LOGISTICS REITCreating dependable income growthLease expiry profile1LFL contracted rental income growth238%6.5%4.8%22%19%9%0-1 years3.4%2.9%12%2.0%1-3 years3-5 years5-10 years10 yearsMar-18Mar-19Mar-20Mar-21AVERAGE LFL INCOME GROWTH ONRENT REVIEWS SETTLED IN THE YEARContractual rent reviews119%12%Mar-1719%11%7%0-1 years1.2.1-3 years3-4 years4-5 yearsAs a percentage of contracted rent as at 31 March 2021 (excluding short-term lettings and licences)Based on income producing assets at the start and end of the periodURBAN LOGISTICS 2021 FULL YEAR RESULTS13
URBAN LOGISTICS REITAcquisition activity in the yearSouthEastSouthWestMidlandsNorthWestYorkshire& NEScotlandPurchase price1 80.0m 30.4m 36.3m 44.8m 38.0m 22.1mNet initial 561,935483,547333,082Contracted rent 4.7m 1.9m 2.1m 2.8m 2.6m 2.0mRent per sq ft 7.01 4.65 3.32 4.97 5.41 6.03 119.63 73.71 57.32 79.74 78.62 66.39Area (sq ft)Capital value per sq ft 252 million1 of last mile logistics assets acquired in the yearLocation232% South East bias9%6.2% weighted average NIYSouth East32%15%South WestMidlandsOn average, year end valuation 7.7% ahead of purchase priceNorth WestYorkshire & NE18%12%Scotland14%1. Headline purchase price, which excludes acquisition costs and also excludes forward funded developments2. By purchase price (excluding acquisitions costs)URBAN LOGISTICS 2021 FULL YEAR RESULTS14
URBAN LOGISTICS REITCase Study: Charlton Mead, Hoddesdon 1.A twelve-acre highly attractive “last-touch” distribution hubclose to London acquired in an off-market transaction duringthe year for a total consideration of 34.3 million, representinga NIY at 5.4%.The site is strategically located on the A10, which is seven milesfrom the M25 and benefits from excellent accessAdjacent to local power supply.At acquisition, three of the units were let to Muller UK & Ireland,a major producer and distributor of dairy products. The other unitswere vacant with a one-year rent guarantee.In February 2021, the vacant units were let on ten-year leasesat a rent of 13 per sq ft, 15% ahead of ERV.The year-end valuation of 41.4 million represents a 20.9%uplift since acquisitionContracted rentArea (sq ft)WAULT to expiry (years)1NBV at 31 March 2021 2.4m181,9969.7 41.4mWAULT to lease expiry 9.7 years (6.3 years to first break)URBAN LOGISTICS 2021 FULL YEAR RESULTS15
URBAN LOGISTICS REITAsset management driving returnsNo. ofDealsRentalUpliftLFL RentalUpliftWAULTLettings & re-gears23 3.9m9%7.6 yearsFixed rent reviews5 0.3m13%n/aOMV rent reviews3 0.4m29%n/a31 4.6m14%Total 31 deals completed in the year, generating 4.6 million of additional rental income per annum anda WAULT of 7.6 years14% like-for-like rental growth achieved, 19% on rent reviews settled in the yearRent collection: received 99.9% of rents demanded in the yearURBAN LOGISTICS 2021 FULL YEAR RESULTS16
URBAN LOGISTICS REITCase Study: XPO lease restructuring 1.Acquired three assets let to XPO Logistics in September 2017,for a combined consideration of 11.9 million and representinga weighted average NIY of 7.5%During the year, we granted new leases for 5-years on eachasset, increasing contracted rent by 0.3 million or 24.6% ona like-for-like basisIn addition to increasing rent and extending the term, thenegotiations included buying in all the freehold titles for eachsite and agreeing the installation of car charging points andlow energy lighting, significantly enhancing EPC ratingsThe year-end valuation of 20.4 million representing a 72.1%uplift since acquisition.Like-for-like valuation uplift in the year was 55.1%,representing a weighted average NIY of 5.9%.Contracted rentArea (sq ft)WAULT to expiry (years)1NBV at 31 March 2021 1.4m234,6544.9 20.4mWAULT as at 31 March 2021URBAN LOGISTICS 2021 FULL YEAR RESULTS17
URBAN LOGISTICS REITPerform: 30m of asset disposals in the year, 35.4% premium to book ewood 2.7m 0.8m 4.0m 6.7m 5.3m5.8%7.3%5.5%6.2%9.8%Sales price 4.9m 1.7m 5.3m 8.5m 9.6mSales price vs. NBV 7.5% 32.3% 32.0% 23.9% .3%Purchase price1Purchase NIYExit NIYTotal Property Return 1.5 assets sold as part of a portfolio for 30.0 millionAcquisition NIYExit NIYOver ownership period, increased contracted rentby 0.2 million, representing an uplift of 12% andincreased WAULT to 7.4 years as compared to 3.9years at acquisition7.0%4.8%Premium to NBVTotal Property Return 35.4%78.8%Includes acquisition costsURBAN LOGISTICS 2021 FULL YEAR RESULTS18
URBAN LOGISTICS REITDevelopment activity 1.5 development sites completed in the year, comprising8 logistics units and 2 electric van parksTotal gross development cost of 35.1 millionExpected to generate 2.1 million of additional rentper annum once fully let, representing a 5.7% yield oncost3 lettings agreed in the year, representing 39% ofERV, however this increase to 89% when taking intoaccount rental guaranteesAll units achieved an EPC rating of A at practicalcompletionTarget BREEAM rating of ExcellentGross development costAdditional rent1Yield on cost1Total area (sq ft) 35.1m 2.1m5.7%222,935Based on estimated rental valueURBAN LOGISTICS 2021 FULL YEAR RESULTS19
URBAN LOGISTICS REITAn attractive pipeline1SouthEastMidlandsNorthWestYorkshire& NEPurchase price 39.9m 59.1m 14.2m 40.2mNet initial ontracted rent 2.8m 3.7m 0.9m 2.7mRent per sq ft 5.77 5.86 5.54 4.565.36.111.312.5 83.41 93.53 90.67 68.38Area (sq ft)WAULT (years)Capital value per sq ftLocation226%26%Low/low-moderate risk3Weighted average NIYc.76%c.6.1%North WestWAULT (to expiry)Average rent per sq ftYorkshire & NEc.8.0 yrsc. 5.40South EastMidlands9%39%1.2.3.Indicative figures, subject to, inter alia, further due diligenceBy capital valuePer Dun & BradstreetURBAN LOGISTICS 2021 FULL YEAR RESULTS20
MARKETOUTLOOKURBAN LOGISTICS 2021 FULL YEAR RESULTS21
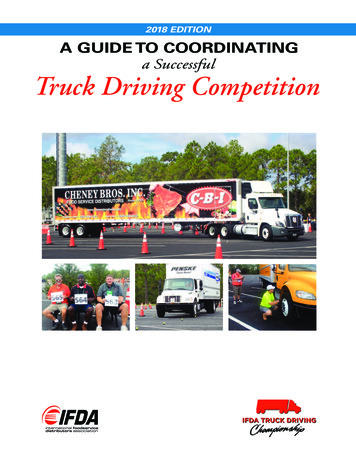
URBAN LOGISTICS REITStructural tail winds remain strong E-commerce as % of total retail sales¹35%15%16%2016201718%19%2018201922%Mar-20 Feb-21Prime yields/rents2Region E-commerce accounted for 35% of total retail sales inFebruary 2021, representing growth of c.56% since March2020The Covid-19 crisis has accelerated the adoption ofe-commerceThe pandemic highlighted the importance of supplychain resilience, with many businesses now adopting“just-in-case” mentality rather than “just-in-time”Reduced land availability in last mile/urban warehousespace creating continuous upwards pressure on rentand land valuesRent ( psf)Cap rateSouth East 16.503.75%South West 7.354.35%West Midlands 7.004.00%PORTFOLIO AVERAGE RENT PSFPORTFOLIO VALUATION YIELDNorth West 7.254.00%Yorkshire & NE 6.254.35%Scotland 6.254.35% 5.355.1%1. Source: Office of National Statistics (ONS)2. Sources: CBREURBAN LOGISTICS 2021 FULL YEAR RESULTS22
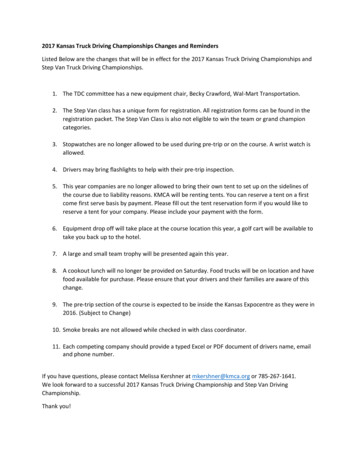
URBAN LOGISTICS REITRecord take-up while supply remains at low levelsSupply160Sq ft (millions)Sq ft 20%10100201520162017Q1 1.10%52018Q2Q3201920202021Q40%Q4 2015 Q4 2016 Q4 2017 Q4 2018 Q4 0219 Q4 2020 Q3 2021Total Sq ftGrade A proportionNew leases signed for 50.1 million sq ft of warehouse space in 2020, 12.7 million sq ft ahead of previous recordset in 20161Online retailers took close to 50% of available space, with omnichannel retailers and supermarkets expanding theironline presenceVacant, ready to occupy space, remains low at sub 6%1Lack of new, ready to occupy units has pushed occupiers towards the second-hand marketSource: SavillsURBAN LOGISTICS 2021 FULL YEAR RESULTS23
SUMMARYURBAN LOGISTICS 2021 FULL YEAR RESULTS24
SUMMARYProven track record with attractive pipelineSTRONG MARKET FUNDAMENTALS UK continues to be one of the fastest-growing adopters of e-commerceResilient demand creating upwards pressure on rent and land values, (land values up c.7% in 2020 1)Supply remains at all time low of sub 6%1Inflation in construction costs continue to drive up replacement costSTRONG INCOME GENERATION CHARACTERISTICS Average NIY at acquisition of 6.4%Low average rent per sq ft of 5.35 across our portfolioc.20% of our portfolio is subject to review or renewal in next 12-monthsLowered debt costs of c.2.50% (subject to movements in LIBOR)EXCITING PIPELINE TO MAINTAIN MOMENTUM High quality logistics properties which are complementary to our existing portfolioWeighted average NIY of c.6.1% and WAULT of c.8.0 yearsAverage rent per sq ft of c. 5.40Capital uplift potential plus tenant diversificationCAPITAL GROWTHATTRIBUTED TO ASSETMANAGEMENT SINCE IPO75%AVERAGE TAR PER ANNUMSINCE IPO13.9%AVERAGE RENT PER SQ.FT 5.351. Source: SavillsURBAN LOGISTICS 2021 FULL YEAR RESULTS25
APPENDIXURBAN LOGISTICS 2021 FULL YEAR RESULTS26
URBAN LOGISTICS REITCreating a responsible businessRESPOND TO CLIMATE CHANGESOCIAL & GOVERNANCE Over 98% of our properties haverecorded EnvironmentalPerformance Certificate (“EPC”)ratingsEPC ratings A-C: 76% as at31 March 2021Implementing an EPC strategyfor every individual asset inthe portfolioWorking towards GRESB andEPRA sBPR. First GRESB ratingexpected next yearAll leases for the past18-months encompass“green clauses”Committed to our first SustainableGreen debt facility with AvivaURBAN LOGISTICS 2021 FULL YEAR RESULTS Engage with occupiers on aregular basis and actively encourage dialogueWe spoke with our occupiers at least once amonth during the lockdown periods66% of Board members are independent17% of Board members are femaleAudit and Management EngagementCommittees 100% independentBOARD INDEPENDENCE66%PROPERTIES WITH EPC RATINGA-C76%The Board and Manager own 1.5% of theissued share capitalAdoption of, and compliance with, QuotedCompanies Alliance Corporate GovernanceCodeEPRA Gold Award for March 2020 AnnualReport and Accounts27
URBAN LOGISTICS REITA Board with experience and expertiseNIGEL RICHIndependentNon-ExecutiveChairmanNigel brings a wealth ofBoard experience,having operated acrossthe globe in seniorpositions, most recentlyat Segro plc where hewas Chairman for 10years.JONATHAN GRAYIndependentNon-ExecutiveDirectorJonathan hasconsiderable financialservices experiencehaving worked in seniorroles at HSBC, UBSand NCB.URBAN LOGISTICS 2021 FULL YEAR RESULTSBRUCE ANDERSONIndependentNon-ExecutiveDirectorBruce has considerablereal estate, REIT andfinancial servicesexperience havingworked in senior rolesat Green, Lloyds, HBoSand Bankof Scotland.HEATHER HANCOCKIndependentNon-ExecutiveDirectorMARK JOHNSONNon IndependentNon-ExecutiveDirectorHeather brings manyyears of high-levelexperience in strategy,governance andleadership in the realestate sector andwider economy.Co-founded PacificInvestments withSir John Beckwith.RICHARD MOFFITTDirector and CEORichard was formerlyHead of UK Industrialand Logistics at CBRE.Richard has over 25years’ experience of theUK Industrial andLogistics markets.28
URBAN LOGISTICS REITIncome statement31 Mar 2131 Mar 20VarianceINCOME LEAKAGE22.912.2 88.0%0.2-Administrative expenses(4.2)(2.3)3.5%EBIT18.89.9Net finance costs1(4.0)(2.7)ADJUSTED EARNINGS14.87.2LTIP(0.3)(3.5)EPRA EARNINGS14.53.7Fair value movements26.15.07.00.647.69.4 408.6%Adjusted earnings per share6.76p7.66p-11.7%5.4xEPRA earnings per share6.62p3.99p 65.9%(Mar 2020: 4.1x)DIVIDEND PER SHARE27.60p7.60p- mNet rental incomeOther incomeProfit on disposalIFRS PROFIT 89.6%(Mar 2020: 1.7%)TOTAL COST RATIO 105.7% 287.1%21.3%(Mar 2020: 18.9%)INTEREST COVER RATIO1. Adjusted for changes in fair value of interest rate derivatives2. Paid and declared with respect to the financial yearURBAN L
ASSET MANAGEMENT 8 rent reviews, 23 new lettings and lease re-gears agreed in the year Active asset management on properties which accounted for 69% of the growth in the year Low EPRA vacancy rate of 6.9% at period end, of which 1.5% is undergoing refurbishment DISPOSALS