Transcription
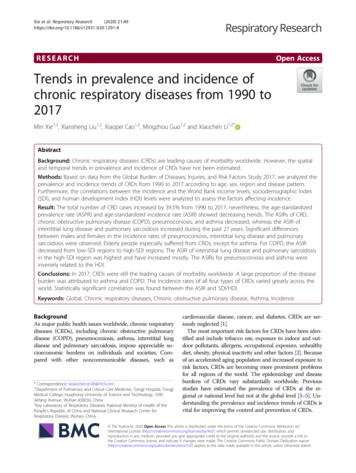
Previous Page14-58EQUIPMENT FOR DISTILLATION, GAS ABSORPTION, PHASE DISPERSION, AND PHASE SEPARATIONFor structured packing, Kister and Gill [Chem. Eng. Symp. Ser. 128,A109 (1992)] noticed a much steeper rise of pressure drop with flowparameter than that predicted from Fig. 14-55, and presented a modified chart (Fig. 14-56).The GPDC charts in Figs. 14-55 and 14-56 do not contain specificflood curves. Both Strigle and Kister and Gill recommend calculatingthe flood point from the flood pressure drop, given by the Kister andGill equation Pflood 0.12Fp0.7FIG. 14-54Efficiency characteristics of packed columns (total-reflux distillation.)Fp packing factor, ft 1ν kinematic viscosity of liquid, cSCS C-factor, Eq. (14-77), based on tower superficial crosssectional area, ft/sCP capacity factor, dimensional [units consisted with Eq.(14-140) and its symbols]The abscissa scale term is the same flow parameter used for tray(dimensionless):ρGLFLG ρLG 0.5(14-141)(14-142)Equation (14-142) permits finding the pressure drop curve in Fig. 14-55or 14-56 at which incipient flooding occurs.For low-capacity random packings, such as the small first-generationpackings and those smaller than 1-in diameter (Fp 60 ft 1), calculatedflood pressure drops are well in excess of the upper pressure dropcurve in Fig. 14-55. For these packings only, the original Eckert floodcorrelation [Chem. Eng. Prog. 66(3), 39 (1970)] found in pre-1997 editions of this handbook and other major distillation texts is suitable.The packing factor Fp is empirically determined for each packingtype and size. Values of Fp, together with general dimensional data forindividual packings, are given for random packings in Table 14-13 (togo with Fig. 14-55) and for structured packings in Table 14-14 (to gowith Fig. 14-56).Packing flood and pressure drop correlations should always be usedwith caution. Kister and Gill [Chem. Eng. Progr., 87(2), 32 (1991)]showed that deviations from the GPDC predictions tend to be systematic and not random. To avoid regions in which the systematic deviationslead to poor prediction, they superimposed experimental data points foreach individual packing on the curves of the GPDC. Figure 14-57 is anexample. This method requires a single chart for each packing type andsize. It provides the highest possible accuracy as it interpolates measureddata and identifies uncertain regions. A set of charts is in Chapter 10 ofKister’s book (Distillation Design, McGraw-Hill, New York, 1992) withLIVE GRAPHClick here to viewFIG. 14-55 Generalized pressure drop correlation of Eckert as modified by Strigle. To convert inches H2O to mm H2O, multiply by 83.31.(From Packed Tower Design and Applications by Ralph E. Strigle, Jr. Copyright 1994 by Gulf Publishing Co., Houston, Texas. Used with permission. All rights reserved.)
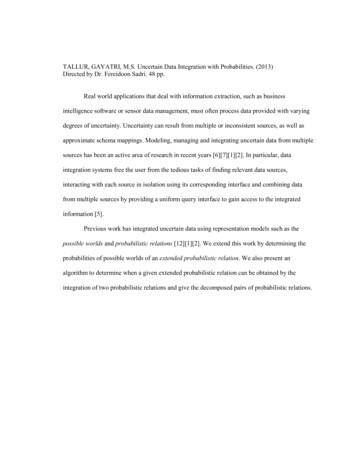
EQUIPMENT FOR DISTILLATION AND GAS ABSORPTION: PACKED COLUMNS14-59LIVE GRAPHClick here to viewThe Kister and Gill GPDC (SP) chart for structured packings only. Abscissa and ordinate same as in Fig.14-55. (From Kister, H. Z., and D. R. Gill, IChemE Symp. Ser. 128, p. A109, 1992. Reprinted courtesy of IChemE.)FIG. 14-56updates in Kister, Lason, and Gill, Paper presented at the AIChE SpringNational Meeting, Houston, Tex., March 19–23, 1995; and in Kister,Scherffius, Afshar, and Abkar, in Distillation 2007: Topical ConferenceProceedings, 2007 AIChE Spring National Meeting, Houston, Texas.The latter reference also discusses correct and incorrect applications ofthose interpolation charts.There are many alternative methods for flood and pressure dropprediction. The Billet and Schultes [IChemE Symp. Ser. 104, pp.A171 and B255 (1987)] and the Ma ćkowiak (“Fluiddynamik vonKolonnen mit Modernen Füllkorpern und Packungen für Gas/Flussigkeitssysteme,” Otto Salle Verlag, Frankfurt am Main und VerlagSauerländer Aarau, Frankfurt am Main, 1991) correlations are versions of the GPDC that take the liquid holdup into account. TheEiden and Bechtel correlation [IChemE Symp. Ser. 142, p. 757(1997)] is a version of the GPDC in which accuracy is improved byusing constants representative of packing shape instead of packingfactors. The Lockett and Billingham correlation (IChemE Symp.Ser. 152, p. 400, London, 2006) uses a Wallis correlationincreases because of the presence of liquid, which effectivelydecreases the available cross section for gas flow (Fig. 14-53). In principle, there should be a method for correcting the dry pressure dropfor the presence of liquid. This approach was used by Leva [Chem.Eng. Progr. Symp. Ser. No. 10, 50, 51 (1954)]. A more recent methodby Robbins [Chem. Eng. Progr., p. 87 (May 1991)] utilizes the sameapproach and is described here. The total pressure drop isCG0.5 mCL0.5 CLG(14-143)CL uL [ρL /(ρL ρG)]0.5(14-144)The term Fpd is a dry packing factor, specific for a given packing typeand size. Values of Fpd are given in Tables 14-13 and 14-14. For operating pressures above atmospheric, and for certain packing sizes, Lf andGf are calculated differently:whereand was shown to work well for high-surface-area ( 400 m2/m3) structured packings. Here CG is the gas C-factor, Eq. (14-77), based on thetower superficial cross-sectional area, and m and CLG are constants,available from the cited reference for some packing.A drawback of most of these correlations (except that of Eiden andBechtel) is the unavailability of constants for many, often most, of themodern popular packings.The above methods apply to nonfoaming systems. Foaming systemscan be handled either by applying additional derating (system) factors tothe flood correlation (see Table 14-9) or by limiting the calculated pressure drop to 0.25 in of water per foot of packing (Hausch, “DistillationTools for the Practicing Engineer,” Topical Conference Proceedings, p.119, AIChE Spring Meeting, New Orleans, March 10–14, 2002).Pressure Drop The GPDC discussed above (Figs. 14-55 and14-56) and the Kister and Gill interpolation charts provide popularmethods for calculating packing pressure drops. An alternative popular method that is particularly suitable for lower liquid loads was presented by Robbins (below).For gas flow through dry packings, pressure drop may be estimatedby use of an orifice equation. For irrigated packings, pressure drop Pt Pd PL(14-145)where Pt total pressure drop, inches H2O per foot of packing Pd dry pressure drop C3G2f 10(C L )(14-146) PL pressure drop due to liquid presence 0.4[Lf /20,000]0.1[C3G2f 10(C L )]4(14-147)Gf gas loading factor 986Fs(Fpd/20)0.5(14-148)Lf liquid loading factor L(62.4/ρL)(Fpd/20)0.5µ0.1(14-149)L44ffGf 986Fs(Fpd/20)0.5100.3ρ(14-150)GLf L(62.4/ρL)(Fpd/20) µFpd 200(14-151a)Lf L(62.4/ρL)(20/Fpd)0.5µ0.1LFpd 15(14-151b)0.5 0.2LThe Robbins equations require careful attention to dimensions. However,use of the equations has been simplified through the introduction of Fig.14-58. The terms Lf and Gf are evaluated, and the PL is obtained directlyfrom the chart. Basic nomenclature for the Robbins method follows:C3 7.4(10) 8C4 2.7(10) 5Fpd dry packing factor, ft 13 0.5Fs superficial F-factor for gas, Utρ0.5g , ft/s(lb/ft )G gas mass velocity, lb/hr ft2Gf gas loading factor, lb/hr ft2L liquid mass velocity, lb/hr ft2Lf liquid loading factor, lb/hr ft2 P pressure drop, inches H2O/ft packing ( 83.3 mm H2O/m packing)
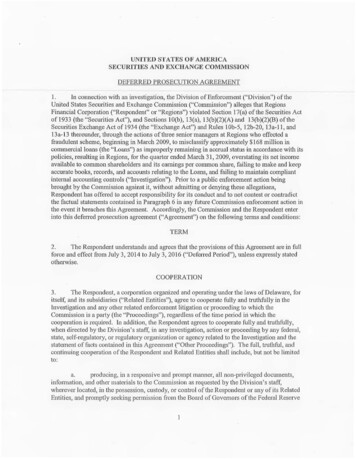
TABLE 14-13 Characteristics of Random PackingsNameSize,mm, orno. (#)Beddensity,*kg/m3Packing factor, m all rings(also Flexi-rings,Ballast rings, 49596972561831318959262174917946VariousMetal Intalox (IMTP)[also I-rings, AHPP,RSMR, 6564936Koch-Glitsch[Sulzer, Amistco,Rauschert, Montz]§Raschig ––––––––––Cascade ��RaschigNutter ringsFleximaxJaeger AmistcoRaschig rings(1 16 in 2187105––492223––VariousBerl 2151502950900308154102VariousIntalox, Flexi-saddles,Torus-saddles, 37679—66030213172272061330812166VariousRaschig ll ��–—RaschigHy-Pak, 14285¶Rauschert
EQUIPMENT FOR DISTILLATION AND GAS ABSORPTION: PACKED COLUMNS14-61TABLE 14-13 Characteristics of Random Packings (Concluded)NameSize,mm, orno. (#)Beddensity*kg/m3Packing factor, m ––––—RauschertVendorCeramicsHiflow rings3850704094053331088952Pall 2018013185563481801318239VariousSuper Intalox,Flexi-saddles,Super-Torus, iousCascade 92––33Koch-GlitschRaschig ePlastics*Values are approximate and may not be consistent. Actual number depends on wall thickness and material.Packing factor Fp from Kister, Distillation Design, McGraw-Hill, 1992; Kister, Larson, and Gill, paper presented at the HoustonAIChE meeting, March 19–23, 1995; Strigle, Packed Tower Design and Applications, 2d ed., Gulf Publishing Co., Houston, Tex.,1994; Kister et al., in Distillation 2007. Topical Conference Proceedings, 2007 AIChE Spring National Meeting, Houston, Tex.‡Dry packing factor Fpd from Robbins, Chem. Eng. Progr., 87(1), 19 (1990).§The bracketed packings are similar to, but not the same as, the Koch-Glitsch IMTP. Some of them have holes that theIMTP do not have, and others have sizes that are different and are made by different dies.¶Packing factor supplied by packing vendor.Vendors: Koch-Glitsch LLP, Wichita, Kansas; Raschig GmbH, Ludwigshafen/Rhein, Germany; Sulzer Chemtech Ltd., Winterthur, Switzerland; Rauschert Verfahrenstechnik GmbH, Steinwiesen, Germany; Amistco Separation Products Inc., Alvin,Texas; Julius Montz GmbH, Hilden, Germany; Ceilcote Co., Berea, Ohio; NSW Corp., Roanoke, Virginia; Lantec ProductsInc., Agoura Hills, California.†ρG gas density, lb/ft3ρL liquid density, lb/ft3µL liquid viscosity, cPThe Robbins correlation applies near atmospheric pressure andunder vacuum, but is not suitable above 3 bar absolute. For high( 0.3) flow parameters [Eq. (14-141)], the correlation has only beentested with air-water data.For flood and MOC predictions, Robbins recommends his pressuredrop method together with Eqs. (14-142) (flood) and (14-139) (MOC).The GPDC and Robbins correlations are empirical. Fundamental correlations are also available. Most of these use the channel model, whichattributes the pressure drop to the resistance to flow in a multitude ofparallel channels. The channels may have bends, expansions, andcontractions. Popular application of this approach are the Rocha et al. correlation [Rocha, Bravo, and Fair, Ind. Eng. Chem. Res. 32, 641 (1993)] forstructured packing and the Maćkowiak (“Fluiddynamik von Kolonnenmit Modernen Füllkorpern und Packungen für Gas/Flussigkeitssysteme,” Otto Salle Verlag, Frankfurt am Main und VerlagSauerländer Aarau, Frankfurt am Main, 1991) and Billet (Packed Column
14-62EQUIPMENT FOR DISTILLATION, GAS ABSORPTION, PHASE DISPERSION, AND PHASE SEPARATIONTABLE 14-14 Characteristics of Structured PackingsPacking factor, m 1NameSizeor numberArea,% Normalm2/m3 voids* Fp†DryFpd‡Packing factor, m 1VendorNameMetals, corrugated sheetsMellapakMellapak 3502505002503505009897399593959166AXBXCYBX Plus250492700959085Wire )332359RaschigMontz43Wire 3998Area,% Normalm2/m3 voids* Fp†4T5T5TXSulzer1620232682Sizeor number16Sulzer69(52.5)93.6 394/230§, 46094.8 312/180§, 96.0 180/131§, Knit Pak30/16016092Multifil plasticsP1500150088.5RaschigKnit Mesh*% voids vary with material thickness and values may not be consistent.†Packing factors from Kister, Distillation Design, McGraw-Hill, 1992; Kister, Larson, and Gill, paper presented at the Houston AIChE Meeting, March 19–23, 1995;and Kister et al., in Distillation 2007: Proceedings of Topical Conference, AIChE Spring Meeting, Houston, Tex., April 22–26, 2007.‡Dry packing factors from Robbins, Chem. Eng. Prog., p. 87, May 1991.§These packing factors supplied by the packing vendor.¶These are expanded metal packings.First figure is for hydrocarbon service, second figure for aqueous service.Vendors: Sulzer Chemtech Ltd., Winterthur, Switzerland; Koch-Glitsch LLP, Wichita, Kansas; Raschig GmbH, Ludwigshafen/Rhein, Germany; Julius MontzGmbH, Hilden, Germany; Knit Mesh/Enhanced Separation Technologies, Houston, Texas; Kuhni Ltd., Allschwil, Switzerland.Analysis and Design, Ruhr University, Bochum, Germany, 1989)methods. Stichlmair et al. (Distillation Principles and Practices, Wiley,New York, 1998; Gas Sep. Purif. 3, March 1989, p. 19) present alternative correlations using the particle model, that attributes packingpressure drop to friction losses due to drag of a particle. This is similarto the Ergun model for single-phase flow [Chem. Eng. Prog. 48(2), 89(1952)].Example 13: Packed-Column Pressure Drop Air and water are flowing countercurrently through a bed of 2-inch metal Pall rings. The air mass velocityis 2.03 kg/s m2 (1500 lbs/hr ft2), and the liquid mass velocity is 12.20 kg/s m2 (9000lbs/hr ft2). Calculate the pressure drop by the generalized pressure drop (GPDC,Fig. 14-55) and the Robbins methods. Properties: ρG 0.074 lbs/ft3; ρL 62.4 lbs/ft3,µL 1.0 cP, ν 1.0 cS. The packing factor Fp 27 ft 1. For Robbins, Fpd 24 ft 1.The flow parameter FLG L/G (ρG/ρL)0.5 (9000/1500) (0.074/62.4)0.5 0.207. The0.50.5F-factor Fs Utρ0.5(3600)] 1.53 ft/s(lb/ft3)0.5.G G/(ρG 3600) 1500/[(0.074)
EQUIPMENT FOR DISTILLATION AND GAS ABSORPTION: PACKED COLUMNSUsing the GPDC method, the capacity parameter [by Eq. (14-140)] Ut[ρG/(ρL ρG)]0.5 Fp0.5 ν 0.05, which is roughly equivalent toFs 0.5 0.051.53 27 0.5(1.0)Fp ν ρ0.562.40.5L 1.01Referring to Fig. 14-55, the intersection of the capacity parameter and the flowparameter lines gives a pressure drop of 0.38 inches H2O/ft packing.Using the Robbins method, Gf 986Fs(Fpd/20)0.5 986(1.53)(24/20)0.5 1653.Lf L (62.4/ρL)(Fpd/20)0.5 µ0.1 9000 (1.0)(1.095)(1.0) 9859. Lf /Gf 5.96.From Fig. 14-58, pressure drop 0.40 in. H2O/ft packing.PACKING EFFICIENCYHETP vs. Fundamental Mass Transfer The two-film modelgives the following transfer unit relationship:HOG HG λHL(14-152)where HOG height of an overall transfer unit, gas concentrationbasis, mHG height of a gas-phase transfer unit, mHL height of a liquid-phase transfer unit, mλ m/(LM/GM) slope of equilibrium line/slope ofoperating lineIn design practice, a less rigorous parameter, HETP, is used toexpress packing efficiency. The HETP is the height of packed bedrequired to achieve a theoretical stage. The terms HOG and HETP maybe related under certain conditions:ln λHETP HOG (λ 1) and since Zp (HOG)(NOG) (HETP)(Nt)NOG Nt[ln λ/(λ 1)](14-153)(14-154)(14-155)Equations (14-153) and (14-155) have been developed for binary mixture separations and hold for cases where the operating line and equilibrium line are straight. Thus, when there is curvature, the equationsshould be used for sections of the column where linearity can beassumed. When the equilibrium line and operating line have the sameslope, HETP HOG and NOG Nt (theoretical stages).An alternative parameter popular in Europe is the NTSM (numberof theoretical stages per meter) which is simply the reciprocal of theHETP.Factors Affecting HETP: An Overview Generally, packingefficiency increases (HETP decreases) when the following occur. Packing surface area per unit volume increases. Efficiency increasesas the particle size decreases (random packing, Fig. 14-59) or as thechannel size narrows (structured packing, Fig. 14-60). The packing surface is better distributed around a random packingelement. Y structured packings (45 inclination) give better efficiencies thanX structured packings (60 inclination to the horizontal) of the samesurface areas (Fig. 14-60). For constant L/V operation in the preloading regime, generallyliquid and vapor loads have little effect on random and most corrugated sheet structured packings HETP (Figs. 14-59 and 14-60).HETP increases with loadings in some wire-mesh structuredpacking. Liquid and vapor are well distributed. Both liquid and vapor maldistribution have a major detrimental effect on packing efficiency.14-63 Other. These include L/V ratio (lambda), pressure, and physicalproperties. These come into play in some systems and situations, asdiscussed below.HETP Prediction HETP can be predicted from mass-transfermodels, rules of thumb, and data interpolation.Mass-Transfer Models Development of a reliable mass-transfermodel for packing HETP prediction has been inhibited by a lack ofunderstanding of the complex two-phase flow that prevails in packings, by the shortage of commercial-scale efficiency data for the newerpackings, and by difficulty in quantifying the surface generation inmodern packings. Bennett and Ludwig (Chem. Eng. Prog., p. 72,April 1994) point out that the abundant air-water data cannot be reliably used for assessing real system mass-transfer resistance due tovariations in turbulence, transport properties, and interfacial areas.More important, the success and reliability of rules of thumb for predicting packing efficiency made it difficult for mass-transfer models tocompete.For random packings, the Bravo and Fair correlation [Ind. Eng.Chem. Proc. Des. Dev. 21, 162 (1982)] has been one of the mostpopular theoretical correlations. It was shown (e.g., McDougall,Chem SA, p. 255, October 1985) to be better than other theoreticalcorrelations, yet produced large discrepancies when compared totest data [Shariat and Kunesh, Ind. Eng. Chem. Res. 34(4), 1273(1995)]. For structured packings, the Bravo, Fair, and Rocha correlation [Chem. Eng. Progr. 86(1), 19 (1990); Ind. Eng. Chem. Res.35, 1660 (1996)] is one of the most popular theoretical correlations.This correlation is based on the two-film theory. Interfacial areasare calculated from the packing geometry and an empirical wettingparameter.Alternate popular theoretical correlations for random packings,structured packings, or both (e.g., Billet and Schultes, “Beitrage zurVerfahrens-und Umwelttechnik,” p. 88, Ruhr Universitat, Bochum,Germany, 1991) are also available.Rules of Thumb Since in most circumstances packing HETP issensitive to only few variables, and due to the unreliability of even thebest mass-transfer model, it has been the author’s experience thatrules of thumb for HETP are more accurate and more reliable thanmass-transfer models. A similar conclusion was reached by Porterand Jenkins (IChemE Symp. Ser. 56, Summary paper, London,1979).The majority of published random packing rules of thumb closelyagree with one another. They are based on second- and third-generation random packings and should not be applied to the obsoletefirst-generation packings. Porter and Jenkins’s (loc. cit.), Frank’s(Chem. Eng., p. 40, March 14, 1977), Harrison and France’s (Chem.Eng., p. 121, April 1989), Chen’s (Chem. Eng., p. 40, March 5, 1984),and Walas’ (Chem. Eng., p. 75, March 16, 1987) general rules ofthumb are practically the same, have been successfully tested againstan extensive data bank, and are slightly conservative, and thereforesuitable for design.For small-diameter columns, the rules of thumb presented byFrank (loc. cit.), Ludwig (Applied Process Design for Chemical andPetrochemical Plants, vol. 2, 2d ed., Gulf Publishing, Houston, Tex.,1979), and Vital et al. [Hydrocarbon Processing, 63(12), 75 (1984)]are identical. The author believes that for small columns, the moreconservative value predicted from either the Porter and Jenkins orthe Frank-Ludwig-Vital rule should be selected for design. Summarizing:HETP 18DPHETP DTfor DT 0.67 m(14-156a)(14-156b)where DP and DT are the packing and tower diameters, m, respectively, and the HETP is in meters. In high-vacuum columns ( 100mbar), and when λ mGM/LM is outside the range of 0.5 to 2.0, theabove rules may be optimistic (see below).The above rules of thumb were based on experience with Pall rings.The packing diameter may be difficult to establish for some of themodern packings, especially those of saddle or flat shape. For these,
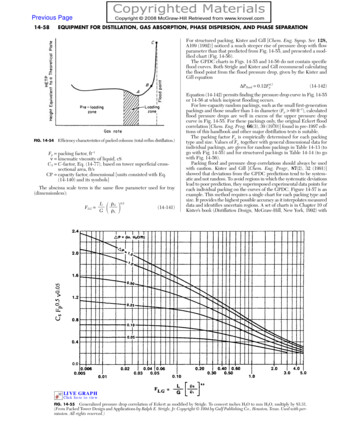
14-64EQUIPMENT FOR DISTILLATION, GAS ABSORPTION, PHASE DISPERSION, AND PHASE SEPARATION(a)(b)Superimposing experimental pressure-drop data for a given packing generates a GPDC interpolationchart for this packing. (a) A random packing; chart is based on Eckert’s GPDC, Fig. 14-55. (b) A structured packing;chart is based on Kister and Gill’s GPDC (SP), Fig. 14-56. (From Kister, H. Z., Distillation Design, copyright McGraw-Hill, 1992; used with permission.)FIG. 14-57Kister and Larson (in Schweitzer, Handbook of Separation Techniquesfor Chemical Engineers, 3d ed., McGraw-Hill, 1997) extendedEq. (14-156a) by expressing the packing diameter in terms of themore fundamental surface area per unit volume aP, m2/m3. For Pallrings, it can be shown thataP 5.2/DP(14-157)HETP 93/aP(14-158)and Eq. (14-156a) becomes
EQUIPMENT FOR DISTILLATION AND GAS ABSORPTION: PACKED COLUMNS14-65Harrison and France (loc. cit.) presented the only published rule ofthumb for structured packings efficiency as a function of packingcrimp. Kister and Larson reexpressed it in terms of the surface areaper unit volume to accommodate a wider range of packing geometries. The final expression isHETP 100CXY/ap 0.10LIVE GRAPHClick here to viewFIG. 14-58 The Robbins generalized pressure-drop correlation. (From L. A.Robbins. Chem Eng. Progr., May 1991. p. 87, reprinted courtesy of the American Institute of Chemical Engineers.)(14-159)Specific surface areas are listed in Tables 14-13 and 14-14.The above rules of thumb apply to organic and hydrocarbon systems, whose surface tensions are relatively low (σ 25 mN/m). Forhigher surface tensions, the liquid does not adhere well to thepacking surfaces (underwetting), causing higher HETPs. In awater-rich system (σ 70 mN/m or so) HETPs obtained from Eqs.(14-156), (14-158), and (14-159) need to be doubled. For intermediate surface tension systems (some amines and glycols, whose surface tension at column conditions is 40 to 50 mN/m), HETPsobtained from Eqs. (14-156), (14-158), and (14-159) need to bemultiplied by 1.5.For random packings, Eqs. (14-156) and (14-158) apply for packings of 25-mm diameter and larger. For smaller packings, use of theap at 25-mm often gives a slightly conservative HETP estimate. Forstructured packing, CXY in Eq. (14-159) reflects the effect ofthe inclination angle (Fig. 14-60). CΞΨ 1 for Y-type, S-type, or highcapacity packings, and CXY 1.45 for the larger ( 300 m2/m3) X-typepackings. There are insufficient data to determine CXY for high specific area X-type packings, but Fig. 14-60 suggests it is somewhatlower than 1.45.Compared to experimental data, the above rules of thumb areslightly conservative. Since packing data are usually measured withperfect distribution, a slight conservative bias is necessary to extendFs, m/s (kg/m3)0.50.01000.51.01.52.02.53.02.490802.01.63.5 inch (88.9 mm)60501.2402 inch (50.8 mm)HETP, mHETP, in700.8305/8 inch (15.9 mm)200.41000.01 inch (25.4 mm)0.40.81.21.62.02.40.02.8Fs, ft/s (lb/ft3)0.5HETP values for four sizes of metal pall rings, vacuum operation. Cyclohexane/n-heptane system, total reflux, 35 kPa(5.0 psia). Column diameter 1.2 m (4.0 ft). Bed height 3.7 m (12 ft). Distributor tubed drip pan, 100 streams/m2. [Adapted fromShariat and Kunesh, Ind. Eng. Chem. Res., 34, 1273 (1995). Reproduced with permission. Copyright 1995 American ChemicalSociety.]FIG. 14-59
14-66EQUIPMENT FOR DISTILLATION, GAS ABSORPTION, PHASE DISPERSION, AND PHASE SEPARATIONEffect of structured packing surface areas, loads, and inclination angle on packing efficiency. Efficiency expressed as number of theoretical stages per meter, the reciprocal of HETP. Sulzer data, chlorobenzene–ethylbenzene, 100 mbar, at total reflux; 250-mm-diameter test column. (Reprinted courtesy of SulzerChemtech.)FIG. 14-60these data to the good, yet imperfect, distributors used in the realworld. For poor distributors, the above rules of thumb will usuallypredict well below the HETPs measured in the field.Lockett (Chem. Eng. Progr., p. 60, January 1998) simplified thefundamental Bravo-Fair-Rocha correlation [Ind. Eng. Chem. Res. 35,p. 1660 (1996)] to derive an alternative rule of thumb for structuredpacking efficiency. This rule of thumb predicts HETPs under perfectdistribution conditions. Lockett recommends caution when applyingthis rule of thumb for aqueous systems as it does not predict theeffects of underwetting (below).Service-Oriented Rules of Thumb Strigle (Packed TowerDesign and Applications, 2d ed., Gulf Publishing, Houston, Tex.,1994) proposed a multitude of rules of thumb as a function of the service, column pressure, and physical properties. These rules are basedon the extensive experience of Strigle and the Norton Company (nowmerged with Koch-Glitsch LP).
EQUIPMENT FOR DISTILLATION AND GAS ABSORPTION: PACKED COLUMNSData Interpolation Interpolation of experimental HETP data isthe most reliable means of obtaining design HETP values. This ishardly surprising in an area where our understanding of the theory isso poor that rules of thumb can do better than theoretical models. Theauthor believes that it is best to derive HETP from experimental data,and to check it against a rule of thumb.Eckert [Chem. Eng. Progr. 59(5), 76 (1963)], Chen (Chem. Eng.p. 40, March 5, 1984), and Vital et al. [Hydroc. Proc. 63(12), 75(1984)] tabulated experimental HETP data for various random packings. Kister (Distillation Design, McGraw-Hill, 1992) extended thesetabulations and included published HETP data and a detailed procedure for interpolating such HETP data. A prerequisite to any interpolation of packing data is thorough familiarity with the factors thataffect HETP. Overlooking any of the factors listed can easily lead topoor interpolation and grossly incorrect design. In particular, it isimperative to recognize that the quality of distribution in pilot towersis generally superior to the quality of distribution in commercial towers.Underwetting Laboratory- and pilot-scale distillation experiments with systems that exhibit large differences in surface tensionalong the column such as methanol-water showed a sharp drop in efficiency at the high-surface-tension end of the column [Ponter et al.,Trans. Instn. Chem. Engineers [London], 45, T345 (1967)]. Thereappeared to be a critical methanol composition below which performance deteriorated rapidly. The poor performance at the lowmethanol-concentration end appeared independent of the type andsize of packing. Visual observations with disk columns attributed theseeffects to underwetting.Underwetting is a packing surface phenomenon, which breaks upliquid film. The tendency of the liquid film to break (the degree ofwetting) is expressed by the contact angle (Fig. 14-61). A contactangle of 0 indicates perfect wetting; an angle of 180 indicates nowetting. Mersmann and Deixler [Chem. Ing. Tech. 58(1), 19 (1986)]provide a preliminary chart for estimating contact angles. The contactangle depends on both the surface and the liquid and is a strong function of composition. In systems with large surface tension gradients,both contact angles and minimum wetting rates may vary rapidly withchanges of composition or surface tension. Extensive studies by Ponter et al. [loc. cit.; also, Ponter and Au-Yeung, Chem. Ing. Tech., 56(9),701 (1984)] showed that Underwetting is most significant in aqueous-organic systems, andtends to occur at the high-surface-tension (aqueous) end of thecomposition range. L
pd is a dry packing factor, specific for a given packing type and size. Values of F pd are given in Tables 14-13 and 14-14. For operat-ing pressures above atmospheric, and for certain packing sizes, L . Jaeger Tripacks #1 223 118 96 85 -- Raschig (Top-Pak) #2 170 75 98 46 — .