Transcription
The ISME Journal (2010) 4, 1215–1223& 2010 International Society for Microbial Ecology All rights reserved 1751-7362/10www.nature.com/ismejORIGINAL ARTICLECarbon and nitrogen fluxes associated with thecyanobacterium Aphanizomenon sp. in theBaltic SeaHelle Ploug1,3, Niculina Musat2,3, Birgit Adam2, Christina L Moraru2, Gaute Lavik2,Tomas Vagner2, Birgitta Bergman1 and Marcel MM Kuypers21Department of Botany, Stockholm University, Stockholm, Sweden and 2Department of Nutrient Group,Max Planck Institute for Marine Microbiology, Bremen, GermanyCarbon and nitrogen fluxes in Aphanizomenon sp. colonies in the Baltic Sea were measured using acombination of microsensors, stable isotopes, mass spectrometry, and nanoscale secondary ionmass spectrometry (nanoSIMS). Cell numbers varied between 956 and 33 000 in colonies ranging involume between 1.4 10 4 and 230 10 4 mm 3. The high cell content and their productivity resultedin steep O2 gradients at the colony–water interface as measured with an O2 microsensor. Colonieswere highly autotrophic communities with few heterotrophic bacteria attached to the filaments.Volumetric gross photosynthesis in colonies was 78 nmol O2 mm 3 h 1. Net photosynthesis was64 nmol O2 mm 3 h 1, and dark respiration was on average 15 nmol O2 mm 3 h 1 or 16% of grossphotosynthesis. These volumetric photosynthesis rates belong to the highest measured in aquaticsystems. The average cell-specific net carbon-fixation rate was 38 and 40 fmol C cell 1 h 1 measuredby microsensors and by using stable isotopes in combination with mass spectrometry andnanoSIMS, respectively. In light, the net C:N fixation ratio of individual cells was 7.3 3.4. Transfer offixed N2 from heterocysts to vegetative cells was fast, but up to 35% of the gross N2 fixation in lightwas released as ammonium into the surrounding water. Calculations based on a daily cycle showeda net C:N fixation ratio of 5.3. Only 16% of the bulk N2 fixation in dark was detected inAphanizomenon sp. Hence, other organisms appeared to dominate N2 fixation and NH4þ releaseduring darkness.The ISME Journal (2010) 4, 1215–1223; doi:10.1038/ismej.2010.53; published online 29 April 2010Subject Category: microbial ecosystems impactsKeywords: Aphanizomenon; nitrogen fixation; ammonium release; photosynthesis; respirationIntroductionAphanizomenon sp. is a filamentous, colonyforming N2-fixing cyanobacterium, which frequentlyblooms in lakes and brackish waters. It occurs bothas colonies and single trichomes during theirgrowth, which often lasts 2–3 months during thesummer in the Baltic Sea (Rolff et al., 2007;Degerholm et al., 2008). The primary productivityin the Baltic Sea by filamentous cyanobacteria,which are represented by Aphanizomenon sp.,Anabaena sp., and Nodularia spumigena, represents44% of the community primary production. Thesefilamentous organisms comprise 20–30% of thecyanobacterial biomass in the Baltic Sea. Theremaining primary productivity and biomass isCorrespondence: H Ploug, Department of Botany, StockholmUniversity, Lilla Frescativägen 5, Stockholm SE-10691, Sweden.E-mail: Helle.Ploug@botan.su.se3These two authors contributed equally to this work.Received 21 December 2009; revised 13 March 2010; accepted 15March 2010; published online 29 April 2010represented by unicellular picocyanobacteria (Stalet al., 1999; Stal and Walsby, 2000). In the absence ofother nitrogen sources, these large filamentouscyanobacteria cover their nitrogen demand throughN2 fixation, and growth is probably limited by theavailability of phosphate (Moisander et al., 2003;Walve and Larsson, 2007). Aphanizomenon sp.accumulates inorganic phosphate during the growthseason, and blooms appear to terminate when theinternal storage is used up and bulk concentrationsare low in mid-August in the Baltic Sea (Walve andLarsson, 2007).N2 fixation by filamentous cyanobacteria, including Aphanizomenon sp., is considered to be aquantitatively important source of nitrogen to theplankton community during the summer months inthe Baltic Sea (Degerholm et al., 2008). Nitrogenbudgets of the Baltic Sea have suggested thatAphanizomenon leaks a substantial fraction of itsfixed nitrogen that is used by other members(for example picocyanobacteria and heterotrophicbacteria) in the plankton community (Larssonet al., 2001; Stal et al., 2003; Rolff et al., 2007).
C- and N-fluxes in Aphanizomenon sp.H Ploug et al1216Using stable isotopes, it was shown that 5–10% ofthe 15N2 fixed by large cyanobacteria (Aphanizomenonsp. and Nodularia sp.) in the Baltic Sea is found insmaller organisms represented by the 2–5 mm sizeclass, for example picocyanobacteria, after 8–10 hincubation time (Ohlendieck et al., 2000). Directmeasurements of ammonium or dissovled organicnitrogen (DON) release relative to N2-fixation rates,however, have not been performed in field-sampledcyanobacteria from the Baltic Sea.Nanoscale secondary ion mass spectrometry(nanoSIMS) is a novel technique, which revealselemental and isotopic surface composition aftermeasurement of isotopic composition at a spatialresolution of 50 nm. Combining this technique withisotope enriched incubations has enabled measurements of N2 and C fixation on a single-cell level inmixed populations (Musat et al., 2008). Hence,using this technique we can now ascribe N2 and Cfixation to individual cells of different organisms inthe Baltic Sea. To understand small-scale carbonand nitrogen fluxes in Aphanizomenon sp. colonies,we combined microsensors and stable isotopeenrichment incubations with mass spectrometry aswell as with nanoscale secondary ion mass spectrometry (nanoSIMS). Using microsensors, gross andnet photosynthesis as well as dark respiration wasmeasured directly in colonies as a function ofcolony size and cell content in field-sampledAphanizomenon sp. in the Baltic Sea. Using stableisotope in combination with mass spectrometry andnanoSIMS, we measured carbon and nitrogen fixedby Aphanizomenon sp. cells and its release to thesurrounding water.Materials and methodsSamplingIn August 2008, Aphanizomenon colonies weresampled in the upper 10 m of the water column atstation B1 (N 581 480 28, E 171 370 60) in theStockholm archipelago using a plankton net (Hydrobios: 0.5 m diameter, mesh size: 90 mm). Water at 5 mdepth was collected by a water sampler. The salinitywas 6 and the temperature was 19 1C. Samples wereimmediately brought to the laboratory in which theywere analyzed by microsensors or incubated withstable isotopes.MicroscopyAll three dimensions of individual colonies weremeasured under a dissection microscope using acalibrated ocular micrometer. Their volume wascalculated as ellipsoids: Vol ¼ 4/3p a b c,where a, b, and c are the half-axes in the threedimensions. A microsensor was used to lift and turncolonies on an agar plate covered with water fromthe sampling site. Each colony with known size wasthereafter collected using a wide bore pipette,The ISME Journaltransferred to an Eppendorf vial with 1.5 ml surrounding water, and fixed with a drop of 5% Lugol’ssolution. The fixed colonies were stored cold at 4 1Cuntil further analysis. Colonies disintegrate in Lugol’ssolution, and the filaments sediment at the tip of theEppendorf vial; 1 ml containing all filaments fromeach colony was pipetted into a gridded SedgewickRafter counting chamber (Wildlife supply Company).Numbers and dimensions of dispersed filaments,vegetative cells, and heterocyst frequency (in nofilament per length, and in percent of vegetativecells) in each colony was measured under an invertedmicroscope (Zeiss, Switzerland) equipped with adigital camera (Axio Cam, Zeiss) connected to animage analysis program (AxioVision, Zeiss). Totalcumulative filament length per field was measureduntil the mean value was stable and the s.d. waso2% of the mean value.Total abundance of Aphanizomenon sp. trichomesand cells in bulk water and in concentrated samples(see below) was measured using the same countingprocedure as described above. Five replicates, eachcomprising a subsample of 1 ml of 50 ml samplefixed in Lugol were analyzed both for in situ bulkwater as well as concentrated samples.Small-scale measurements of O2 fluxesFreshly sampled colonies were transferred to a Petridish coated by a 3 mm thick agar layer (1% w:w) atthe bottom and covered by filtered (0.2 mm) waterfrom the sampling site. The diffusion coefficients ofgases, ions, and solutes in 1% agar are close to thosein (sea) water (Libicki et al., 1988; Revsbech, 1989).Artifacts from a solid boundary, which limits soluteexchange between colonies and the surroundingwater, was, therefore, avoided by using a Petri dishcoated with agar (Ploug and Grossart, 1999). ThePetri dish was placed in a thermostated container atin situ temperature. Oxygen concentrations weremeasured at the colony–water interface using aClark type oxygen microsensor (Revsbech, 1989)attached to a micromanipulator. The current wasmeasured by a picoamperemeter (Unisense PA 2000)connected to a strip-chart recorder (Kipp andZonen). The electrode was calibrated at anoxicconditions and at air saturation. Its 90% responsetime was o1 s and the stirring sensitivity o0.3%.The oxygen microelectrode tip was 2 mm wide andits position was observed under a dissection microscope with an ocular micrometer. The electrode wasmanually approached toward the colony until itvisually touched the surface. Oxygen-concentrationgradients were measured at the colony–water interface at 50 mm step increments. Three replicates ofthe O2-concentration gradient were measured inlight and in dark, respectively. The light source wasa Schott lamp (KL 1500 LCD) equipped with aninfra-red cutoff filter and calibrated using an LiCORscalar irradiance sensor. The fluxes of oxygen weremeasured at steady state of concentration gradients
C- and N-fluxes in Aphanizomenon sp.H Ploug et al1217at the colony–water interface, and calculated fromFick’s first law of diffusion:J ¼ DdCdrð1Þwhere J is the flux (nmol O2 cm 2 s 1), D is thediffusion coefficient of O2 in the bulk water(2.02 10 5 cm2 s 1 at 6 and 19 1C; Broecker andPeng, 1974), and dC/dr is the radial-concentrationgradient of O2 (nmol O2 cm 3). Surface area andvolume was calculated as for ellipsoids (Mass,1994). Carbon production rates were calculatedassuming a photosynthetic quotient of 1.2 mol O2:1 mol CO2.Incubations with stable isotopesWater samples containing 1.10 108 Aphanizomenon sp. cells per liter ( 0.03 108 cells l 1; s.e.)were incubated in 250 ml serum bottles by addingcolonies harvested by the plankton net to bulk watersamples. Microscopy revealed that the meantrichome size was 230 95 mm, and most heterocystswere observed within the trichomes. Hence, cellsdid not appear damaged by the sampling procedure.The serum bottles were closed with rubber stoppersthrough which 13C bicarbonate was injected to afinal bicarbonate concentration of 1.83 mM (11%labeling) except for three control bottles. Using a gasmouse, 2 ml 15N2 (Sigma, Germany) was injected tothe sample (12% final labeling). The syringe wasflushed several times with Argon gas betweeninjections. All bottles were thoroughly shakenduring 5 min to ensure an even distribution ofdissolved 15N2 in the samples. Many coloniesremained intact, and microscopy did not reveal celldamage during this procedure. Three replicates wereincubated for 0, 3, or 6 h in light at 300 mmolphotons m 2 s 1, as measured using an LiCor scalarirradiance sensor, or in dark at in situ temperature(19 1C) in a thermostated room. The incubationswere stopped by filtration of samples ontopre-combusted GF/F filters (for EA-MS analysis)(Montoya et al., 1996). The filtrates were filled into12 ml gas tight exetainers and killed by adding100 ml saturated HgCl2 solution to each exetainer.Subsamples for nanoSIMS analysis were fixed with2% paraformaldehyde and washed before filtrationonto Gold-Palladium-coated GTTP filters (pore size,0.22 mm; diameter 25 mm; Millipore, Germany).EA-IRMS analysisTo determine the amount of 15N gas and 13Cbicarbonate incorporated into biomass, water samples were filtered onto glass fiber filters andanalyzed through mass spectrometry using N2 andCO2 released by flash combustion in excess oxygenat 1050 1C. An automated elemental analyzercoupled to a Delta Plus Advantage mass spectrometer was used (Montoya et al., 1996). Beforeanalysis, GF/F filters were freeze dried overnightand dehydrated in an HCl-smoke environment in adesiccator overnight. Round punchouts (Ø 1 cm) ofthe GF/F filters were packed into tin cups and weretightly pressed into a pill-shaped form. These werethen loaded onto an autosampler flushed withhelium, which automatically dropped the packedfilters into the combustion furnace. As a standard,caffeine was used for calibration.NanoSIMS analysisFor NanoSIMS analysis of single Aphanizomenoncells, Gold-Palladium-coated GTTP filters containing chemically fixed water samples were cut with around stencil (Ø 5 mm) and mounted on a sampleholder. The analysis was performed using a NanoSIMS 50 l manufactured by Cameca (Gennevilliers,France). For each individual cell, we recordedsimultaneously secondary ion images of 12C, 13C,12 14C N, and 12C15N using four electron multipliers.The measurements and the image and data processing were performed as described earlier (Musatet al., 2008).The 15N/14N and the 13C/12C ratios of individualAphanizomenon cells were determined for experiments with and without (that is control experiments) labeled substrate. Subsequently, the 15N/14Nand 13C/12C enrichment of individual cells wascalculated by subtracting the average cellular ratiosof Aphanizomenon in the control experiments fromthe ratios obtained for individual cells from thelabeling experiment.Ammonium analysisThe net release of 15NH4þ from cyanobacteria wasquantified in the filtrate after the incubations with15N2 during 0, 3, and 6 h in light or darkness usingthe method by Warembourg (1993). Samples wereanalyzed on a GC-IR mass spectrometer (VG IsogasLimited, Middlewitch, UK).The NH4þ microenvironment of colonies wasmodeled, knowing the diffusive properties of colonies from O2 measurements, the net carbon fluxes,the C:N fixation ratio, and fraction of fixed nitrogenreleased as NH4þ . We used an analytical diffusionmodel by Ploug et al. (1997), with a diffusioncoefficient of NH4þ of 1.6 10 5 cm2 s 1 at 6 and19 1C (Li and Gregory, 1974).ResultsThe number of cells in the Aphanizomenon sp.colonies was a significant function of colony volume(Figure 1). The largest colonies had a volume of0.023 mm3 with an equivalent spherical diameterof 340 mm, but most colonies were considerablysmaller. The number of cells in individual coloniesThe ISME Journal
C- and N-fluxes in Aphanizomenon sp.H Ploug et al250200Cells colony-12500015020000150001001000050Cumulative filament length-1(mm filaments colony )300005000000.0000.0050.0100.0150.0200.0253Colony volume (mm )Figure 1 Number of cells and cumulative filament length (bothshown as symbols) in Aphanizomenon colonies as a function ofcolony volume. The line represents linear regression between thevariables (please see text).varied from 956 to 33 000 for colonies rangingbetween 1.4 10 4 and 230 10 4 mm3 in volume.The average number of cells per colony wasdescribed as Cells ¼ 1.53 106 (Volcol), where colony volume is measured in mm3. Alternatively,biomass of filamentous cyanobacteria is measured asmeter per length (m l 1) (Hajdu et al., 2007; Rolffet al., 2007; Degerholm et al., 2008). The cumulativelength of filaments in individual colonies variedbetween 7 and 246 mm, and it was described byL ¼ 11 341 (Volcol); where length, L, is expressed inmm. The significance level was R2 ¼ 0.61; n ¼ 37;Po0.0001 for both expressions. The mean cellvolume was 132 mm3, and the mean volume fractionoccupied by cells in colonies was 0.19. Heterocystswere 1.5% of total cells or 2.02 0.95 mm perfilament independent of colony volume.The cell content and their productivity in coloniesgave rise to significant oxygen-concentration gradients at the colony–water interface (Figure 2). Oxygen concentrations at the colony surface varied up to65 mM between the light (300 mmol photons m 2 s 1)and the dark exposed colonies (Figure 2). Thegradients were measurable up to 200 mm from thesurface of a 340 mm large colony. Net photosynthesiswas 1.1 nmol colony 1 h 1, and dark respiration was0.3 nmol colony 1 h 1 as calculated from the oxygengradients measured in light and dark, respectively.Hence, dark respiration was 22% of gross photosynthesis in this example.The net photosynthesis and dark respirationmeasured as a function of colony size are shown(Figure 3). Net photosynthesis as well as darkrespiration increased proportionally to colonyvolume. Net photosynthesis was described byNP ¼ 64 (Volcol); R2 ¼ 0.92 (n ¼ 14; Po0.001), anddark respiration was described by R ¼ 15 (Volcol);R2 ¼ 0.94 (n ¼ 14; Po0.001), where volume is measured as mm3, and NP and R measured asnmol O2 mm 3 h 1. Thus, volume-specific grossphotosynthesis, net photosynthesis, and darkrespiration was 79, 64, and 15 nmol O2 mm 3 h 1,The ISME Journal250200150100500270280290300310320330340O2 (µM)Figure 2 O2 gradients measured at the colony–water interfaceduring dark (closed symbols) and in light at 300 mmol photonsm 2 s 1 (open symbols). Each symbol represents the average valueof three series of measurements with the s.d. of the mean valueshown as bars. The curve represents the O2-concentrationgradient fitted to the measured values and used for fluxcalculations.1.4Net O2 exchange (nmol O2 colony h-1)35000Radial distance from colony surface 010Colony volume0.0150.020(mm3)Figure 3 Net photosynthesis rate (open symbols) and darkrespiration rate (closed symbols) measured as a function of colonyvolume. Each symbol represents the average value of three series ofmeasurements with the s.d. of the mean value shown as bars.respectively, independent of colony size. Combiningthese correlations with the biomass distribution(Figure 1), and assuming a cell-specific carboncontent of 0.11 pg C mm 3 (Helcom, 1988) yielded acarbon-specific net photosynthesis rate of0.029 h 1 and a dark respiration rate of 0.007 h 1independent of colony size. Average cell-specificphotosynthesis and respiration rates were 42 and10 fmol O2 cell 1 h 1 or 38 and 8.3 fmol C cell 1 h 1,respectively, assuming a photosynthetic quotient of1.2 (Table 1).
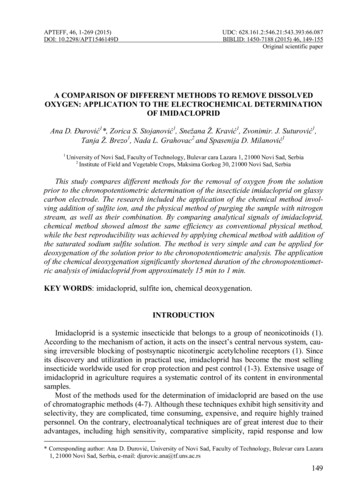
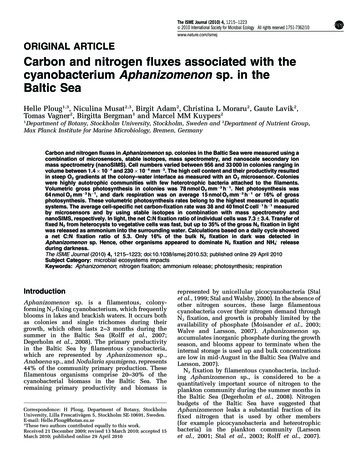
C- and N-fluxes in Aphanizomenon sp.H Ploug et al1219Table 1 Net photosynthesis and dark respiration in Aphanizomenon sp.MethodMicrosensor aNanoSIMSNet photosynthesisDark respirationnmol C m 1 h 1fmol C cell 1 h 1nmol C m 1 h 1fmol C cell 1 h 15.43840 12 1.3— 8.3—aAssuming a photosynthetic quotient of 1.2.Figure 4 Distribution of 12C14N (a, d, g), and 15N/14N (e, h), and 13C/12C (f, i) in single Aphanizomenon cells as measured by nanoSIMS.a–c: no label, d–f: t ¼ 3 h, g–i: t ¼ 6 h. The size bars are 2 mm.NanoSIMS analysis of colonies and filamentsincubated with stable isotopes of C and N showeda rapid transfer of 15N from heterocysts to vegetativecells. An example is shown in Figure 4. 13C carbonwas evenly distributed in vegetative cells after 3 hincubation time with only low assimilation intoheterocysts. Heterocysts were also less enriched in15N as compared with vegetative cells. The occurrence of N-storage products, for example cyanophycin, was detectable after 3 h as regions withlocally intense labeling of 15N (in cyanophycingranules). Hence, incorporation of 15N into proteinsof heterocysts seemed low, and most of the 15N labelwas transported to adjacent vegetative cells.Cell-specific assimilation rates of 13C and 15Nderived from nanoSIMS analysis and converted tototal net C and total net N assimilated by usingpercent labeling are shown in the bulk in Figure 5.These varied largely between single cells after 6 h.Less C relative to N was incorporated into heterocysts as compared with vegetative cells. In vegetative cells, the average cell-specific carbon assimilationrate was 40 12 fmol C cell 1 h 1, and the averagecell-specific N assimilation into biomass was4.8 3.2 fmol N cell 1 h 1 in light. Hence, the averagenet C:N assimilation ratio into individual vegetativecells was 7.3 3.4 in light (Table 2). Dark respirationwas 8.3 fmol C cell 1 h 1 and dark net N2-fixationrate was 0.28 0.15 fmol N cell 1 h 1.We tracked the release of fixed 15N by measuringthe production of 15NH4þ in the surrounding water(Table 2). The release of NH4þ was 35% of the totalgross N2 fixation in light. The corresponding valuewas 89% in darkness. The C:N ratio of grossThe ISME Journal
C- and N-fluxes in Aphanizomenon sp.H Ploug et al1220production (gross photosynthesis:gross N2 fixation)was, therefore, 6.3 (Table 2). The NH4þ microenvironment of colonies was modeled, knowing thediffusive properties of colonies from O2 measurements, the net carbon fluxes, the C:N fixation ratio,and fraction of fixed nitrogen released as NH4þ . TheNH4þ -concentration gradients in a colony with O2gradients similar to the colony shown in Figure 2 areshown in Figure 6. The NH4þ concentration at thecolony surface was 5.5 mM when the bulk concentration was 0.15 mM. Hence, ammonium was 437-foldenriched inside colonies as compared with the bulkwater concentration.DiscussionTotal C assimilation rate (fmol C cell-1 h-1)This study is the first to combine microsensors withmass spectrometry and nanoSIMS techniques tounderstand small-scale fluxes of carbon and nitrogen in a Baltic Sea cyanobacterium among thosedominating the summer blooms. It was directlyshown that Aphanizomenon is highly productiveeven during the late stage of its bloom and season inAugust. High concentrations of biomass in coloniesand their productivity lead to significant O2 gradients within these colonies and their surroundingwater. The O2 gradients measured during lightwere similar to those reported in culturedcolonies of Aphanizomenon sp. (Carlton and Pearl,1989). Volume-specific gross photosynthesis was79 nmol O2 mm 3 h 1 independent of colony size.Hence, there was no indication of diffusion limitation of photosynthesis by CO2 or bicarbonate inthese colonies. Volume-specific gross photosynthesis was 10- to 80-fold higher than those measuredin surface scums dominated by Nodularia sp. in theBaltic Sea (Ploug, 2008) and of other cyanobacterialsurface blooms including Aphanizomenon in inlandlakes (Ibelings and Maberly, 1998). This high rate isamong the highest reported in aquatic systems,comparable with or higher than those measured inshallow sediments and microbial mats (Jørgensenet al., 1983; Villbrant et al., 1990; Lassen et al.,1992).Carbon-specific net photosynthesis rates weresimilar to optimal rates reported using the 14Cmethod in field-sampled Aphanizomenon from theBaltic Sea (Walve and Larsson, 2007) as well as incultures of Aphanizomenon isolated from the BalticSea in the same area as that of this study (Degerholmet al., 2006). The 14C method provides an estimate ofphotosynthesis, which is usually considered torepresent a rate between gross and net photosynthesis (that is the net carbon retainment in the cell).Using microsensors, it was possible to determine net706050403020100024681012Total N assimilation rate (fmol N cell-1 h-1)Figure 5 Cell-specific carbon and N2-fixation rates as measuredby nanoSIMS. Vegetative cells are shown as open symbols, andheterocysts as closed symbols.Figure 6 Ammonium gradient at colony–water interface ofAphanizomenon colony modeled from measured O2 fluxes,C-, and N2-fixation rates, and NH4þ -release rates.Table 2 Gross and net C:N fixation ratio, N2-fixation rate, and net NH 4 -release rate in Aphanizomenon sp. traced byGross C:N fixation ratioNet C:N fixation ratioN2 net fixation rate (fmol N cell 1 h 1) a15NNH 4 -release rate (fmol N cell 1 h 1)LightLightLightDarkLightDark6.3b7.3 3.4c4.8 3.20.28 0.152.62.2aMeasured by nanoSIMS.Estimating from gross photosynthesis and gross N2 fixation (net N2 fixation NH 4 release).cNet C and net N2 fixation in light of the same cells measured by nanoSIMS.bThe ISME Journal
C- and N-fluxes in Aphanizomenon sp.H Ploug et al1221photosynthesis as well as dark respiration, andhence gross photosynthesis on single colonies ofwild Aphanizomenon sp. Light microscopy of DAPIstained colonies revealed that heterotrophic bacterial colonization of cyanobacterial filaments was low(B300 cells mm per filament; data not shown), asalso indicated by the observation that dark respiration, similar to photosynthesis, was proportional tocolony volume. Respiration was, therefore, mainlydue to the cyanobacterium investigated. On average,it comprised 16% of gross photosynthesis, whichpartly reflects the cost of N2 fixation. Cell-specificcarbon assimilation rates compared well betweenrates obtained with microsensor techniques directlyin colonies and the total C assimilation ratesobtained from 13C enrichment incubations.NanoSIMS analysis showed a large variation of cellspecific net C and N assimilation. This has also beenobserved in natural populations of other phototrophicmicroorganisms (Musat et al., 2008). Within trichomes, we measured a rapid transfer of fixednitrogen from heterocysts to vegetative cells alsoreported in Anabaena oscillarioides cultures (Popaet al., 2007). Generally, the 15N label intensity in theheterocysts was low compared with that of thevegetative cells. However, a faint label was evidentin this cell type already after 3 h, and a more distinct15N label after 6 h. This is particularly evident in the‘polar plugs,’ composed of cyanophycin (arginine:aspartic acid in a 1:1 ratio), which are located at thevegetative cell junctions. Hence, although some of thenitrogen fixed is retained in the heterocysts, the newlysynthesized products of N2 fixation is primarilyexported to the vegetative cells in which it apparentlymay be directed into three different routs: towardcellular growth, converted into cyanophycin (Nstorage), or being released extracellularly as ammonium to the environment. In Trichodesmium, the flowof fixed nitrogen into cyanophycin was also shown bynanoSIMS, and these granules may partly uncouple Cand N2 fixation from overall growth in cyanobacteria(Finzi-Hart et al., 2009). Moreover, ammonium andDON release in Trichodesmium spp. may amount toB50% of N2 fixation (Glibert and Bronk, 1994;Mulholland and Capone, 2001; Wannicke et al., 2009).The average net C:N assimilation ratio in singlecells measured by nanoSIMS was 7.3 3.4 in light,and a large fraction (35%) of the newly fixed N wasreleased as ammonium to the surrounding water.Hence, gross N2 fixation was approximately 1.5-foldhigher than net N2 fixation. Gross C:N fixationestimated from gross photosynthesis and gross N2fixation was 6.3 (Table 2). In the Baltic Sea, the C:Nratio of large (420 mm) cyanobacteria varies between6 and 20 (Degerholm et al., 2008). The net C:Nfixation ratio varies largely between 1 and 40presumably because of a variable NH4þ release bythe large cyanobacteria (Gallon et al., 2002). NetC- and N-fixation rates by large cyanobacteria are,therefore, not always closely coupled in the BalticSea. Our estimates of gross and net C:N fixation ratesin light, however, were close to a C:N ratio of 6.6.A high release of DOC or respiration of C could beexpected to maintain a lower somatic C:N ratio,when the C:N fixation ratio is high. Such high DOCrelease as reflected by a large difference betweenrates obtained with isotopes, which are incubatedfor 6 h, and those obtained using the microsensortechnique, which measures instantaneous photosynthesis, was not observed in our study and hasalso not been reported elsewhere. Aphanizomenonsp. seldom occurs in the uppermost water column,in which incident light intensities are highest(Hajdu et al., 2007). Integration over a day–nightcycle of 10 h:14 h at 3–4 m depth (Secchi depth was6 m, only) resulted in a lower net C:N fixation ratioof (10 38–14 8.3):(10 4.8 þ 14 0.28) ¼ 5.1, because N2-fixation rate is reduced and carbon isrespired during night.We are not aware of any reports on endogenousrhythms of C and N2 fixation in Aphanizomenon sp.as reported for Trichodesmium (Berman-Frank et al.,2001; Wannicke et al., 2009). However, net N2fixation by Aphanizomenon sp. was 17-fold lowerduring darkness as compared with that in light.Combined NanoSIMS and EA-IRMS analysis of 15Nuptake showed that N2 fixation by Aphanizomenonsp. represented 78% and 16% of the bulk N2 fixationduring light and darkness, respectively. Hence, 15N2fixation and the high 15NH4þ release in the bulkduring darkness can thus partly be ascribed to otherN2-fixing organisms.Our study directly shows that Aphanizomenonsp. leaks a substantial fraction of its fixed nitrogen asammonium to the surrounding water. Leakage ofammonium, however, could partly be due to breakage of cells during the incubations and filtrationprocedures or because of lysed cells. Microscopicanalysis and nanoSIMS images did not reveal asignificant number of broken cells. A recent studyusing alternative techniques without potential filtration artifacts has shown a similar high lightdependent ammonium release in Nodularia sp. inthe Baltic Sea (Ploug and Adam, unpublished). Inthis study, modeled NH4þ concentrations insideAphanizomenon colonies were 37-fold higher thanthat of the bulk (Figure 6), and such colonies couldpotentially be a microenvironment favorable forgrowth of heterotrophic bacteria. Many pelagicbacteria are motile, show chemotaxis toward aggregate nutrient sources, and their colonization timesare in the order of minutes (Kiørboe et al., 2002).However, bacterial colonization of Aphanizomenoncolonies was low (data not shown). O2 gradientsmeasured during dark were also less steep ascompared with those measured in cultured colonies(Carlton and Pearl, 1989). Lower abundance ofattached bacteria on Aphanizomenon colonies thanon Nodularia sp. has been obs
each colony was pipetted into a gridded Sedgewick Rafter counting chamber (Wildlife supply Company). Numbers and dimensions of dispersed filaments, vegetative cells, and heterocyst frequency (in no filament per length, and in percent of vegetative cells)ineachcolony wasmeasuredunderaninverted microscope (Zeiss, Switzerland) equipped with a