Transcription
Final ReportMay 13, 20082008 Indiana Action PlanPrepared forState of IndianaIndiana Office of Community and Rural AffairsIndiana Housing and Community Development AuthorityOne North Capital Avenue, Suite 600Indianapolis, Indiana 46204Prepared byBBC Research & Consulting3773 Cherry Creek N. Drive, Suite 850Denver, Colorado 80209-3827303.321.2547 fax 303.399.0448www.bbcresearch.combbc@bbcresearch.com
Table of ContentsMap of Indiana CountiesFrequently Used AcronymsExecutive SummaryI.Citizen Participation PlanFive-Year Consolidated Plan Participation Process . I–12008 Action Plan Participation Process . I–3Annual Performance Report. I–3Substantial Amendments . I–4Citizen Complaints . I–5OCRA Citizen Participation Requirements . I–5Key Informant and Citizen Input. I–5II.Housing and Community Development NeedsKey Informant Interviews. II–12008 Resident Survey . II–5III.Socioeconomic and Housing AnalysisPopulation Growth . III–1Population Characteristics . III–5Employment and Education . III–12Housing and Affordability . III–17Mortgage Lending and Home Loan Foreclosure . III–21Special Needs Population and Housing Statistics . III–24IV.2008 Action PlanApproach and Methodology . IV–1Five-Year Strategic Goals. IV–2Strategic Plan and Action Plan . IV–3Priority Needs . IV–17ADDI Funds . IV–18Performance Measurements . IV–19Other Resources to Fulfill Goals . IV–22Institutional Structure and Coordination . IV–25Monitoring Standards and Procedures . IV–27Program Income Update . IV–31Lead-based Paint Hazards . IV–32BBC R ESEARCH & C ONSULTINGi
IV.2008 Action Plan (CONTINUED)PHA Assistance . IV–33Barriers to Affordable Housing . IV–33Anti-Poverty Strategy . IV–35Discharge Policies . IV–36Obstacles to Meeting Needs . IV–36Action Plan Matrix. IV–37AppendicesA.Consolidated Plan Certifications and Forms .A–1B.Public Hearings and Public Comments . B–1C.CDBG 2008 Allocation Plan . C–1D. HOME and CDBG (Housing) 2008 Allocation Plans . D–1E.ESG Grant 2008 Allocation Plan . E–1F.HOPWA 2008 Allocation Plan . F–1G. HUD Tables . G–1iiBBC R ESEARCH & C ONSULTING
Map of Indiana CountiesBBC R ESEARCH & C ONSULTINGiii
Frequently Used AcronymsAcronymDefinitionAHPAffordable Housing Program—a grant program through the Federal Home Loan BankBMIRBelow market interest rateCAPCommunity Action Program agencyCBDOCommunity Based Development Organization—as defined by the CDBG regulations in 24CFR 570.204(c)CDBGCommunity Development Block Grant (24 CFR Part 570)CHDOCommunity housing development organization—a special kind of not-for-profit organizationthat is certified by the Indiana Housing and Community Development AuthorityCPD NoticeCommunity Planning and Development Notice—issued by the U.S. Department of Housingand Urban Development to provide further clarification on regulations associated withadministering HUD grantsCoCContinuum of Care—a federal program providing funding for homeless programsESGEmergency Shelter Grant—operating grants for emergency shelters. Applied for through theIHCDAFEMAFederal Emergency Management AgencyFHLBIFederal Home Loan Bank of IndianapolisFirst HomeSingle family mortgage program through IHCDA that combines HOME dollars for downpayment assistance with a below market interest rate mortgageFMRFair market rentsFMVFair market value, generally of for-sale propertiesFSP MemoFederal and State Programs Memo—issued by IHCDA to provide clarification or updatedinformation regarding grant programs IHCDA administersFSSAFamily and Social Services AdministrationGIMGrant Implementation Manual—given to all IHCDA grantees at the start-up training. Itprovides guidance on the requirements of administering IHCDA grantsHOC/DPAHomeownership Counseling/Down Payment AssistanceHOMEHOME Investment Partnerships Program (24 CFR Part 92)HOPWAHousing Opportunities for Persons With AIDS—grant program awarded by HUD andadministered by the IHCDAHUDU.S. Department of Housing and Urban DevelopmentICHHIIndiana Coalition on Housing and Homeless Issues, Inc.IDEMIndiana Department of Environmental ManagementIFAIndiana Finance AuthorityIHCDAIndiana Housing and Community Development AuthorityivBBC R ESEARCH & C ONSULTING
AcronymDefinitionLIHTFLow Income Housing Trust FundMBEMinority Business Enterprise—certified by the State Department of AdministrationNAHANational Affordable Housing Act of 1990—federal legislation that created the HOMEInvestment Partnerships ProgramNCNew constructionNOFANotice of Funds AvailabilityOCRAIndiana Office of Community and Rural AffairsOOROwner-occupied rehabilitationPITIPrincipal, interest, taxes, and insurance—the four components that make up a typicalmortgage paymentQCTQualified census tractRFPRequest for ProposalsRHTCRental Housing Tax Credits (also called Low Income Housing Tax Credits or LIHTC)S CShelter Plus Care - part of the McKinney grant that is applied for directly to HUD throughthe SuperNOFA applicationSHPSupportive Housing Program - part of the McKinney grant that is applied for directly toHUD through the SuperNOFA applicationSROSingle room occupancySuperNOFANotice of Funds Availability issued by HUD for a number of grant programs. It is an annualawards competition. Shelter Plus Care and Supportive Housing Program and theContinuum of Care are some of the programs applied for through this application process.TBRATenant-Based Rental AssistanceTPCTotal project costsURAUniform Relocation ActWBEWomen Business Enterprise—certified by the State Department of AdministrationBBC R ESEARCH & C ONSULTINGv
EXECUTIVE SUMMARY
EXECUTIVE SUMMARYEach year the State of Indiana is eligible to receive grant funds from the U.S. Department of Housing andUrban Development (HUD) to help address housing and community development needs statewide. Thedollars are primarily meant for investment in the State’s less populated and rural areas, which do not1receive such funds directly from HUD .HUD requires that any state or local jurisdiction that receives block grant funds prepare a report called aConsolidated Plan every three to five years. The Consolidated Plan is a research document that identifiesa state’s, county’s or city’s housing and community development needs. It also contains a strategic plan toguide how the HUD block grants will be used during the Consolidated Planning period.In addition to the Consolidated Plan, every year states and local jurisdictions must prepare two otherdocuments related to the Consolidated Plan:Annual Action Plan—this document details how the HUD block grants are planned to beallocated to meet a state’s/county’s/city’s housing and community development needs; andConsolidated Annual Performance and Evaluation Report (CAPER)—thisdocument reports how each year’s dollars were actually allocated and where the actualallocation varied from what was planned.This report is the State of Indiana’s 2008 Action Plan. The State of Indiana Five-Year Consolidated Planwas prepared in 2005, and covers the years from 2005 through 2009. The 2008 Action Plan reportcontains a plan for how the State proposes to allocate the CDBG, HOME, ADDI, ESG and HOPWAduring the 2008 program year, July 1, 2008 to June 30, 2009.Compliance with Consolidated Plan RegulationsThe State of Indiana’s Five-Year Consolidated Plan and 2008 Action Plan were prepared in accordancewith Sections 91.300 through 91.330 of the U.S. Department of Housing and Urban Development’sConsolidated Plan regulations.Lead and Participating AgenciesThe Indiana Office of Community and Rural Affairs (OCRA) and the Indiana Housing and CommunityDevelopment Authority (IHCDA) are the lead agencies responsible for overseeing the development of the2008 Action Plan. OCRA administers the State’s CDBG grant. IHCDA administers the State’s HOME,ADDI, ESG and HOPWA grant programs.1Some cities and counties in Indiana, mostly because of their size, are able to receive HUD grant dollars for housing andcommunity development directly. These “entitlement” areas must complete a Consolidated Plan separately from the State’s toreceive funding. The entitlement areas in Indiana include the cities of Anderson, Bloomington, Carmel, Columbus, EastChicago, Elkhart, Evansville, Fort Wayne, Gary, Goshen, Hammond, Indianapolis, Kokomo, La Porte, Lafayette, MichiganCity, Mishawaka, Muncie, New Albany, South Bend, Terre Haute, West Lafayette, Hamilton County and Lake County.BBC R ESEARCH & C ONSULTINGE XECUTIVE S UMMARY , P AGE 1
The State of Indiana retained BBC Research & Consulting (BBC), an economic research and consultingfirm specializing in housing research, to assist in the preparation of the 2008 Action Plan. BBC workedwith the Indiana minority-owned business Engaging Solutions and Indiana women-owned businessBriljent to complete the 2008 Action Plan.Citizen Participation Process and ConsultationThe State’s Five-Year Consolidated Plan was developed with a strong emphasis on community input.Citizens were able to share their opinions about the State’s housing and community development needs innumerous ways including:A targeted survey of low-income citizens, citizens receiving public housing assistance andcitizens with special needs;A key person/organization survey sent to approximately 1,800 stakeholders in the State’snonentitlement areas; andA telephone survey, the Indiana Rural Poll, conducted of Indiana residents living outside ofIndiana’s urbanized areas.2008 Action Plan. Citizens had the opportunity to comment on the draft 2008 Action Plan forthCDBG, HOME, ADDI, ESG and HOPWA through two public hearings held on April 25 during the30-day public comment period, April 1 through April 30, 2008. In addition, residents completed a surveyand stakeholders were consulted about the State’s greatest needs and encouraged to provide comments onthe Action Plan through personal interviews conducted in February 2008.Acceptance of public comments. The State of Indiana accepted public comments on the draft 2008Action Plan between April 1 and April 30, 2008. All of the comments received—both verbal andwritten—are appended to the Action Plan, unless otherwise requested by the commenter.Updated Research FindingsThis section contains relevant demographic, housing market and community development data andinformation that have been released since the preparation of the State’s Five-Year Consolidated Plan.Trends in Housing and Community DevelopmentPopulation Growth. Indiana’s 2007 population was estimated to be 6,345,289. Despite an increasefrom 2000 (6,080,485) and last year’s estimate of 6,313,520, the state’s population growth has slowed.Between 1990 and 2000, the state grew at average annual rate of 1.0 percent per year. Between 2000 and2007, the state grew at an average annual growth rate of 0.6 percent.From a regional perspective, Indiana grew most similarly to Kentucky. Indiana’s population increased 4.4percent between 2000 and 2007, compared to Kentucky’s population increase of 4.9 percent. Ohio’spopulation increase of 1.0 percent during 2000 to 2007 made it the slowest growing of Indiana’sneighboring states.E XECUTIVE S UMMARY , P AGE 2BBC R ESEARCH & C ONSULTING
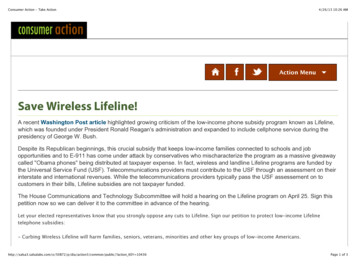
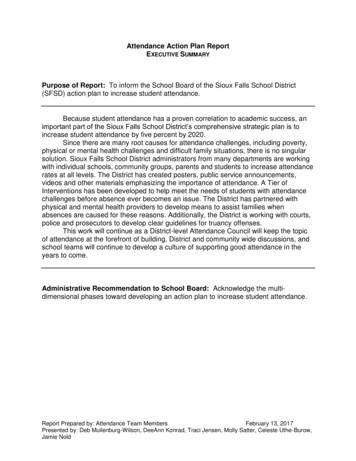
City and County growth rates Many of Indiana’s top twenty growth cities were located in the ninecounties that comprise the Indianapolis region, indicating that suburban metropolitan communities areabsorbing much of Indiana’s new growth. The fastest declining cities in Indiana, based on numeric2population losses, were Evansville, Gary, Hammond, and South Bend, respectively . Many of Indiana’ssmaller communities also experienced declines in population. Four of the five largest population losses, on3a percentage basis, were located in Grant County .Exhibit ES-1 depicts county-specific growth patterns between 2000 and 2006. The entitlement countiesof Lake and Hamilton experienced population growth overall; however, as can be seen in Exhibit ES-2,fourteen of the twenty-one entitlement cities in Indiana experienced population declines. Counties nearlarge metropolitan areas grew at rates faster than Indiana as a whole, while counties with decliningpopulations were seen east and north of the Indianapolis MSA and along the western border shared withIllinois.2Rachel Justis, Indiana Business Research Center, Kelley School of Business, Indiana University, “Population Change in IndianaCities and Towns, 2000 to 2006,” Indiana Business Research Center, Kelley School of Business, Indiana University, August 2007.3Ibid.BBC R ESEARCH & C ONSULTINGE XECUTIVE S UMMARY , P AGE 3
Exhibit ES-1.PopulationChange ofIndianaCounties,2000 to 2006Note:Indiana’s population changewas 3.8 percent from 2000 to2006.Source:U.S. Census Bureau’sPopulation Estimates and BBCResearch & Consulting.E XECUTIVE S UMMARY , P AGE 4BBC R ESEARCH & C ONSULTING
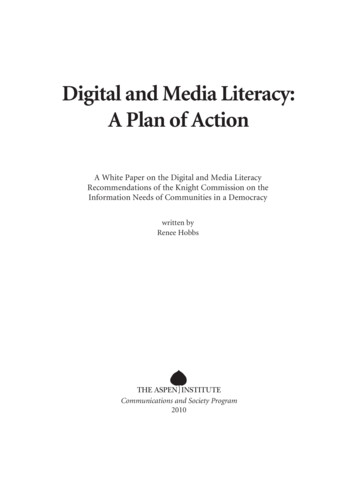
Exhibit ES-2 shows population growth from 2000 to 2006 in Community Development Block Grant(CDBG) entitlement and non-entitlement areas. As of 2006, 58 percent of Indiana’s total populationresides outside of CDBG entitlement areas. Higher growth was seen in non-entitlement areas (4.9percent) from 2000-2006 compared to entitlement area growth (2.4 percent) during the same timeperiod.Exhibit ES-2.2000 to 2006Population GrowthNumber2000PercentNumber2006PercentPercent Change2000 - mbus, Michigan City, LaPorteand Hamilton County are included asentitlement areas. The cities of BeechGrove, Lawrence, Speedway,Southport and the part of the Town ofCumberland located within HancockCounty are not considered part of theIndianapolis entitlement community.Applicants that serve these areaswould be eligible for CHDO Worksfunding. HOME entitlement areasinclude: Bloomington, Each Chicago,Evansville, Fort Wayne, Gary,Hammond, Indianapolis, LakeCounty, St. Joseph CountyConsortium, Terre Haute, TippecanoeCounty 4.9%CDBG Entitlement2,587,33643%2,649,05342%2.4%Source:U.S. Census Bureau’s 2000 Censusand 2006 Population Estimates.CDBG Entitlement Areas:Hamilton County185,422250,979Lake County484,687494,2022.0%32,34030,594-5.4%East ChicagoGaryHammondBalance of Lake 2,53852,7480.4%Evansville121,156115,738-4.5%Ft. ,5970.5%-1.4%GoshenIndianapolis (balance)BBC R ESEARCH & C 2440.1%LaPorte21,60921,231-1.7%Michigan ie67,92265,287-3.9%-2.3%New Albany37,83936,963South Bend108,241104,905-3.1%Terre Haute59,50657,259-3.8%West Lafayette28,67528,9971.1%E XECUTIVE S UMMARY , P AGE 5
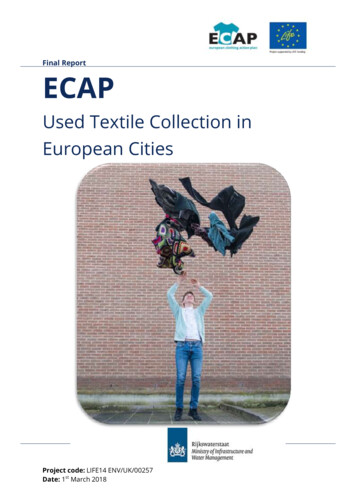
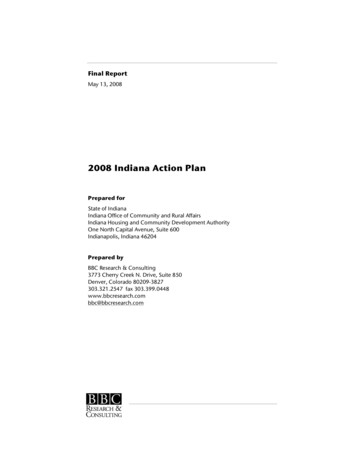
Components of population change. Exhibit ES-3 shows the components of the population change for2001 through 2007. Population growth from 2000 to 2007 has primarily been attributed to naturalincrease. However, the State saw an increase in net migration in 2005 and 2006 from previous years. Netmigration decreased in 2007.Exhibit ES-3.Components ofPopulation Change inIndiana, 2001 to :Population changes for each year are fromJuly 1 to July 1 of the next year. The 2000population change is not included becauseit is from April 1 to July 1 of 2000.Natural increase is births minus deaths.Source:U.S. Census Bureau’s Population 12007Future growth. The Indiana Business Research Center (IBRC) projects a State population of 6,417,198in 2010. This equates to an average annual growth rate of less than 0.5 percent from 2007 to 2010, whichis less than half of the average annual growth rate experienced in the prior decade and from 2000 through2007. Thus, growth in Indiana is slowing.Age. In 2006, Indiana’s median age was estimated to be 36.3, compared to 35.2 in 2000 and 35.9 in2005. In 2006, approximately 63 percent of the State’s population was between the ages of 18 and 64years. Overall, 12
Citizens were able to share their opinions about the State’s housing and community development needs in numerous ways including: A targeted survey of low-income citizens, citizens receiving public housing assistance and citizens with special needs; A key person/organization surve