Transcription
Received: 27 March 2017 Revised: 22 October 2017 Accepted: 24 October 2017DOI: 10.1002/ajpa.23356RESEARCH ARTICLEBody size and allometric variation in facial shape in childrenJacinda R. Larson1 Mange F. Manyama2,3 Joanne B. Cole4,5 Paula N. Gonzalez6 Christopher J. Percival7 Denise K. Liberton10 Tracey M. Ferrara5 Sheri L. Riccardi5 Emmanuel A. Kimwaga3 Joshua Mathayo3 Jared A. Spitzmacher8 Campbell Rolian11,12 Heather A. Jamniczky1,12 Seth M. Weinberg9 Charles C. Roseman13 Ophir Klein14 Ken Lukowiak15 Richard A. Spritz5 Benedikt Hallgrimsson1,12,161Department of Cell Biology & Anatomy, Cumming School of Medicine, University of Calgary, Calgary, Canada2Division of Medical Education, Weill Cornell Medicine - Qatar, Doha, Qatar3Department of Anatomy, Catholic University of Health and Allied Science, Mwanza, Tanzania4Broad Institute of MIT and Harvard, Cambridge, Massachusetts5Human Medical Genetics and Genomics Program and Department of Pediatrics, University of Colorado School of Medicine, Aurora, Colorado6Department of Anthropology, University of La Plata, La Plata, Argentina7Department of Anthropology, Stony Brook University, Stony Brook, New York, USA8School of Pharmacy, University of Alberta, Edmonton, Canada9Department of Oral Biology, School of Dental Medicine, University of Pittsburgh, Pittsburgh, USA10National Institute of Dental and Craniofacial Research, National Institutes of Health, Bethesda, Maryland11Department of Comparative Biology & Experimental Medicine, Faculty of Veterinary Medicine, University of Calgary, Calgary, Alberta, Canada12McCaig Institute for Bone and Joint Health, University of Calgary, Calgary, Canada13Department of Animal Biology, College of Liberal Arts and Science, University of Illinois, Urbana-Champaign, Urbana, Illinois14Departments of Orofacial Sciences and Pediatrics, and Program in Craniofacial Biology, University of California San Francisco, San Francisco, California15Department of Physiology & Pharmacology and the Hotchkiss Brain Institute, Cumming School of Medicine, University of Calgary, Calgary, Alberta, Canada16Alberta Children’s Hospital Research Institute, Cumming School of Medicine, University of Calgary, Calgary, CanadaCorrespondenceBenedikt Hallgrimsson, Department of CellBiology & Anatomy, Faculty of Medicine,University of Calgary, 3330 Hospital DriveNW, Calgary, Alberta T2N 4N1, CanadaEmail: bhallgri@ucalgary.caAbstractObjectives: Morphological integration, or the tendency for covariation, is commonly seen incomplex traits such as the human face. The effects of growth on shape, or allometry, represent a ubiquitous but poorly understood axis of integration. We address the question of towhat extent age and measures of size converge on a single pattern of allometry for humanFunding informationNIH-NIDCR, Grant/Award Number:U01DE020054 U01DE020078; NSERC;Grant/Award Number: 238992-17; the University of Calgary UIRG.facial shape.Methods: Our study is based on two large cross-sectional cohorts of children, one from Tanzaniaand the other from the United States (N 5 7,173). We employ 3D facial imaging and geometricmorphometrics to relate facial shape to age and anthropometric measures.Results: The two populations differ significantly in facial shape, but the magnitude of this difference is small relative to the variation within each group. Allometric variation for facial shape issimilar in both populations, representing a small but significant proportion of total variation in facialshape. Different measures of size are associated with overlapping but statistically distinct aspectsof shape variation. Only half of the size-related variation in facial shape can be explained by theAm J Phys Anthropol. ajpaC 2017 Wiley Periodicals, Inc.V 327
328 LARSONET AL.first principal component of four size measures and age while the remainder associates distinctlywith individual measures.Conclusions: Allometric variation in the human face is complex and should not be regarded as asingular effect. This finding has important implications for how size is treated in studies of humanfacial shape and for the developmental basis for allometric variation more generally.KEYWORDSallometry, 3D facial imaging, face shape, growth, human, morphometrics1 INTRODUCTIONAn assumption made in many morphometric analyses is that the appropriate measure of size is the size of the anatomical structure analyzed,Most morphological structures are integrated (Olson and Miller, 1958),usually quantified as the centroid size of a landmark configuration (Klin-meaning that they tend to covary, driven by variation in developmentalgenberg and Marugan-Lobon, 2013). But centroid size is a very differ-processes (Hallgrimsson et al., 2009). This is the case for the face andent biological measure when quantifying an entire organism, such as acraniofacial complex in humans and other vertebrates (Bastir, 2008;trilobite fossil (Webster and Zelditch, 2005), versus a human skull (Mar-Porto, de Oliveira, Shirai, De Conto, & Marroig, 2009). Variation in thetinez-Abadias et al., 2012) or an individual tooth (Polychronis et al.,growth of the chondrocranium (Bastir and Rosas, 2006; Bastir, Rosas,2013). Yet, many studies treat the shape correlates of centroid size in& O’higgins, 2006; Hallgrimsson et al., 2006; Parsons, Downey, Jirik,these different contexts as if they reflect the same kind of biologicalHallgrimsson, & Jamniczky, 2015) or the brain (Lieberman, Hallgríms-variation. For the human face, is the appropriate measure the length,son, Liu, Parsons, & Jamniczky, 2008; Marcucio, Young, Hu, &width, or area of the face, head circumference, or some measure ofHallgrimsson, 2011; Parsons et al., 2011) are major developmentalbody size? To answer this question, we must understand how variousdeterminants of covariation patterns for craniofacial morphology.measures of growth and age relate to shape variation for the structureSomatic growth is likely to be another such determinant, because mor-of interest. If allometric variation reflects the shape consequences ofphology tends to be related to size. For most anatomical structures,variation in a single underlying growth parameter, then the shape cor-shapes and proportions have a regular relationship to size (Jolicoeur,relates of different size measures should converge on a single covaria-1963). Taller people tend to have longer, more prognathic facestion pattern. If this is not the case, then we cannot assume that(Baume, Buschang, & Weinstein, 1983; Mitteroecker, Gunz, Windh-allometric variation quantified based on different measures of size areager, & Schaefer, 2013). The specific relationship between shape andcapturing homologous biological variation.size is termed “allometry” (Klingenberg, 2016; Klingenberg and Zimmer-Here, we address the relationship between various measures ofmann, 1992). Many genetic and environmental influences affect growthsize and age to facial shape in two previously described cross-sectionalas well as other aspects of facial development. To disentangle the cor-cohorts of children, one comprised of Bantu speaking groups in north-related effects of size from other more specific effects, it is necessarywest Tanzania (Cole et al., 2016) and the other comprised of Americansto understand the role of allometric variation.of predominantly European ancestry (Shaffer et al., 2016). We compareAllometry is typically divided into ontogenetic versus static components. Ontogenetic allometry is the shape variation that correlates withage or developmental stage. Static allometry is the shape variation thatcorrelates with size, controlling for age or stage (German and Meyers,1989). Allometry is a special case of morphological integration (Magwene and Westneat, 2001), which refers to the tendency for structuresto covary because developmental processes tend to affect multipletraits (Hallgrimsson et al., 2009). For allometric variation, the processassumed to produce these correlated effects is growth.the shape correlates of age, two measures of somatic size (stature andbody mass), and two local measures of head size (face size and head circumference). These measures are selected to capture disparate growthrelated effects. Age represents ontogenetic effects. Stature reflects longitudinal growth while body mass captures overall somatic growth.Face size is related to local growth of the face while head circumference is influenced by overall head and brain size. Brain growth is knownto influence craniofacial shape (Aldridge et al., 2005; Hill et al., 2013;Marcucio, Hallgrimsson, & Young, 2015; Marcucio et al., 2011).A challenge to the study of allometry is that there are often multiple ways to quantify both growth and size for most anatomical structures. Ontogenetic allometry is complicated when developmental timeand stage or rate become dissociated. This can occur when mutationsaffect developmental rate in addition to other phenotypic effects2 MATERIALS AND METHODS2.1 Sample collection(Gonzalez, Kristensen, Morck, Boyd, & Hallgrimsson, 2013; Wang andThe cohort of 5,961 Tanzanian children of self-identified Bantu originDiewert, 1992). Further, the biological meaning of size is often unclear.(3,342 female, 2,619 male) has been described in detail previously (Cole
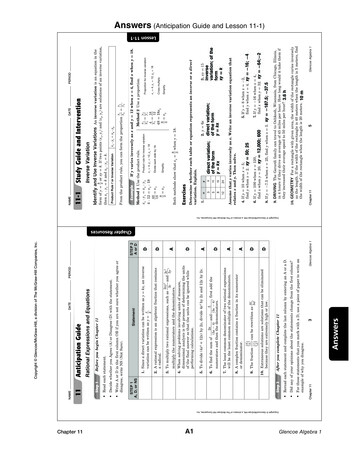
LARSON ET AL.329et al., 2016, 2017). Subject ages were 3 to 23 years (mean 10.8 6 2.8years; females, 10.7 6 2.7 years; males, 10.9 6 2.8 years). All participants were examined by a physician (M.M.) to exclude subjects withany birth defects, history of facial surgery or interventionist orthodontictreatment, or first-degree relatives with craniofacial abnormalities.The cohort of 1,212 North American children (609 female, 603male) has also been described in detail previously (Shaffer et al. 2016).In this sample, we included only children who self-identified as “white”using the NIH “racial and ethnic categories” for recruitment and consenting of research subjects NOT-OD-15-089.html). European ancestry was confirmedfrom genomic data (Shaffer et al., 2016). Ages were 3 to 18 years(mean 9.0 6 4.1 years; females, 9.2 6 4.2 years; males, 8.9 6 3.9years). Participants in the North American sample were screened usingAnatomical Landmarks. 29 landmarks as placed on the3D facial photo scans. Corresponds to anatomical descriptions inTable 1FIGURE 1exclusion criteria similar to the Tanzanian cohort.The full set of anthropometric measurements of height, weight, andeach individual image to the template. Once the full dataset is regis-head circumference were obtained for a subsample of 4,239 Tanzaniantered to the template, the program transfers 29 landmarks are thensubjects, taking the average of two sequential measurements. Heighttransferred to each face and their positions calculated from the trans-was measured in centimeters using a standard stadiometer; body weightformation matrix used to warp each face to the template.was measured in kilograms using a digital body weight scale. Head cir-The template was created from a set of 50 images of Tanzaniancumference was measured in centimeters using a standard ribbon meas-children that had been manually landmarked (Li et al., 2017). The sam-uring tape, with the measuring tape placed approximately twople size for the template generation, while somewhat arbitrary, iscentimeters above the supraorbital ridge. The same anthropometricintended to ensure that the 29 landmarks are placed accurately on themeasurements were obtained for roughly half of the North Americantemplate and that morphology of the template falls close to the meansubjects from Denver and San Francisco (N 5 343) while head circumfer-of the sample to be landmarked. Importantly, the template does notence was not obtained for the Pittsburgh subjects (N 5 506). Only thehave to be exactly at the mean. It is only when an individual surface issample for which all anthropometric measures were available wasvery different from the template, that automated landmarking results inincluded in the analyses of allometry (N 5 4,582, F 5 2,525, M 5 2,057).a bias towards the landmark positions of the template (Li et al., 2017).Ethical approval was granted by the Tanzania National Institute forMedical Research (NIMR/HQ/R.8a/Vol.IX/845), and the University ofThis effect is only detectable for individuals that fall far ( 3SD) fromthe mean.Calgary (CHREB 21741), the University of Colorado (09–0731) and theWe used a single template for the combined dataset. Using sepa-University of Pittsburgh (No. PRO09060553 and No. RB0405013).rate templates for the two populations would create an artifactual dif-Informed written consent was obtained from the parents and guardiansference between them. Since the landmark positions on the templateof all participants, prior to participation in the study.determine the point at which the landmarks are transferred from theNeither cohort is assumed to be representative of any biologicallytemplate to each individual, any difference in landmark position bet-definable racial or ethnic category, nor do we assume that such catego-ween the two templates would translate into an artifact. The use of aries exist in a biological sense (Edgar and Hunley, 2009; Hunley, Healy,single template in this case is justifiable because the shape variation of& Long, 2009). Rather, these cohorts sample two populations in whichthe two samples overlaps extensively. We corrected for superficial arti-within-sample heterogeneity due to ancestry has been minimized tofacts due to smiling, squinting, and open mouth using canonical variatessome degree.analysis. This results in a continuous correction for these effects asdescribed and validated in Cole et al. (2016). Further, we corrected for2.2 3D imaging and automated 3D landmarkingsmall differences between cameras. White light photogrammetry wasperformed using two models of Creaform cameras (Megacapturor and3D facial surface images were captured and processed as describedpreviously in Cole et al. (2016) and Shaffer et al. (2016). Analysis ofGemini). These effects and the methods used to validate these corrections are described in supplementary data in Cole et al. (2016).facial shape and size were based on 29 landmarks that were obtainedusing a novel automated landmarking method (Figure 1, Table 1 (Liet al., 2017). In this method, a set of 17 control points are automatically2.3 Morphometric analysisdetected from learned features of the face surface maps. These pointsWe performed geometric morphometric analyses using R Developmentare then used to register each face to a template, after which the faceCore Team (2014) and MorphoJ v1.04a (Klingenberg, 2011). Landmarksis warped to the template using a thin-plate spline based algorithm.were subjected to Procrustes Superimposition to rescale to unit cent-The learning step is used only to improve the automated identificationroid size, translate to standard position, and rotate to standard orienta-of the 17 control points which are used to anchor the registration oftion (Rohlf, 1999). For all analyses described here, the groups included
330 T AB LE 1LARSONET AL.Anatomical landmarks3D landmark nameAbbreviationsDefinitionsNasionnMidline point in where the frontal and nasal bones contact (nasofrontal suture).Corresponds to the underlying bony landmark.PronasaleprnMidline point marking the maximum protrusion of the nasal tip.SubnasalesnMidline point marking the junction between the inferior border of the nasalseptum and the cutaneous upper lip. It is the apex of the nasolabial angle.Labiale SuperiuslsMidline point of the vermilion border of the upper lip, at the base of the philtrum.StomionstoMidpoint of the labial fissure.Labiale InferiusliMidline point of the vermilion border of the lower lip.SublabialeslMidpoint along the inferior margin of the cutaneous lower lip (labiomental sulcus).GnathiongnMidline point on the inferior border of the mandible. Corresponds to theunderlying bony landmark.Endocanthion (Right)en rApex of the angle formed at the inner corner of the palpebral fissure where theupper and lower eyelids meet.Endocanthion (Left)en lSame as aboveExocanthion (Right)ex rApex of the angle formed at the outer corner of the palpebral fissure where theupper and lower eyelids meet.Exocanthion (Left)ex lSame as aboveAlare (Right)al rMost lateral point on the nasal ala.Alare (Left)al lSame as aboveAlar Curvature Point (Right)ac rMost posterolateral point on the alar cartilage, located within the crease formedby the union of the alar cartilage and the skin of the cheek.Alar Curvature Point (Left)ac lSame as aboveSubalare (Right)sbal rPoint located at the lower margin of the nasal ala, where the cartilage insterts inthe cutaneous upper lip.Subalare (Left)sbal lSame as aboveCrista Philtri (Right)cph rPoint marking the lateral crest of the philtrum at the vermilion border of theupper lipCrista Philtri (Left)cph lSame as aboveChelion (Right)ch rPoint marking the lateral extent of the labial fissure.Chelion (Left)ch lSame as aboveTragion (Right)t rPoint marking the notch at the superior margin of the tragus, where the cartialgemeets the skin of the face.Tragion (Left)t lSame as aboveSuperior Alar Groove(Right)supa rMost superior portion of alar groove.Superior Alar Groove (Left)supa lSame as aboveZygion (Right)z rMost prominent portion of zygomatic archZygion (Left)Z lSame as abovePogonionPMost prominent portion of chin, anatomical pogonion.Anatomical descriptions and variable names of 29 landmarks used in the study. As referenced from http://www.facebase.org. Corresponds to Figure 1.in each separate analysis are subjected to the same Procrustesthe Geomorph R package, version 3.0.3 (Adams and Otarola-Castillo,superimposition.2013). We used Geomorph’s procD.lm function to perform ProcrustesTo estimate the relative proportions of shape variation attributableANOVA with permutation procedures, to assess shape variation andto size and growth measures and their interactions within each cohort,patterns of co-variation, and we thereby built a statistical model towe used a linear model built in R Development Core Team (2014) withquantify the relative amount of facial shape variation attributable to
LARSON ET AL.331age, centroid size, height, weight, head circumference, sex, and theage including their interactions were removed using multiple linearinteractions between these variables. Since procD.lm uses Type 1regression. We then projected those data on to the regression for eachsums-of-squares, we alternated the position of the last variable insize/age variable using the coefficients for each variable from theirsequential regressions to accurately estimate percentage varianceregression on the original data scaled to value of the independent vari-attributable to each variable. To visualize the shape effects of age,able for each individual. This creates separate datasets for the condi-centroid size, height, weight, head circumference and sex, regressiontional variation for each variable. We then obtained the first PC of thescores were computed for the model using the RegScore function from5 measures of size and age. Using a linear multiple model as imple-the R Morpho package, version 2.4.1.1 (Schlager, 2017). Separate Pro-mented in the Geomorph ProcD.allometry function in R, we regressedcrustes fits were performed for each population for the within-the conditional variation datasets on the size/age PC1 and comparedpopulation analyses only. All analyses of the combined data involved aslopes and variance explained for each dataset. This analysis tests thesingle, combined Procrustes fit.extent to which each size/age variable is associated with similar magni-To describe variation in facial shape independent of size and age intudes and directions of shape variation in the face.both populations, we regressed out the main and interaction effects forIn the second approach, we performed regressions of the sex andthe size and age measures on the combined dataset, and re-centeredpopulation corrected data on each variable separately. This approachthe resulting residuals on each population mean. We then used princi-uses the original data rather than the conditional variation datasetspal components (PCs) analysis to describe this variation. Thin-plate-used in the first approach. We then obtained the vectors that corre-spline warps were constructed using Landmark software (Wiley et al.,spond to these regressions from the regression coefficients and calcu-2005) for the first five PC axes. The face morphs were based on a tem-lated the angles among them. To compare these vectors, we resampledplate that was created from a random sample of 50 individuals varyingthe sex and population adjusted data with replacement and obtainedin age and sex (Li et al., 2017). This template was then morphed to thethe full set of vectors at each resampling iteration. This was imple-overall sample mean and the resulting face was used to visualize themented using AngleTest in the Morpho package for R (Schlager, 2017).variation in the sample. Heat maps to visualize the areas of greatestThis approach thus compared the specific shape variation associatedshape differences were constructed using the meshdist function in thewith each independent variable. Although this method is also based onMorpho package for R (Schlager, 2017). Separate principal componentregression coefficients, it differs from the first approach in that it per-analyses (PCAs) were performed for the Tanzanian and North Americanmutes the angles among vectors for each landmark and allows for ansamples.intuitive visualization of the angles.We also tested the effects of random error in the age values in theThese two analyses essentially converge on an assessment of colli-Tanzanian data on our estimates of allometric variation in face shape.nearity or multicollinearity among the measures of age and size. If theTo do this, we applied three models to the North American data, forvariables are capturing the same latent biological variable, a straightfor-which exact ages are available. The first uses the exact age, the secondward application of a linear model will not disentangle their effects.averages to the nearest whole year and the third to the closest 3-yearOur strategy in these three methods is to quantify and compare theinterval.directions and magnitudes of the main effects associated with eachBefore combining the Tanzanian and North American cohorts forvariable by isolating them using a conditional variation approach. Com-further analysis, we first determined the variation due to sex and popu-plete collinearity would result in parallel results across the conditionallation using a multiple analysis of variance model for these factors andvariation datasets.their interactions in the combined sample. This was implemented in theFinally, we asked to what extent the five measures converge on aGeomorph package for R (Adams, Collyer, Otarola-Castillo, & Sherratt,single underlying allometry factor. To determine the proportion of vari-2014; Collyer, Adams, Otarola-Castillo, & Sherratt, 2015). We thenation in facial shape explained jointly by all five measures, we per-removed ethnic group and sex from the analysis by centering the resid-formed a PCA for age and the four measures of size. We then used theuals from this model on the sample grand mean. We quantified andvisualized the shape variation associated with each size measure anddata corrected for sex and population and estimated the proportion ofvariation in facial shape explained by each size/age PC.age using multiple linear regression implemented in Geomorph. Morphsand heatmaps were created in R using the Morpho package (Schlager,2017).Facial shape is likely to relate nonlinearly to measures of age andsize. To determine whether the departures from linearity are sufficiently large to invalidate a linear regression approach, we comparedregressions with up to five polynomial terms for all variables.3 RESULTS3.1 Facial shape variation related to measuresof size and ageTo assess the relative proportion of facial shape variation attributableIn the combined Tanzanian and North American cohorts, we testedto the size/age variables (age, centroid size, height, weight, head cir-whether measures of size and age were associated with distinct effectscumference, sex) as well as the interactions among them, we applied aon face shape. We took two approaches to this question. The firstlinear model to the Procrustes coordinate data for each population.compares the conditional variation for each size/age variable. Here, weUnbiased estimates of the variance as determined by randomizing thecreated a dataset in which the shape effects of all size variables andorder of factors are shown in Table 2 for the Tanzanian Cohort. We
332 T AB LE 2LARSONET AL.Tanzanian procrustes ANOVA 01Height10.1870.1870.0032.001Head circumference10.0920.0920.0108.001Centroid ge * Centroid size10.0090.0090.0009.001Head Circumference * Centroid size10.0060.0060.0006.004Height * Weight10.0150.0150.0014.001Height * Age10.0050.0050.0005.008Head Circumference * Height10.0020.0020.0002NSHeight * Age10.0050.0050.0005.012Head Circumference * Height * 1310.51Relative proportion of variation attributable to several allometric measures. Corresponds to Figure 3.found that age, centroid size, height, weight, head circumference andsex all had significant effects (p 5 .001 for all) on facial shape variation.Centroid size captured approximately 4.5% (r2 5 0.045) of the shapevariation, while weight captured 1.2% (r2 5 0.012) and head circumference captured approximately 1% (r2 5 0.010). Height (r2 5 0.003) andage (r2 5 0.001) by this model explained 1% of the total variation.Figure 2 shows visualization of the related facial shape variation. Similarpatterns were observed in our North American cohort (Figure 3).Since the Tanzanian ages are self-reported, we determined thesensitivity of these result to random error in the age data by degradingthe age values in the North American data to one, two and three yearintervals. In the exact-age model, age explained 1% of the total variation (r2 5 0.01), while centroid size explained 3.9% (r2 5 0.039). TheseThin-plate spline warps of Tanzanian allometricvariation. Thin-plate spline warps showing variation across age,centroid size, head circumference, height, and weight. Negativeend of the axis of variation is displayed in the left column, whilethe positive is displayed on the right. Corresponds to Table 4FIGURE 2Thin-plate spline warps of allometric variation inEuropean-derived North American children. Thin-plate spline warpsshowing variation across age, centroid size. Negative end of theaxis of variation is displayed in the left column, while the positiveis displayed on the rightFIGURE 3
LARSON ET AL.T AB LE 3333Eigenvalues and Variances for PC 1–10 for facial shape after removing variation related to age and sizeTanzanianEuropean-derived North AmericanPCEigenvalues% varianceCumulative variancePcEigenvalues% varianceCumulative 185.36values did not change significantly when transforming the exact age toheatmaps corresponding to the sex and population differences in thethe nearest whole-year (r 5 0.001) or the nearest 3-year intervalsample. All effects and interactions are significant (Table 5). However,(r2 5 0.0006). We assume that random error in age will have similarthe magnitudes of these effects are fairly small compared with variationeffects in the Tanzanian data.within each population. The difference between the two populations2explains 4% of the total variation in the combined sample. The exten-3.2 Facial shape variation unrelated to size/ageSeparate PCA of the size and age corrected Procrustes coordinates forboth populations revealed that facial shape variation independent ofsize and ages measures is highly structured. In the Tanzanian cohort,along the PC1 axis (22.7% variance) individuals varied in relative upperfacial height, overall facial width, nasal base width, and interorbital distance. Similar to PC1, PC2 (21.3% variance) described shape changes intotal facial height and width, while also capturing the relative degree ofmaxillary prognathism. PC3 (14.7% variance) captured mandibular prognathism, upper facial depth, and midfacial length. In the North American cohort, along the PC1 axis (22.7%) subjects varied in facial height,facial width, philtrum height and chin protrusion. PC2 (18.9%) described variation in maxillary prognathism, chin protrusion, and nasalprojection. PC3 (16.5%) captured degree of retrognathia, nasal projection and interorbital distance. PC 1–10 Eigenvalue variances for bothstudy populations are listed in Table 3. Figure 4 shows visualization ofthe shape changes associated with PCs 1–5 for both study populations,sively overlapping variation in facial shape is evident in scatterplots ofthe first four PCs (Figure 5b). Here, the ranges of variation overlapalmost entirely with the most separation evident on PC4 whichexplains 6% of the combined sample variance.The interaction effects between population and age or populationand the size measures, while statistically significant, explain very littlevariance compared with the main effects (Table 5). The variancesexplained by the interaction terms are an order of magnitude lowerthan the main effects. This shows th
5Human Medical Genetics and Genomics Program and Department of Pediatrics, University of Colorado School of Medicine, Aurora, Colorado 6Department of Anthropology, University of La Plata, La Plata, Argentina 7Department of Anthropology, Stony Brook University, Stony Brook, New York, USA 8School of Pharmacy, University of Alberta, Edmonton, Canada