Transcription
HEALTHCARE COST &UTILIZATION2018 REPORTmncm.orgmnhealthscores.org 2018 MN Community Measurement. All Rights Reserved.
TABLE OF CONTENTS2Introduction and Executive Summary4Total Cost of Care7Resource Use and Relative Price8Utilization10Average Cost Per ProcedureONLINE APPENDICESMethodologyDetailed Tables by Medical GroupWho is MN Community Measurement?MN Community Measurement (MNCM) is a non-profit organization that empowers thecommunity with data and information to drive improvement in health care cost andquality. MNCM was formed as a community resource where all health care stakeholders –whether they buy, manage, provide, deliver, oversee, or consume health care – cometogether and mutually invest in improvement for a better tomorrow.MNCM specializes in developing, collecting, analyzing, and publicly reportinginformation on health care quality, cost, and patient experience. Founded in 2005, ourmulti-stakeholder collaborative includes physicians, hospitals and health systems,health plans, employers, consumers, and state government.MNCM strives to deliver data and information that is timely, actionable, and relevant foreach stakeholder in the community to fulfill their role in advancing improvement andaffordability.REPORT PREPARATION DIRECTIONKEY CONTRIBUTORSGunnar NelsonHealth EconomistNatalie Scholz, MPHHealth Care Data AnalystDIRECT QUESTIONS OR COMMENTS TO: Gunnar Nelson nelson@mncm.org1 · HEALTH CARE COST & UTILIZATION REPORT 2018 MN Community Measurement. All Rights Reserved.
INTRODUCTION AND EXECUTIVESUMMARYAs an independent nonprofit dedicated to empowering health care decision makerswith meaningful data, MN Community Measurement (MNCM) is a statewide resourcefor timely, comparable information on health care costs and quality. Compared to otherparts of the nation, MNCM has one of the most robust public transparency efforts relatedto health care costs, which provides perspective on total cost of care, resource use andprice as drivers of total cost, and prices for individual services – as well as importantinformation about quality of care that must be considered in context with cost. Eachof these concepts related to cost of care is important in its own right and combiningthem into an overall picture helps to shed light on important trends and variation inMinnesota’s health care marketplace.This report, which MNCM publishes annually, includes data from our analysis of 2017health care costs for Minnesotans who have private health insurance.The report is divided into four sections:»» Total Cost of Care»» Resource Use and Relative Price»» Utilization»» Average Cost Per ProcedureThese four separate components work in unison, drilling into the drivers of health carecosts. As illustrated below, total cost is a function of resource use times price. Resourceuse includes utilization and the price includes average cost per procedure.TOTAL COSTOF CARE2 · HEALTH CARE COST & UTILIZATION ageCost PerProcedure 2018 MN Community Measurement. All Rights Reserved.
Key report findings:»» Cost trends: For people with private health insurance, the total cost of careincreased by 2.0 percent per person in 2017, a slower rate of growth than seen inthe previous two years (6.1 percent and 5.6 percent in 2015 and 2016, respectively).»» In 2017, professional services and inpatient hospital services grew at thefastest rates (3.3 percent and 3.2 percent, respectively).»» Retail pharmacy cost grew by 2.0 percent in 2017, continuing a trend ofslowing growth since 2014 when drug spending increased by 11.7 percent.»» Spending per patient for outpatient hospital services declined by 1.0 percentin 2017, in contrast to recent trends of growth above 5 percent per year in thiscategory.»» Variation: Across medical groups, there continues to be considerable variationin total cost of care, resource use and overall pricing, and prices for specificprocedures.»» Total Cost ranges from 398 to 1,093 per patient per month on a riskadjusted basis. Relative resource use has a variation of 95 percent andrelative pricing also has variation of 95 percent.»» In Minnesota, a medical group’s price index has more influence on its totalcost of care than its resource use.»» While the range from lowest to highest has increased, the overall distributionin cost and resource use between medical groups in the region has remainedstable over time.»» The prices of imaging services in an outpatient hospital setting are, onaverage, 45 percent higher than the same services performed at a clinic orstandalone radiology center.New This Year»» Comparative price data for imaging procedures now includes hospital outpatientsettings in addition to clinic (medical group) settings.»» Statewide total cost of care includes all costs incurred by patients who are attributedto a primary care provider, without adjustments for high-cost outliers.1 As in previousyears, for analysis at the medical group level the costs are risk adjusted and outlierexpenses are removed.1In previous years’ analysis, the statewide totals excluded high-cost outliers. MNCM has made thischange in order to provide a more complete picture of overall spending, and for consistency acrossyears as the threshold for what is considered an outlier changed in 2017.3 · HEALTH CARE COST & UTILIZATION REPORT 2018 MN Community Measurement. All Rights Reserved.
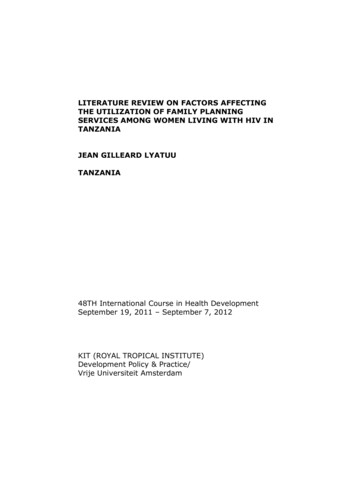
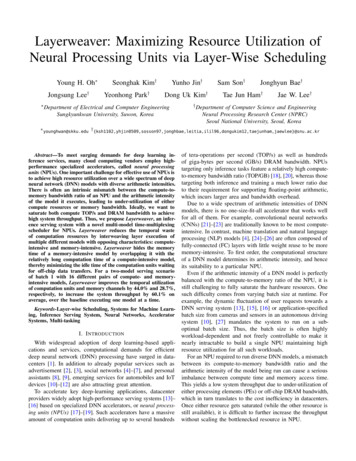
TOTAL COST OF CARETotal cost of care (TCOC) is a measure of a medical group’s risk-adjusted cost ofmanaging the patient population that it cares for. TCOC is a combination of two factors:resource use (the amount and intensity of care) and prices. The methodology used formeasuring total cost, resource use and price in this report is the Total Cost Index (TCI).More details on the methodology are included in the appendix to this report.The analysis in this report is based on claims data for 2017 from the four health planswith the largest commercially-insured patient populations in Minnesota: Blue Cross andBlue Shield of Minnesota, HealthPartners, Medica Health Plans, and PreferredOne. Theanalysis includes the actual costs of 1.5 million patients and total spending of more than 8.6 billion in 2017.Patients are attributed to medical groups based on their number of office-based primarycare visits during the year. The medical group that the patient visited most frequentlyfor Family Practice, Pediatric, Obstetrics and Gynecology or Internal Medicine servicesis considered the patient’s primary care medical group. All patient costs incurredduring the year are assigned to that primary care group. To ensure that results considerdifferences in patients’ health status and the impact of high-cost cases, the methodologyincludes risk adjustment and caps spending at 125,000 per patient.The statewide average total cost of care includes all costs incurred by patients who areattributed to a primary care provider, without adjustments for high-cost outliers. Foranalysis by medical group, the costs are risk adjusted and limited to the first 125,000per patient per year.In 2017, the average total cost of care for commercially insured patients in Minnesotawas 563 per month, an increase of 2.0 percent from the previous year (Figures 1 and2). Growth in 2017 was slower than the previous two years, when the total cost of careincreased by 6.1 percent and 5.6 percent in 2015 and 2016, respectively.»» In 2017, professional services and inpatient hospital services grew at the fastestrates (3.3 percent and 3.2 percent, respectively).»» Retail pharmacy cost grew by 2.0 percent in 2017, continuing a trend of slowinggrowth since 2014, when drug spending increased by 11.7 percent.»» Spending per patient for outpatient hospital services declined by 1.0 percentin 2017, in contrast to recent trends of growth above 5 percent per year in thiscategory.4 · HEALTH CARE COST & UTILIZATION REPORT 2018 MN Community Measurement. All Rights Reserved.
FIGURE 1: Cost trend by type of service, per patient per monthSheet 1InpatientOutpatientPharmacyProfessionalTotal 600 551 562Year2013Cost per patient per month 500 4752016 4922017 400 300 200 100 89 88 89 91 9420132014201520162017 134 124 117 111 201 20520132014 233 218 241 132 72 81 89 92 942014201520162017 0162017Sum of Cost for each Year broken down by Claim Type. Color shows details about Year.FIGURE 2: Cost growth by type of serviceSheet 29%YearType of ionalTotal1.9%InpatientOutpatientPharmacy 62017Type ofTypeServiceof .9%5.6%4%5%6%7%8%9%10%11%12%13%Growth from previous yearSum of Total Cost for each Type of Service broken down by Year. Color shows details about Type of 2%13%Growth from previous yearrvice broken down by Year. Color shows details about Type of Service.5 · HEALTH CARE COST & UTILIZATION REPORT20142015 522 2018 MN Community Measurement. All Rights Reserved.
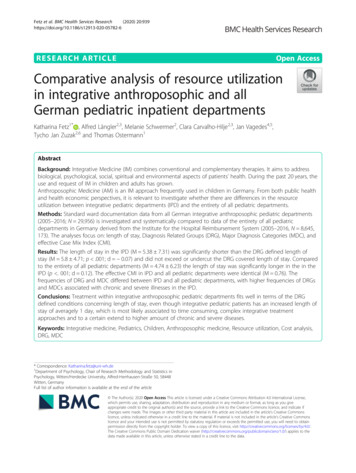
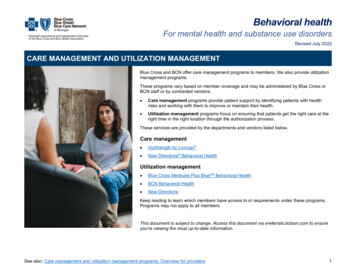
Consistent with previous years, there continues to be substantial difference in costsbetween medical groups.Since MNCM began publishing its TCOC analysis, the variation in total cost of care amongmedical groups in the region has remained stable. There is no statistical evidence thatthe variation between medical groups is widening or narrowing. In addition, there hasbeen little change in the relative positions of medical groups within the overall costdistribution. Detailed results of the TCOC analysis by medical group are included in theonline appendix to this report and are also available at MNHealthscores.org.FIGURE 3: Total cost of care by medical group, 2017Sheet 112001100Risk Adjusted Cost Per Patient Per Month1000900800700600Risk Adjusted Mean5004003002001000Count vs. Medical Group.6 · HEALTH CARE COST & UTILIZATION REPORT 2018 MN Community Measurement. All Rights Reserved.
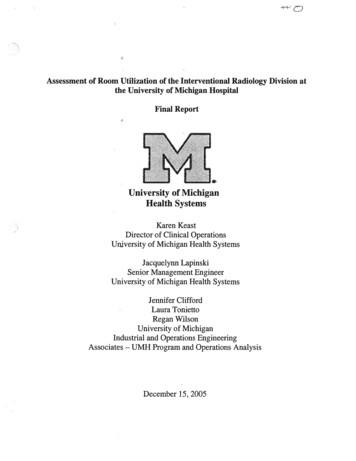
RESOURCE USE AND RELATIVE PRICETotal cost is driven by both the amount of resources used and the price of each resource.To better understand the reasons for cost variation, MNCM’s analysis separates pricesand resources used. This method uses the same input data as TCOC and produces anindicator of relative resource use (RRU) and a price index at the medical group level.Each of these indicators has a value of 1.0 for the statewide average, with values above1.0 signifying that a medical group’s resource use or price is above average and valuesbelow 1.0 signifying resource use or price that is below the statewide average.For a medical group to have a total cost of care that is lower than the market average,the combination of relative pricing and relative resource use must fall within certainparameters. It is possible to have higher than average prices and still have low totalcosts, or to have higher than average resource use and have low total costs. The shadedarea in Figure 4 illustrates which medical groups have lower TCOC than the statewideaverage.Examining resource use and pricing separately, MNCM’s analysis finds a 95 percentvariation across medical groups in resource use, and also a 95 percent variation in price(Figure 4). Detailed results for TCOC, relative resource use, and price by medical groupare included in the online appendix to this report.FIGURE 4: Relative price vs. relative resource use bymedical group, 2017Sheet 1Higher Total Cost60%Relative Price, Difference From Average50%40%30%20%10%0%-10%-20%Lower Total Cost-20%-10%0%10%20%30%40%50%60%Relative Resource Use, Difference From AverageResource Use Di ernce From Average vs. Price.7 · HEALTH CARE COST & UTILIZATION REPORT 2018 MN Community Measurement. All Rights Reserved.
UTILIZATIONTo further understand variation in resource use, MNCM’s analysis also includes variationacross medical groups in the utilization of common categories of medical services, suchas inpatient hospital admissions or imaging services. Because utilization of servicesvaries by age and gender (see Table 1), MNCM’s analysis of variation in utilization ofservices across medical groups adjusts for differences in the age and gender of thepatients attributed to each medical group, as well as differences in health status.TABLE 1: Utilization rates per 1,000 patients per year,by age and gender, 2017Commercial PatientsAges 1-17FemaleAges 18-39MaleFemaleAges 1118.329.155.266.856.2Inpatient Days96.784.4356.2135.4213.8273.8209.7Average Length of Stay4.94.73.04.73.94.13.7Surgical 91.2127.160.25.44.73.44.33.54.03.8Inpatient Surgical DaysAverage Length of Stay SurgicalMaternity Admissions0.294.32.817.6Inpatient Maternity Days0.9259.49.548.8Average Length of Stay Maternity4.52.83.42.8Medical Admissions16.214.317.121.526.134.722.8Inpatient Medical Days78.866.373.6102.8113.0146.7100.8Average Length of Stay 3.5150.9161.9High Tech Imaging In Emergency Room10.613.442.839.155.455.940.0Outpatient Surgery37.346.081.167.4224.8213.3131.0Emergency Room VisitsDiagnostic TestingStandard Imaging462.2460.41328.5470.31466.5736.4921.4High Tech Imaging (MRI,CT)68.764.6206.0207.2426.9422.7267.2Lab and Pathology Primary ialty criptions .4Use of Generic ce VisitsPharmacy8 · HEALTH CARE COST & UTILIZATION REPORT 2018 MN Community Measurement. All Rights Reserved.
Figure 5 illustrates the variation in utilization rates across medical groups, afteradjusting for age, gender, and risk. For example, variation in inpatient admissions rangesfrom 48 percent below to 90 percent above expected rates, while variation in pharmacyprescriptions filled ranges from 29 percent below to 56 percent above expected rates.Detailed results of this analysis by medical group are included in the online appendix tothis report.Of the utilization measures included in the analysis, emergency room use, afteradjustment for patient population mix, is the measure that is most predictive of totalcost of care.2FIGURE 5: Variation in utilization: actual/expected ratio bymedical groupSheet 12.5Actual Utilization / Expected utpatientSurgeryPrimary CareVisitsSpecialty escriptionDrugsActual/Expected Ratio for each Category. Details are shown for Category.2See the appendix for a full listing of utilization rates.9 · HEALTH CARE COST & UTILIZATION REPORT 2018 MN Community Measurement. All Rights Reserved.
AVERAGE COST PER PROCEDUREAverage Cost per Procedure (ACP) is a measure of the average amount paid to eachmedical group by commercial health plans for specific common ambulatory careprocedures and services. The measures represent actual amounts paid for services, notlist prices, and include amounts paid by insurance and patient out of pocket costs. Forhospital outpatient radiology fees, the metric is a combination of the facility fee paid tothe hospital and the separate radiology reading fee for the same patient, procedure anddate of service.MNCM’s analysis of prices includes 118 services and procedures that were selectedbecause they are common services and patients may have options to select the locationand provider (as opposed to services provided in an emergency). Table 2 shows theminimum, average and maximum prices for commercially insured patients for each ofthe 118 services in 2017. As a comparison, the Medicare and Medicaid standard fees as ofOctober 1, 2017, are also shown when coding and coverage are comparable.TABLE 2: Average cost per procedure, 2017Government FeesCommercial RangeMinimumMedianOctober 2017;when comparableMaximumMedicareMedicaidCommercial asa Percentageof MedicareEye ServicesDetermination of Refractive StateEye Exam and Treatment established patientEye Exam established patient 5 34 56 87 175 317 14 128 91137% 82 125 217 89 63140% 112 205 363 153 108134% 3 6 49Colonoscopy* 289 513 1,853 316 224162%Endoscopy with a biopsy* 219 372 1,188 348 247107%Chest X-ray (2 views) 24 65 297Knee X-ray (1 or 2 views) 29 72 378 32 22225% 402 446 578 183 121244%Eye Exam new patientVisual Acuity Screen 2Gastrointestinal ProceduresImagingLower Extremity CT without ContrastLower Extremity MRI without Contrast 195 851 3,050 242 172352%Lumbar Spine CT without contrast 358 453 767 183 121248%Lumbar Spine MRI without and with Contrast 728 793 3,676 387 274205%Lumbar Spine MRI without Contrast 216 891 3,372 229 162389%Screening Mammography digital 174 225 544Spine X-ray (2 views) 31 81 261 35 25231%Ultrasound Exam Pelvic complete 125 250 606 113 80221%Ultrasound of Obstetrical Uterus 159 297 784 146 113203%X-Ray Exam of Ankle 28 73 359 32 22228%X-Ray Exam of Foot 25 69 291 30 21230%X-Ray Exam of Shoulder 33 68 299 30 21227%X-Ray Exam of Wrist 31 78 323 36 25217%*Physician costs only, not including facilty fee10 · HEALTH CARE COST & UTILIZATION REPORT 2018 MN Community Measurement. All Rights Reserved.
Government FeesCommercial RangeMinimumMedianOctober 2017;when comparableMaximumMedicareMedicaidCommercial asa Percentageof MedicareLaboratoryAlanine Aminotransferase (ALT) test 8 11 60 7 7157%Aspartate Aminotransferase (AST) test 7 11 59 7 6157% 14 18 116 12 11150%Assay of Free ThyroxineBacterial culture screening only 9 12 81 8 8150% 12 18 117 12 10150%Blood hemoglobin (screening for irondeficiency anemia) 3 4 43 3 3133%Chlamydia, amplified probe technique 49 76 193 48 43158% 6 14 74 9 8156%Complete Blood Count (CBC) with differentialWhite Blood Cell (WBC) count 12 17 119 11 10155%Comprehensive metabolic panel 14 21 137 14 13150% 7 6143%Basic metabolic panelComplete Blood Count (CBC)Creatinine test 7 10 74 44 58 386 6 8 50Glycated hemoglobin test 14 20 108Gonorrhea test 48 71 192Human Chorionic Gonadotropin (HCG) test,quantitative 16 21 126Lipid panel 8 28Microalbumin quantitative 8 11 17 22Potassium test 8Pregnancy test, urine 9General health panelGlucose (blood sugar) testPap smearProstate Specific Antigen (PSA) total 50 5 5160% 13 12154% 48 43148% 15 19140% 179 18 17156% 115 8 7138% 89 14 25157% 11 43 6 6183% 11 76 9 9122% 28 32 196 25 23128%Prothrombin time 6 8 62 5 5160%Strep test, rapid 8 22 96 16 17138% 24 35 166 23 21152% 4 4 23 4 3100%Urinalysis with microscopy 4 6 67 4 4150%Urinalysis without microscopy 3 4 41 3 3133% 10 16 121 11 10145%Vitamin B-12 22 30 157 21 19143%Vitamin D 25 Hydroxy 38 59 198 41 37144%Biopsy of the Uterus 139 247 502 107 76231%Cardiac Stress test 145 204 384 72 51283%Colposcopy 150 106243%Thyroid (TSH) testUrinalysis nonauto without scopeUrine culture/colony countMedical Services 261 364 730Developmental Screening tests 15 21 93Diphtheria, Tetanus and Pertussis (DTaP)vaccine for a child younger than 7 18 24 52Echocardiogram, routine ECG withinterpretation and report 17 41 166 9 24 61Hemophilius Influenza B11 · HEALTH CARE COST & UTILIZATION REPORT 7 17 12241% 11 2018 MN Community Measurement. All Rights Reserved.
Government FeesCommercial RangeMinimumMedianOctober 2017;when comparableMaximumHepatitis A vaccine for a child or adolescent 26 34 99Hepatitis B vaccine for a child or adolescent 20 26 74Hepatitis B vaccine for an adultHuman Papillomavirus (HPV), three dosesMeasles, Mumps and Rubella (MMR) vaccineMedicareMedicaid 45 64 156 63 152 211 241 160 71 59 71 106Measles, Mumps, Rubella and Varicella (MMRV)chickenpox vaccine 148 199 301Meningitis (meningococcal) vaccine 113 130 272 116Pneumococcal conjugate vaccine, 13 valent 151 180 406 205Pure Tone hearing test air 15 27 51Spirometry test 53 85 144Tetanus and Diphtheria (Td) vaccine 32 42 110 32Tetanus and Diphtheria (Td) vaccine withoutpreservatives 22 29 71 24Varicella Zoster Virus (chichenpox) vaccine 19 120 161 122Commercial asa Percentageof Medicare 9 37 26230%Mental Health ServicesGroup Psychotherapy 22 52 153 26 23200%Psychiatric diagnostic evaluation 115 211 466 134 121157%Psychiatric diagnostic evaluation with medicalservices 183 308 540 150 135205%Psychotherapy, 30 minutes with patient and/orfamily member 59 82 230 65 58126%Psychotherapy, 45 minutes with patient and/orfamily member 71 119 268 87 78137%Psychotherapy, 60 minutes with patient and/orfamily member 109 134 402 131 118102%Obstetrical and Gynecologcial ServicesFetal non-stress test 66 108 225 47 36230%Vaginal delivery with routine care* 2,420 3,808 6,496 1,990 1,388191%C-section delivery with routine care* 2,538 4,539 5,769 2,195 1,388207%Office visit, new patient, 10 minutes 58 91 106 45 34202%Office visit, new patient, 20 minutes 63 163 186 75 58217%Office visit, new patient, 30 minutes 92 243 274 107 83227%Office visit, new patient, 45 minutes 137 371 405 163 126228%Office visit, new patient, 60 minutesOffice Visits 261 464 519 205 159226%Office visit, established patient, 5 minutes 30 46 82 22 17209%Office visit, established patient, 10 minutes 55 84 111 44 34191%Office visit, established patient, 15 minutes 62 150 202 73 56205%Office visit, established patient, 25 minutes 91 242 309 108 83224%Office visit, established patient, 40 minutes 145 112219% 172 317 422Preventive care visit for an infant under age 1 92 203 243 77Preventive care visit for a child between theages of 1 to 4 92 203 259 82*Physician costs only, not including facilty fee12 · HEALTH CARE COST & UTILIZATION REPORT 2018 MN Community Measurement. All Rights Reserved.
Government FeesCommercial RangeMinimumPreventive care visit for a child between theages of 5 to 11MedianOctober 2017;when comparableMaximumMedicareMedicaidCommercial asa Percentageof Medicare 95 193 259 82Preventive care visit for an adolescentbetween the ages of 12 to 17 118 215 275 90Preventive care visit for an adult between theages of 18 to 39 150 257 342 92Preventive care visit for an adult between theages of 40 to 64 154 283 578 98Preventive care visit for an adult 65 years andover 197 311 608 106Acupuncture without stimuli 15 Min 35 88 100 26Electric stimulation therapy 17 29 62 11Manual therapy, multiple regions 28 45 106 28 20161%Neuromuscular reeducation 32 54 133 35 25154%Therapeutic exercises 30 49 122 31 22158%Ultrasound therapy 13 20 42 14 9143% 169 263 398 120 85219% 86 136 312 59 42231% 155 222 616 157 111141% 81 115 133 48 34240%Skin biopsy 132 228 283 106 75215%Skin lesion (0.5cm or smaller) removal orexcision 243 270 299 127 90213%Skin lesion (0.6cm or larger) removal orexcision 238 315 416 150 107210%Physical TherapySurgeryAbscess treatmentAspiration and/or injection of a large jointCircumcisionEarwax removalSkin lesion, destruction 61 135 242 66 47205% 115 189 251 90 64210%Stitches for a wound 121 196 261 91 65215%Vasectomy 606 917 1,548 395 280232%Skin tag removalTo see full details for all procedures, visit MNHealthScores.org.13 · HEALTH CARE COST & UTILIZATION REPORT 2018 MN Community Measurement. All Rights Reserved.
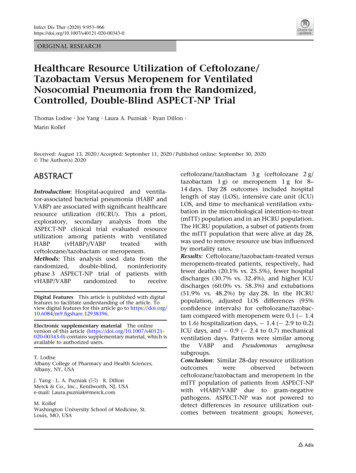
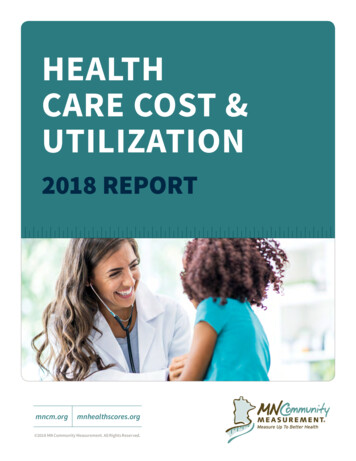
MNCM has published this pricing data since 2014. For the services that have beenincluded in all four years and have a directly comparable Medicare fee, the average pricepaid by private insurance for this group of services combined increased from 174 percentof Medicare rates in 2014 to 187 percent of Medicare in 2017, as shown in Figure 6.FIGURE 6: Commercial prices as percent of Medicare feeschedule; high volume servicesSheet 1174%2014179%2015184%2016187%2017Sum of % of Medicare for each Year. The marks are labeled by sum of % of Medicare.Comparison of Commercial median price to the Medicare fee schedule wherethe Medicare fee schedule is available for the same procedure code. Weighted bycommercial service volume. Excludes imaging services.For the first time, this year’s analysis of pricing for imaging includes services providedin a hospital outpatient setting. As illustrated in Figure 7, the cost of imaging services istypically higher (by as much as 240 percent) in an outpatient hospital setting comparedto a clinic setting. As an overall market basket, the same set of services cost 45 percentmore if performed in a hospital outpatient setting.As a more detailed example, the price of an ankle X-ray can be as low as 28 or as highas 359, depending on where the service is provided. In 2017, the average price paid forcommercially insured patients in a clinic setting was 72 and in an outpatient hospitalsetting it was 226 (see Figure 8).Detailed information on average prices by medical group for all 118 servicesand procedures included in MNCM’s analysis is available on mnhealthscores.org. In addition, the online appendix to this report includes detailedinformation by medical group and hospital for three procedures: Ankle X-ray,MRI of lower extremity and CT of lower extremity. These services were chosento show variation across care settings (clinic and hospital) and also variation inpricing by intensity of services (standard and high-tech imaging).14 · HEALTH CARE COST & UTILIZATION REPORTOnline AppendicesMethodologyDetailed Tables byMedical Group 2018 MN Community Measurement. All Rights Reserved.
FIGURE 7: Average prices for imaging services, clinic comparedto hospital outpatientSheet 1Chest X-ray (2 views) 63Clinic BasedKnee X-ray (1 or 2 views)Hospital Base 72Clinic Based 249Hospital BasedLower Extremity MRIwithout ContrastMeasure NamesClinic Based 195Hospital Based 1,070Clinic Based 1,329Hospital Based 1,588Lumbar Spine MRI without Clinic Basedand with ContrastHospital Based 939 1,116Lumbar Spine MRI without Clinic BasedContrastHospital BasedSpine X-ray (2 views) 1,260 82Clinic Based 227Hospital BasedUltrasound Exam PelviccompleteClinic BasedUltrasound of ObstetricalUterusClinic BasedX-Ray Exam of AnkleClinic Based 247 391Hospital Based 309 518Hospital Based 72 226Hospital BasedX-Ray Exam of Foot 68Clinic Based 224Hospital Basedeet 1X-Ray Exam of Shoulderst X-ray (2 views)X-RayClinicExamBasedof Wriste X-ray (1 or 2 views)Hospital BasedWeightedAverageClinic Based 68Clinic Based 229Hospital BasedMeasure NamesClinic Based 216Hospital Based 195 352Clinic Based 72Hospital Based 509Hospital Based 249Hospital Baseder Extremity MRIout Contrast 77Clinic Based 63 1,070 900800Clinic Based0100200300400500600700Hospital BasedClinic Based and Hospital Based for each Imaging Services. Color shows details about Clinic Based and Hospital Based.bar Spine MRI without Clinic Basedwith Contrast 939Hospital BasedSheet 1C – ClinicH – HospitalH 391C – ClinicH 518Hospital Based 350Clinic Based 72H H H H 226H H H 68Clinic Based 300HospitalBasedOutpatient HospitalAveragey Exam of ShoulderClinic Based 224 68 229Hospital Based 250Clinic BasedC 77OutpatientHospitalBased Hospital Average 352Clinic Based 509100200H300400500H600700800HH 900C C CH H H HH H HBased 100and Hospital Based for each Imaging Services. Color shows details about Clinic Based and Hospital Based. 150CC CClinic Based AverageC CC C C C C C C C C C C C C CC C C C CC 100Clinic Based Average 0C H HC1000CC C C C C C CCC CC C CC C C C C C CC C C C C C C C C C C C C C 50C C C C CCount vs. X-Ray Exam Of Ankle. ColorCshows details about Clinic or Hospital. The marks are labeled by Clinic or Hospital.C C C 01100HHH1200C C CHHH HH HH H 216Hospital Based 2000C C C1600 1700 309Clinic Basedy Exam 250 of Foot 501500 1,260 247Hospital Basedghted Average 1501400 227 350Exam PelvicasoundClinic Based 400pleteHospital Based 200y Exam of Wrist1300 82Clinic BasedHospital BasedSheet1y Exam of Ankle1200 1,116FIGURE 8: Variation in average price of an ankle X-rayasound of Obstetricalus 3001100 1,329 1,588bar Spine MRI without Clinic BasedtrastHospital Based 400e X-ray (2 views)1000H1300 H 1400HHHH HH H15001600 1700C H HMedicare Clinic FeeMedicaid Clinic FeeMedicare Clinic FeeMedicaid Clinic FeeCount vs. X-Ray Exam Of Ankle. Color shows details about Clinic or Hospital. The marks are labeled by Clinic or Hospital.15 · HEALTH CARE COST & UTILIZATION REPORT 2018 MN Community Measurement. All Rights Reserved.H – Hospital
» Variation: Across medical groups, there continues to be considerable variation in total cost of care, resource use and overall pricing, and prices for specific procedures. » Total Cost ranges from 398 to 1,093 per patient per month on a risk adjusted basis. Relative resource use has a variation of 95 percent and