Transcription
American Economic Review 2013, 103(1): ice Discrimination and Bargaining:Empirical Evidence from Medical Devices†By Matthew Grennan*Many important issues in business-to-business markets involve pricediscrimination and negotiated prices, situations where theoreticalpredictions are ambiguous. This paper uses new panel data on buyersupplier transfers and a structural model to empirically analyzebargaining and price discrimination in a medical device market.While many phenomena that restrict different prices to differentbuyers are suggested as ways to decrease hospital costs (e.g.,mergers, group purchasing organizations, and transparency), I findthat: (i ) more uniform pricing works against hospitals by softeningcompetition; and (ii ) results depend ultimately on a previouslyunexplored bargaining effect. (JEL C78, L13, L14, L64)In business-to-business markets, prices are often negotiated. This can result indifferent buyers paying substantially different prices for the same product from thesame supplier. Whenever some buyers are able to “get a better deal” than others inthis way, policymakers, potential middlemen, and other buyers naturally wonderif interventions that move toward more uniform prices might make buyers betteroff. This paper estimates the welfare effects of different hospitals paying different prices—and several interventions that would make prices more uniform—inthe market for coronary stents, a “blockbuster” medical device on which hospitalsspend over 5 billion each year.The price of medical technologies, such as coronary stents, is often cited as adriver of the increasing costs of healthcare (Keehan et al. 2011). Many of the interventions intended to lower these costs impose restrictions that would make pricesmore uniform, but the actual effects of these interventions on prices and welfare are* Rotman School of Management, University of Toronto, 105 St. George Street, Toronto, ON, M5S 2L4, Canada(e-mail: matthew.grennan@rotman.utoronto.ca). Data for this research was provided by Millennium ResearchGroup (www.mrg.net). This paper further develops ideas from my NYU Stern PhD thesis. Special thanks for theguidance and encouragement throughout this research project go to my dissertation committee: John Asker, AdamBrandenburger, Allan Collard-Wexler, Michael Katz, and Bernie Yeung. I also benefited from discussions withVictor Aguirregabiria, Heski Bar-Isaac, Luís Cabral, Ken Corts, Catherine de Fontenay, J. P. Eggers, Avi Goldfarb,Mara Lederman, Robin Lee, P. T. Leger, Hong Luo, Matt Mitchell, Gabriel Natividad, Ariel Pakes, Rob Salomon,Gus Stuart, Ali Yurukoglu; seminar audiences at Analysis Group, AZ, Columbia, FTC, GA, HEC Montreal, IIOC,LSE, NYU, Northwestern (Kellogg), Rochester (Simon), Toronto (Rotman), and Yale SOM; and two anonymousreferees. Andy Cron, John Brumleve, Mark Bly, Rob Tumarkin, and many others have been helpful in teachingme about medical device manufacturing and sales. Physicians and administrators at NYU Medical Center andCGH, Sterling, IL were especially generous with their time and knowledge regarding hospital purchasing and theinner workings of a cardiac catheterization lab. Some industry background research was conducted while attendingthe Transcatheter Cardiovascular Therapeutics 2008 conference, which was made possible by the CardiovascularResearch Foundation.†To view additional materials, visit the article page at http://dx.doi.org/10.1257/aer.103.1.145.145
146THE AMERICAN ECONOMIC REVIEWFEBRUARY 2013not well understood. For example, hospital mergers make prices more uniform bycreating a single buyer from several. Though a common justification for hospitalmergers is to lower input costs, evidence that they do so has been mixed (Dranoveand Lindrooth 2003). Group purchasing organizations (GPO)—where a group ofbuyers delegate purchasing authority to a third party—also make prices more uniform, and they permeate much of hospital purchasing. The actual value provided byGPOs is a constant topic of debate, however, especially in the market for coronarystents and other “physician preference items” (Burns and Lee 2008). The recenthealthcare reform efforts in the United States have brought calls for greater markettransparency, with many anticipating that such reform would lead to more uniformprices across hospitals, but mixed predictions as to who might benefit (Kyle andRidley 2007). The lack of consensus regarding the impact of these interventions onthe cost of critical healthcare inputs is driven in part by the fact that economic theoryalone offers ambiguous predictions, and necessary data are difficult to procure.This paper uses new panel data on the prices and quantities transferred betweenhospitals and coronary stent manufacturers to estimate a structural model of supplyand demand that incorporates bargaining over prices. I then use the estimated modelto compare welfare outcomes under the current pricing regime (where different hospitals pay different prices for the same stent) and counterfactual regimes with transparency, group purchasing, and mergers. I find that: (i) in this market, more uniformpricing actually works against hospitals through a competition softening effect; and(ii) results depend ultimately on a previously unexplored bargaining effect. Whethera given intervention will raise or lower stent prices hinges on the details of how itunlocks these two forces.The way in which a change to more uniform pricing affects competition relatesdirectly to the theory of price discrimination with oligopoly.1 If hospitals are morevertically differentiated from one another in their preferences for stents (what theliterature would call best-response symmetry among manufacturers), then competition will tend to intensify with more uniform prices (Holmes 1989). If hospitals areinstead more horizontally differentiated (best-response asymmetry), then competition will tend to soften with more uniform pricing, as manufacturers price to theircaptive markets (Corts 1998). Thus, understanding if different prices are good orbad for hospitals requires knowing first the extent to which variation in price is dueto variation in demand, and then whether this demand variation is vertical or horizontal. A complete analysis requires going further and accounting for the fact thatprices are not “set” by suppliers as they are in the price discrimination literature—stent prices are negotiated.When buyers and suppliers negotiate prices, supplier costs, buyer willingnessto-pay, and competition determine only a range of potential prices (versus a singleprice) for each buyer and supplier.2 The final price will depend on what I referto as each firm’s bargaining ability—the ability to reach a more favorable pointwithin that range. Heterogeneity in bargaining abilities turns out to be important inStole (2007) and Armstrong (2006) offer excellent reviews of this large literature.The simplest example is bilateral monopoly, where the buyer won’t pay a price above its willingness-to-pay,and the seller won’t sell for a price less than its cost. With a competing supplier, the buyer has an outside optionthat lowers the top of this range, but as long as the competing product is not a perfect substitute, there will still be arange of prices at which the buyer and supplier could trade.12
VOL. 103 NO. 1GRENNAN: PRICE DISCRIMINATION AND BARGAINING147explaining the variation in prices for the same stent sold to different hospitals—asone hospital purchasing manager put it, “There is a lot of wiggle room [in prices].”3Further, this importance of variation in bargaining ability means that a completeunderstanding of any market intervention will require understanding how it affectsbargaining abilities, in addition to competition. The theoretical model in this paperillustrates precisely how bargaining adds a new dimension to debates on price discrimination and uniform pricing and how this bargaining effect interacts with thepreviously established competitive effect.Despite the ambiguity of the predictions from theoretical work on price discrimination and bargaining, the empirical literatures in these areas are still relativelysmall. This is largely because empirical studies of business-to-business markets(where both often occur) have been limited by the difficulty of accessing data ontransfers between buyers and suppliers. Of the recent empirical studies involvingprice discrimination (Duggan and Scott Morton 2006; Hastings 2008; Villas-Boas2009), bargaining (Dranove, Satterthwaite, and Sfekas 2008; Dafny 2010; Ho 2009;Crawford and Yurukoglu 2012), and vertical contracting relationships more generally (Ho, Ho, and Mortimer 2012), only Hastings (2008) and Dafny (2010) have hadaccess to data on the actual buyer-supplier transfers. Hastings (2008) looks at theeffects of price discrimination versus uniform pricing between gasoline stations andwholesalers, but does not consider bargaining. Dafny (2010) is interested in diagnosing the presence of market power among providers of employee health insurance, but not analyzing bargaining or price discrimination per se. This paper buildson previous empirical and theoretical research by quantifying several mechanismspreviously illustrated in theory and demonstrating new interactions between pricediscrimination and bargaining in a context where both are important.Central to this study is an unusually detailed panel dataset, providing the quantities purchased and prices paid for all coronary stents sold to 96 US hospitals fromJanuary 2004 through June 2007, at the stent-hospital-month level. The stent marketis a business-to-business market in which hospitals generate revenue by implantingstents during angioplasty procedures, and the stent is a necessary input that the hospital must purchase from a device manufacturer. Contracts are negotiated, stipulating the price at which the hospital can purchase a given stent over a specified periodof time, and different hospitals negotiate different prices for the same stent. Thisprice variation has significant implications for profits. Moving from the twenty-fifthto seventy-fifth percentile in price would result in a change of about 300,000 annually (about 4 nurses’ salaries) at the average-sized hospital. Section I of the paperprovides more details regarding the industry and data.Even with these detailed data, several important variables—cost, willingnessto-pay, and bargaining ability—are unobserved. Further, separating the impact ofdemand and competition on the range of potential prices from the impact of bargaining abilities within that range requires an explicit model of how competitionand bargaining determine prices. In Sections II and III, I address these challengeswith a structural empirical approach, similar to Berry, Levinsohn, and Pakes (1995),but using a pricing model that generalizes the standard Bertrand-Nash price-setting3C. Zander, personal communication, September, 2008.
148THE AMERICAN ECONOMIC REVIEWFEBRUARY 2013model to allow for bargaining over prices. The model has two parts: (i) a modelof doctor demand for coronary stents uses the price and quantity data to estimatedemand for each stent; and (ii) a model of how prices emerge from competition andbargaining uses the demand estimates and the price and quantity data to estimatecosts and relative bargaining abilities.On the demand side, a random coefficients discrete choice model incorporatesheterogeneity in preferences for stents across hospitals, physicians, and patients.The fact that prices are fixed in long-term contracts provides two new sources ofidentification: First, doctor preferences evolve over time while prices remain fixed;so when prices are renegotiated, the movement is along the demand curve. Second,bargaining ability provides a new supply shifter. The resulting willingness-to-payestimates closely match external data on procedure profits, and estimates of substitution patterns agree with anecdotal evidence that doctors are slightly price-sensitive, are brand-loyal, and can differ widely in their preferences over the differentstents available on the market.Given the demand estimates, I estimate cost and bargaining ability parametersusing a pricing model in which each stent manufacturer and hospital engage inbilateral Nash bargaining, and these bilateral outcomes form a Nash equilibriumwith each other. This model relates to the theoretical literature on bargaining withexternalities (Horn and Wolinsky 1988), and Crawford and Yurukoglu (2012) use aclose variant in an empirical setting. I solve the model for the equilibrium pricingequation, which is useful in two ways: First, it clarifies how this bargaining modelis a generalization of the standard Bertrand-Nash differentiated products pricingmodel, providing a tight link to theoretical work on price discrimination. Second, itshows that price is equal to cost plus a margin that depends on bargaining abilities,elasticities, and the marginal contribution of each product relative to its competitors,making it clear how covariation in price and demand can identify bargaining abilityparameters separately from costs. The estimates show that allowing for heterogeneity in bargaining abilities in addition to heterogeneity in demand is critical forexplaining the price variation observed in the data.4The heterogeneity across hospitals in demand and bargaining abilities also playquantitatively important roles in the counterfactual changes due to transparency,group purchasing, and mergers considered in Section IV. Because different hospitalshave doctors with different brand loyalties (variation in hospital demand is morehorizontal than vertical), a change to more uniform pricing will soften competitionas suppliers price to extract surplus from their captive hospitals. As a result, anyintervention that intends to lower prices through making them more uniform mustbe accompanied by an increase in hospital bargaining ability. I estimate that thisrequired increase can be rather large. In a GPO made of all hospitals in the sample,the bargaining ability of the GPO would have to be above the seventieth percentileof the individual hospital bargaining abilities.Section IVB extends the analysis to 100 merger simulations in order to inform theconditions under which multi-hospital systems might be able to decrease stent prices.This also generates a deeper understanding of the competitive and bargaining effectsA companion paper, Grennan (2012), uses the panel structure of the data and hospital characteristics to furtherexplore the sources of these bargaining abilities.4
VOL. 103 NO. 1GRENNAN: PRICE DISCRIMINATION AND BARGAINING149because the randomly selected hospitals for each merger have varying amounts ofsymmetry in their preferences. I develop a measure of the extent of (a)symmetry andquantify its relation to merger outcomes. For simulations with postmerger bargaining abilities equal to the mean of the merging hospitals, a one standard deviationincrease in symmetry leads to a 1.3 percent increase in hospital surplus. The interaction of this effect with the bargaining effect is also quantitatively significant: theimportance of symmetry more than doubles when the postmerger bargaining abilityis changed to the maximum of the merging hospitals.While this paper focuses on the market for coronary stents, price variation acrossdifferent buyers for the same product—and proposals to restrict it—occur in a variety of markets. Many aspects of the approach used here are flexible enough to beapplied to other settings. The credibility of any structural study, however, depends oncapturing important industry-specific details, which are the topic of the next section.I. Coronary Stents: Industry Description and DataThe coronary stent industry is not only an example of a business-to-business market, it is also interesting and important in and of itself. The coronary stent is a medical device used in angioplasty, an important treatment for blockages in the arteriessurrounding the heart (a condition known as coronary artery disease). These blockages can cause pain, loss of mobility, and eventually heart attack, making coronaryartery disease the leading cause of death in the United States.5 Angioplasty is aminimally invasive technique in which the doctor threads a balloon-tipped catheter from an access point (usually the femoral artery near the groin) to the heart.Using imaging devices, the doctor positions the balloon tip across the blockage, andexpands the balloon, compressing the blockage to the artery walls. A stent is a smallmetal tube that is then placed via catheter where the blockage was cleared and leftin the body as structural support for the damaged artery wall. Though angioplasty isattractive due to its minimally invasive nature, traditional stainless steel “bare-metalstents” (BMS) have the drawback that scar tissue growth around this foreign bodycan lead to significant renarrowing of the artery in about 33 percent of cases. “Drugeluting stents” (DES) attempt to remedy this problem by coating the stent with adrug that discourages scar tissue growth, and they have been successful in reducingthe incidence of renarrowing to near 9 percent.6A. The “Economics” of the Stent MarketWith the introduction of DES, stents became the first medical device to reachrevenue levels similar to those of a “blockbuster” drug. The three million stentsimplanted worldwide each year generate annual revenues of more than 5 billionto stent manufacturers and 30 billion to hospitals and doctors for the stentingprocedures.5US Department of Health and Human Services, National Institutes of Health, National Heart Lung and BloodInstitute Diseases and Conditions Index. www.nhlbi.nih.gov/health/dci/Diseases/Cad/CAD WhatIs.html (June 2008).6Robert J. Applegate, “Drug-Eluting Stents: The Final Answer to Restenosis?” Wake Forest University MedicalCenter, http://www1.wfubmc.edu/articles/CME Drug-eluting Stents (September 15, 2008).
150THE AMERICAN ECONOMIC REVIEWFEBRUARY 2013Hospitals and doctors generate revenue from each angioplasty procedure, usuallyvia reimbursement from a patient’s insurer. The reimbursement rates are negotiated by the hospital with each insurer (usually taking Medicare rates, which are notnegotiated, as a starting point), so they vary across hospitals and across insurers foreach hospital. The average Medicare reimbursement rates for a basic stenting procedure are 812 for the doctor, regardless of the type of stent used; and for hospitals, 10,422 for a BMS and 11,814 for a DES.7 Reimbursements do not depend on themanufacturer of the stent.Out of this revenue comes the hospital’s costs, including the cost of any stentsused. Thus, the hospitals keep in profit any price savings they can achieve on the costof stents. While in many markets there might be some interaction between the costsnegotiated with suppliers and the revenues negotiated from buyers, that is not thecase here. For Medicare patients, the reimbursement levels are fixed; and the reimbursements from private insurers are generally negotiated as a markup on Medicarerates across all procedures performed at the hospital. Thus, reimbursement levels ateach hospital are fixed with respect to the cost of stents.B. Data OverviewThe dataset used in this paper is from Millennium Research Group’s Marketracksurvey of catheter labs, the source that major device manufacturers subscribe tofor detailed market research. The goal of the survey is to provide an accurate picture of market shares and prices by US region (Northeast, Midwest, South, West).8The US market is dominated by four large multinational firms: the Abbott Vascular(formerly Guidant) division of Abbott Laboratories, Boston Scientific, Johnson andJohnson’s Cordis division, and Medtronic, which together make up over 99 percentof US coronary stent sales.9 These manufacturers offered a total of nine BMS andtwo DES during the sample period.The key variables in the data are the price paid and quantity used for each stentin each hospital in each month. In addition, the hospitals report monthly totals fordifferent procedures performed, such as diagnostic angiographies, and prices andquantities for other products used in the catheter lab, such as balloon catheters andguiding catheters. After removing hospitals with incomplete reporting (usually failure to report price data—see online Appendix A for details), the dataset I use foranalysis is an unbalanced panel of 10,098 stent-hospital-month observations at 96US hospitals over 42 months from January 2004 through June 2007.107By “basic” I mean single-vessel operations with no “modifiers” for difficulty of the procedure, location of thehospital, etc. These numbers represent the lower bound in revenue for these procedures (Medicare upper bounds areroughly 1.5 times these payments, and private insurers generally reimburse at even higher levels). Numbers fromFederal Register, Volume 68, No. 216, November 7, 2003; and Federal Register, Volume 68, Number 148, August1, 2003.8See www.mrg.net for more details on the survey.9iData Research, Inc. “US Markets for Interventional Cardiology” (2006).10According to the American College of Cardiology, this sample represents less than five percent of all cardiaccatheterization labs in the United States. The sample, however, is focused on larger labs, and so represents approximately 15 percent of all stenting procedures. Because the dataset used in this paper is sold as market research tothe device manufacturers, hospitals are anonymous, which, unfortunately, prevents linking this dataset with otherdata sources on the hospitals. Of the hospitals in the sample, 31 percent are teaching hospitals and 63 percent arepublic institutions.
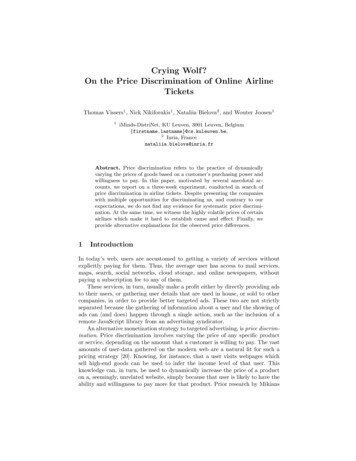
Panel A. QuantitiesPanel B. Prices6,0003,0004,000BMSDESTotal2,0000Jan 04151GRENNAN: PRICE DISCRIMINATION AND BARGAININGPrice in dollarsStents implantedVOL. 103 NO. 12,5002,000BMSDES1,5001,000Jan 05Jan 06Jan 07Jan 04Jan 05Jan 06Jan 07Figure 1. Aggregate Trends in the Market over the Sample PeriodNotes: The quantity graph shows the total number of stents implanted, also broken down into DES and BMS. Theprice graph shows median prices (and first and third quartiles) of BMS and DES.Table 1—Price Variation across HospitalsStentMean ( )SD ( )SD/MeanMin ( )Max ( 3911475454Notes: The table reports summary statistics for the distribution of price ( US) across hospitals for each stent. Thesample is restricted to September 2005 (middle of the sample in time) to isolate cross-sectional variation. There areN 54 hospitals sampled, and BMS1–3 have exited the market.Figure 1 shows aggregate trends in quantities and prices over the sample period.In March 2004, a second DES entered the market, resulting in decreased prices andincreased usage of DES. In 2006, a study questioned the safety of DES, resulting inless DES usage and less stenting overall. In the years following June 2007, this trendreversed slightly, as it became clearer that DES were not as dangerous as the studysuggested.11 For the purposes of this paper, this “DES scare” helps to identify thesubstitution patterns between DES and BMS.C. Cross-Sectional VariationTable 1 provides price summary statistics, documenting the variation in pricesacross hospitals. The coefficient of variation (standard deviation over mean), a common measure of price dispersion, has a mean of 0.13 in the sample. For example,one of the best-selling stents, DES1, has a mean price of 2,508 with a standarddeviation of 317.11For an overview of the DES scare and its aftermath, see “Embers still smoldering from the 2006 ESC firestorm, as experts mull DES safety and efficacy” at www.theheart.org/article/996053.do.
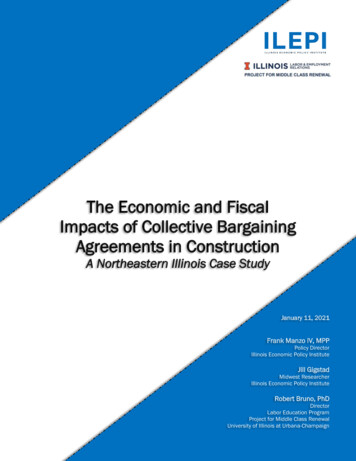
152FEBRUARY 2013THE AMERICAN ECONOMIC REVIEWTable 2—Market Share Variation across HospitalsStentMean (%)BMS4BMS5BMS6BMS7BMS8BMS9DES1DES25364484341SD (%)3265483030SD/MeanMin (%)Max 32523263911475454Notes: The table reports summary statistics for the distribution of market share (percent of all stents used) acrosshospitals. (Average shares do not add up to 100 percent because not all stents are used by all hospitals, as documented in the last column of the table.) The table is restricted to September 2005 (middle of the sample in time) toisolate cross-sectional variation. There are N 54 hospitals sampled in this month, and BMS1–3 have exited themarket.These per-unit price differences translate into significant dollar amounts. A 317change in price results in a difference in cost of over 300,000 per year in themean-volume hospital, or nearly 1 billion per year across the three million stentsimplanted worldwide. This is about 20 percent of the annual revenue of the globalstent market.There are many potential explanations for this price variation across hospitals.Revenue for stenting procedures varies across hospitals. The relative strength ofthe interventional cardiologists versus substitute treatments and the distribution ofpatient types will vary across hospitals as well. Also, stents are differentiated products, and doctors vary in their preferences over which stent is best to treat a givenpatient. These variations induce different competitive environments in different hospitals. The variation in the market shares of each stent, the number of diagnosticprocedures per hospital, and the frequency with which diagnostic procedures leadto stenting, displayed in Table 2 and Figure 2, all provide a sense of this demandheterogeneity.Prices are usually negotiated directly between each manufacturer and each hospital,and these negotiations are another potential source of the observed price variation. Thetypical contract is linear, specifying a price per unit for a given stent over the contractperiod, often one year.12 Who is involved in the negotiation and the incentives theyface differ across hospitals and manufacturers, and anecdotal evidence suggests thatthis could also be an important source of variation in the final price.How much these forces influence price variation, and how they affect welfarewith a change to uniform pricing, is ultimately an empirical question. Estimatingthe unobserved variables and disentangling their effects is the purpose of the modellaid out in Section II.12Some contracts could have discrete nonlinearities, offering a lower price if the hospital uses that stent almostexclusively, say 80 percent of the time. While I do not observe the actual contracts, online Appendix A shows thatthere is little, if any, evidence in the data for exclusivity playing a role in the observed price variation. My demandidentification approach allows for this possibility, however.
VOL. 103 NO. 1153GRENNAN: PRICE DISCRIMINATION AND BARGAININGPanel A. Diagnostic angiographiesPanel B. Percent resulting in tic angiographies (procedures/hospital-month)Percent of diagnostic angiographies resulting in 8523226934529696Figure 2. Distribution of Procedure Volumes across HospitalsNotes: All patients must have a diagnostic procedure to locate any blockages and detect their severity. The graphon the left shows the distribution of the average number of these procedures each hospital performs per month. Thegraph on the right shows the distribution of the average percentage of these procedures that result in a stenting intervention. The table below contains summary statistics for the two distributions.Table 3—Price and Market Share Variation over TimeChange in price, Change in share, percentAbsolute change in price, Absolute change in share, percentMeanSDMinMaxN 3001465.9214101598.1 1,300 77101,150731,300772,04210,0982,04210,098Notes: Summary statistics of changes over time for a given stent-hospital combination. Prices are conditional on aprice change occurring. Market share is percentage of stents used.D. Variation over TimeWhile this paper is primarily concerned with understanding the cross-sectionalvariation in the data, the identification strategy will rely on variation in prices andmarket shares over time for each stent-hospital combination. Table 3 summarizesthis variation in the data. Prices change, on average, every five months, and whileprices decrease slightly over time on average, there is a great deal of variation in boththe direction and size of price movements. For market shares, the average change iszero, but again there is a great deal of variation around the average.II. Modeling Supply and Demand for Coronary StentsThis section uses institutional details and economic theory to construct andestimate a structural model that will distinguish among and quantify the variousdeterminants of price variation across hospitals (demand, costs, competition, andbargaining abilities). The estimated model is then used in Section IV to provide
154THE AMERICAN ECONOMIC REVIEWFEBRUARY 2013estimates of the welfare impact of policy changes that would limit the ability ofdevice manufacturers to price discriminate.The model predicts the quantities of each stent used by each hospital and theprices negotiated for each stent by each manufacturer-hospital pair in terms of aset of structural parameters that allow for heterogeneity across doctors/patients,hospitals, and time. Following Berry, Levinsohn, and Pakes (1995) and related literature, a generalized method of moments algorithm estimates these supply anddemand parameters by matching the quantities and prices predicted by the model tothe quantities and prices observed in the data. The main innovations in the estimationare: (i) that negotiated contracts introduce new sources of identifica
tion will tend to soften with more uniform pricing, as manufacturers price to their captive markets (Corts 1998). Thus, understanding if different prices are good or bad for hospitals requires knowing (rst the extent to which variation in price is due to variation in demand, and then whether this demand variation is vertical or hori-zontal.