Transcription
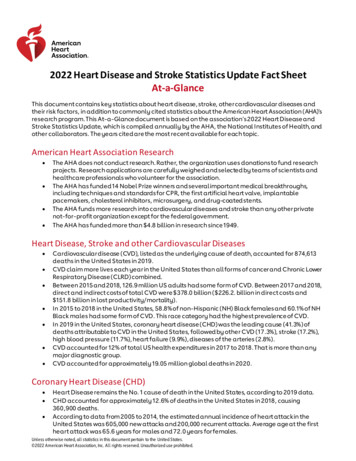
2022 Heart Disease and Stroke Statistics Update Fact SheetAt-a-GlanceThis document contains key statistics about heart disease, stroke, other cardiovascular diseases andtheir risk factors, in addition to commonly cited statistics about the American Heart Association (AHA)’sresearch program. This At-a-Glance document is based on the association’s 2022 Heart Disease andStroke Statistics Update, which is compiled annually by the AHA, the National Institutes of Health, andother collaborators. The years cited are the most recent available for each topic.American Heart Association Research The AHA does not conduct research. Rather, the organization uses donations to fund researchprojects. Research applications are carefully weighed and selected by teams of scientists andhealthcare professionals who volunteer for the association.The AHA has funded 14 Nobel Prize winners and several important medical breakthroughs,including techniques and standards for CPR, the first artificial heart valve, implantablepacemakers, cholesterol inhibitors, microsurgery, and drug-coated stents.The AHA funds more research into cardiovascular diseases and stroke than any other privatenot-for-profit organization except for the federal government.The AHA has funded more than 4.8 billion in research since 1949.Heart Disease, Stroke and other Cardiovascular Diseases Cardiovascular disease (CVD), listed as the underlying cause of death, accounted for 874,613deaths in the United States in 2019.CVD claim more lives each year in the United States than all forms of cancer and Chronic LowerRespiratory Disease (CLRD) combined.Between 2015 and 2018, 126.9 million US adults had some form of CVD. Between 2017 and 2018,direct and indirect costs of total CVD were 378.0 billion ( 226.2. billion in direct costs and 151.8 billion in lost productivity/mortality).In 2015 to 2018 in the United States, 58.8% of non-Hispanic (NH) Black females and 60.1% of NHBlack males had some form of CVD. This race category had the highest prevalence of CVD.In 2019 in the United States, coronary heart disease (CHD) was the leading cause (41.3%) ofdeaths attributable to CVD in the United States, followed by other CVD (17.3%), stroke (17.2%),high blood pressure (11.7%), heart failure (9.9%), diseases of the arteries (2.8%).CVD accounted for 12% of total US health expenditures in 2017 to 2018. That is more than anymajor diagnostic group.CVD accounted for approximately 19.05 million global deaths in 2020.Coronary Heart Disease (CHD) Heart Disease remains the No. 1 cause of death in the United States, according to 2019 data.CHD accounted for approximately 12.6% of deaths in the United States in 2018, causing360,900 deaths.According to data from 2005 to 2014, the estimated annual incidence of heart attack in theUnited States was 605,000 new attacks and 200,000 recurrent attacks. Average age at the firstheart attack was 65.6 years for males and 72.0 years for females.Unless otherwise noted, all statistics in this document pertain to the United States. 2022 American Heart Association, Inc. All rights reserved. Unauthorized use prohibited.
2022 Statistics Update – At-a-Glance, cont. Approximately every 40 seconds, someone in the United States will have a myocardialinfarction.From 2009 to 2019 in the United States, the annual death rate attributable to CHD declined25.2% and the actual number of deaths declined 6.6%.The estimated direct and indirect cost of heart disease in 2017 to 2018 (average annual) was 228.7 billion in the United States.Stroke In 2019, stroke accounted for approximately 1 of every 19 deaths in the United States.On average in 2019, someone died of stroke every 3 minutes 30 seconds in the United States.When considered separately from other CVD, stroke ranks No. 5 among all causes of death inthe United States, causing 150,005 deaths in 2019.In 2019, the age-adjusted US stroke death rate was 37.0 per 100,000, a decrease of 6.6% from2009, whereas the actual number of stroke deaths increased 16.4% during the same timeperiod.In 2020, there were 7.08 million deaths attributable to cerebrovascular disease worldwide (3.48million deaths from ischemic stroke, 3.25 million deaths from intracerebral hemorrhage (ICH),and 0.35 million from subarachnoid hemorrhage).o Central, Southeast and East Asia, Oceania, and sub-Saharan Africa have the highestrates of overall stroke mortality.o Eastern Europe and Central Asia have the highest mortality rates attributable toischemic stroke.o ICH mortality is highest in Oceania, followed by western, central, and eastern subSaharan Africa and Southeast Asia.o Mortality attributable to subarachnoid hemorrhage is highest in Oceania, Andean LatinAmerica, and Central Asia.Sudden Cardiac Arrest In 2019, any-mention sudden cardiac arrest mortality in the United States was 370,494.According to 2020 US data, the majority of Out of Hospital Cardiac Arrests (OHCA) occur at ahome or residence (73.9%). Public settings (15.1%) and nursing homes (10.9%) were the secondand third most common locations of OHCA.According to 2020 US data for OHCA only, survival to hospital discharge was 9.0% for all EMStreated non-traumatic OHCA cardiac arrests. Bystander witnessed arrests had a 31.2% survivalto hospital discharge and 9-1-1 responder witnessed arrests had a 36.2% survival to hospitaldischarge.Unless otherwise noted, all statistics in this document pertain to the United States. Please refer to the complete 2022 Statistics Update for references andadditional information for reported statistics. 2022 American Heart Association, Inc. All rights reserved. Unauthorized use prohibited.
2022 Statistics Update – At-a-Glance, cont.Heart Disease, Stroke and Cardiovascular Disease Risk FactorsThe AHA gauges the cardiovascular health of the nation by tracking seven key health factors andbehaviors that increase risks for heart disease and stroke. We call these “Life’s Simple 7” and wemeasure them to track progress toward improving cardiovascular health for all Americans. Life’sSimple 7 are: not-smoking, physical activity, healthy diet, body weight, and control of cholesterol,blood pressure, and blood sugar. Here are some key facts related to these factors:Smoking Worldwide, tobacco contributed to an estimated 8.09 million deaths in 2020.In the United States, smoking was the leading risk factor for years of life lost to prematuremortality and the third leading risk factor for years of life lived with disability or injury in 2019.A meta-analysis of 23 prospective and 17 case-control studies of cardiovascular risksassociated with secondhand smoke exposure demonstrated 18%, 23%, 23%, and 29% increasedrisks for total mortality, total CVD, CHD, and stroke, respectively, in those exposed tosecondhand smoke.According to the 2020 Surgeon General’s report on smoking cessation, 480 000 Americans dieas a result of cigarette smoking and 41 000 die of secondhand smoke exposure each year, 1in 5 deaths annually.In 2020, 23.6% of US high school students and 6.7% of middle school students used any tobaccoproducts. Additionally, 4.6% of US high school students and 1.6% of middle school studentssmoked cigarettes in the past 30 days. In the past 30 days, 19.6% of US high school studentsand 4.7% of middle school students used e-cigarettes.In 2019, 14.0% of US adults reported cigarette use every day or some days (15.3% of males and12.7% of females).Physical Inactivity In 2018, 25.4% of US adults did not engage in leisure-time physical activity.In 2018, the overall prevalence of meeting the 2018 Physical Activity Guidelines for Americansfor both aerobic and muscle-strengthening guidelines was 24.0% in US adults.Among US high school students in 2019, 44.1% were physically active for 60 minutes or more onat least 5 days of the week.Nutrition Between 2003 to 2004 and 2015 to 2016 in the United States, the mean AHA healthy diet scoreimproved in adults. The prevalence of a poor diet improved from 56.0% to 47.7% for the primaryscore and 43.7% to 36.6% for the secondary score.o Changes in score were largely attributable to increased consumption of whole grains,nuts/seeds/legumes, and saturated fat and decreased consumption of total fruits andvegetables, sugar sweetened beverages, processed meat, and sodium. No significantchanges were observed for consumption of fish and shellfish.Similar changes in AHA healthy diet scores between 2003 to 2004 and 2017 to 2018 were seen inunderrepresented racial and ethnic groups and those with lower income or education,although significant disparities persisted. The proportion with a poor diet decreased from 64.7%to 55.5% for NH Black individuals, from 66.0% to 48.8% for Mexican American individuals, andfrom 54.0% to 47.4% for NH White individuals. The proportion with a poor diet ( 40% adherence)decreased from 50.7% to 41.4% in adults with income-to-poverty ratio 3.0, but only from 67.7%to 63.6% in adults with income-to-poverty ratio 1.3.Unless otherwise noted, all statistics in this document pertain to the United States. Please refer to the complete 2022 Statistics Update for references andadditional information for reported statistics. 2022 American Heart Association, Inc. All rights reserved. Unauthorized use prohibited.
2022 Statistics Update – At-a-Glance, cont.Overweight/Obesity In the United States, the prevalence of obesity among adults increased from 1999 to 2000through 2017 to 2018 from 30.5% to 42.4%.Overall prevalence of obesity and severe obesity in US youth 2 to 19 years of age increasedfrom 13.9% to 19.3% and 2.6% to 6.1% between 1999 to 2000 and 2017 to 2018.According to 2017 to 2018 data, the prevalence of obesity for US children aged 2 to 5 years was13.4%; for children aged 6 to 11 years, prevalence was 20.3%; and for adolescents aged 12 to 19years, prevalence was 21.2%.Worldwide, high body mass index was attributed to 2.40 million deaths in 2020, a change of131.46% compared with 1990,According to the Global Burden of Disease 2020 study, age-standardized mortality ratesattributable to high body mass index lowest in high-income Asia Pacific and highest inOceania, Central Asia, the Middle East and North Africa, southern sub-Saharan Africa, andlocations in Central and Eastern Europe, Central sub-Saharan Africa, and Central LatinAmerica.Cholesterol Using data from 2015 to 2018, 93.9 million, or 38.1% of US adults had total cholesterol of 200mg/dL or higher.Using data from 2015 to 2018 about 28.0 million, or 11.5% of US adults had total cholesterol of240 mg/dL or higher.Using data from 2015 to 2018, 27.8% of US adults had high levels of low-density lipoproteincholesterol (130 mg/dL or higher).Using data from 2015 to 2018, 17.2% of US adults had low levels of high-density lipoproteincholesterol (less than 40 mg/dL).Globally in 2020 there were 4.51 million deaths attributable to high levels of low-densitylipoprotein cholesterol, a 19% increase from 2010.Diabetes Using data from 2015 to 2018, an estimated 28.2 million (10.4%) US adults had diagnoseddiabetes.Using data from 2015 to 2018, an estimated 9.8 million (3.8%) US adults had undiagnoseddiabetes. Additionally, 113.6 million (45.8%) US adults had prediabetes.In 2019, 87,647 US deaths were attributed to diabetes.In 2020, an estimated 1.64 million deaths were attributed to diabetes globally. This representsan age-standardized mortality rate of 20.07 per 100,000.High Blood Pressure (HBP) Using data from 2015 to 2018, 121.5 million (47.3%) US adults had hypertension.In 2019, there were 102,072 US deaths primarily attributable to HBP.In 2019, the age-adjusted US death rate primarily attributable to HBP was 25.1 per 100,000.Unless otherwise noted, all statistics in this document pertain to the United States. Please refer to the complete 2022 Statistics Update for references andadditional information for reported statistics. 2022 American Heart Association, Inc. All rights reserved. Unauthorized use prohibited.
2022 Statistics Update – At-a-Glance, cont.For additional information, charts and tables, seeHeart Disease & Stroke Statistics – 2022 UpdateAdditional charts may be downloaded directly from the online publication or www.heart.org/statistics.Many statistics in this At-a-Glance document come from unpublished tabulations compiled for this document and can becited using the document citation listed below. The data sources used for the tabulations are listed in the full document.Additionally, some statistics come from published studies. If you are citing any of the statistics in this At-a-Glancedocument, please review the full Heart Disease and Stroke Statistics document to determine data sources and originalcitations.The American Heart Association requests that this document be cited as follows:Tsao CW, Aday AW, Almarzooq ZI, Alonso A, Beaton AZ, Bittencourt MS, Boehme AK, Buxton AE, Carson AP, CommodoreMensah Y, Elkind MSV, Evenson KR, Eze-Nliam C, Ferguson JF, Generoso G, Ho JE, Kalani R, Khan SS, Kissela BM, Knutson KL,Levine DA, Lewis TT, Liu J, Loop MS, Ma J, Mussolino ME, Navaneethan SD, Perak AM, Poudel R, Rezk-Hanna M, Roth GA,Schroeder EB, Shah SH, Thacker EL, VanWagner LB, Virani SS, Voecks JH, Wang N-Y, Yaffe K, Martin SS; on behalf of theAmerican Heart Association Council on Epidemiology and Prevention Statistics Committee and Stroke StatisticsSubcommittee. Heart disease and stroke statistics—2022 update: a report from the American Heart Association [publishedonline ahead of print Wednesday, January 26, 2022]. Circulation. doi: 10.1161/CIR.0000000000001052Link to document: 0000001052If you have questions about statistics or any points made in the Statistical Update, please contact the American HeartAssociation National Center, Office of Science & Medicine at statistics@heart.org. Please direct all media inquiries to NewsMedia Relations at s otherwise noted, all statistics in this document pertain to the United States. Please refer to the complete 2022 Statistics Update for references andadditional information for reported statistics. 2022 American Heart Association, Inc. All rights reserved. Unauthorized use prohibited.
research program. This At -a-Glance document is ba sed on the association's 2022 Heart Disease and Stroke Statistics Update, which is compiled annually by the AHA, the National Institutes of Health, and other collaborators. The years cited are the most recent available for each topic. American Heart Association Research
