Transcription
Chapter 2AgriculturePakistan’s agriculture sector plays a central rolein the economy as it contributes 18.9 percent toGDP and absorbs 42.3 percent of labour force.It is also an important source of foreignexchange earnings and stimulates growth inother sectors. The government is focusing onsupporting small and marginalized farmers andpromote small scale innovative technologies topromote growth in this sector. According to the6th Population and Housing Census of Pakistan2017, the country’s population is growing at therate of 2.4 percent per annum. This rapidincrease in population is raising demand foragricultural products. The present governmentis focused on developing this sector and in thisconnection initiated a number of measures suchas crop diversification, efficient use of waterand promotion of high value crops includingbiotechnology, reducing mark-up rates,agriculture credit enhancement, subsidizedfertilizer prices and cheap electricity for agritube wells. As a result, this ing a moderate and subdued growth inlast 13 years.Performance during 2017-18During 2017-18, agriculture sector recorded aremarkable growth of 3.81 percent andsurpassed its targeted growth of 3.5 percent andlast year’s growth of 2.07 percent. Thisstemmed from higher yields, attractive outputprices and supportive government policies,better availability of certified seeds, pesticides,agriculture credit and intensive fertilizersofftake. The crops sector performed well andwitnessed a growth rate of 3.83 percent againstthe last year’s growth of 0.91 percent. Thegrowth in sub sectors, important crops, othercrops and cotton ginning registered a significantgrowth of 3.57 percent, 3.33 percent and 8.72percent, respectively, against last year’s growthof 2.18 percent, -2.66 percent and 5.58 percentrespectively. Major Kharif crops such assugarcane and rice surpassed their productiontargets during 2017-18 by recording growth of7.45 percent and 8.65 percent, respectively,while cotton crop production managed toexceed last year’s production level by recordinggrowth of 11.85 percent. Wheat and maizecrop production remained subdued, as itwitnessed decline of 4.43 percent and 7.04percent, respectively. Other crops having shareof 10.80 percent in agriculture value additionand 2.04 percent in GDP, grew by 3.33 percenton the back of increase in the production offodder, vegetables and fruits.Livestock having share of 58.92 percent inagriculture and 11.11 percent in GDP, recordeda growth of 3.76 percent compared to 2.99percent during corresponding period last year.The Fishing sector having share of 2.10 percentin agriculture value addition and 0.40 percent inGDP, grew at 1.63 percent compared to growthof 1.23 percent in same period last year.Forestry sector having share of 2.09 percent inagriculture and 0.39 percent in GDP posted apositive growth of 7.17 percent against thenegative growth of 2.37 percent recorded insame period last year due to higher timberproduction reported by Khyber Pakhtunkhwa.(Table 2.1).Pakistan has two cropping seasons, "Kharif"being the first sowing season starting fromApril-June and is harvested during OctoberDecember. Rice, sugarcane, cotton, maize,moong, mash, bajra and jowar are “Kharif"crops. "Rabi", the second sowing season, beginsin October-December and is harvested in AprilMay. Wheat, gram, lentil (masoor), tobacco,rapseed, barley and mustard are "Rabi" ent upon the timely availability of water.
Pakistan Economic Survey 2017-18Table 2.1: Agriculture Growth Percentages (Base 2005-06)Sector2011-12 2012-132013-14 2014-15AgricultureCropsi)Important Cropsii) Other Cropsiii) Cotton GinningLivestockForestryFishingP: 3.573.338.723.767.171.63Source: Pakistan Bureau of StatisticsDuring 2017-18, the availability of water forKharif 2017 stood at 70.0 Million Acre Feet(MAF) showing a decrease of 2.0 percent overKharif 2016 and increase of 4.3 percent overthe normal supplies of 67.1 MAF. During RabiTable 2.2: Actual Surface Water AvailabilityPeriodKharifAverage system 4-152015-162016-172017-18Source: Indus River System 0.0I. Crop SituationThe important crops (wheat, rice, sugarcanemaize and cotton) account 23.60 percent in thevalue addition of agriculture sector and 4.45Table 2.3: Production of Important CropsYearCottonSugarcane(000 ason 2017-18, the water availability stood at24.2 MAF showing a decrease of 18.5 percentover Rabi 2016-17 and 33.5 percent less thanthe normal availability of 36.4 MAF. (Table2.2).Rabi(Million Acre Feet)% ageincrease/decrease.over the nt in GDP. The other crops account 10.80percent in the value addition of agriculturesector and 2.04 percent in GDP. The productionof important crops is given in Table 38(17.0)4,220(-2.7)4,944(17.2)(000 Tonnes)Wheat23,473(-6.9)24,211(3.1)25,979(7.3)
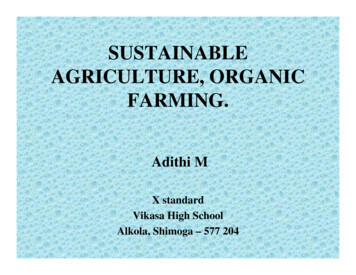
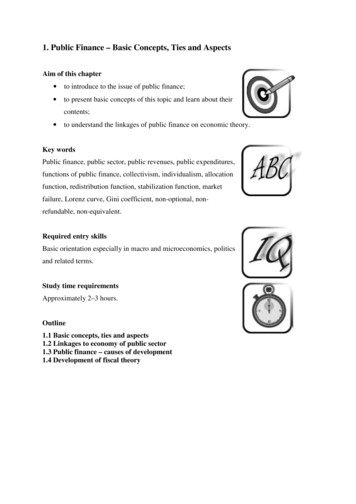
AgricultureTable 2.3: Production of Important CropsYearCottonSugarcane(000 rowth percentRice(000 ,492(-7.0)(-4.4)(11.8)(7.4)(8.7)P: Provisional (July-February), Figures in parenthesespareare growth/decline rates,Source: Pakistan Bureau of Statisticsyield during last five years are shown in Table2.4 and Figure 2.1.a) Important Cropsi) Cotton18, cotton production stood atDuring 2017-18,11.935 million bales and recorded growth of11.8 percent over the production of 10.671million bales during same period last year.Cotton crop has 1.0 percent share in GDP andcontributes 5.5 percent in agriculture valueaddition. Cotton crop was cultivated on an areaof 2,699 thousand hectares compcompared to lastyear’s area of 2,489489 thousand hectares,hectares showingan increase of 8.4 percent. The productionincreased due to better econeconomic returnsreceived during last year, promotion campaignof cotton by the government,government appropriateinterval of rains producedroduced wholesome affect oncotton yieldd and availability of inputs onsubsidised rate. Thehe area, production and cottonFig-2.1:2.1: Cotton Production (000 1000090002013-142014-15 2015-1620152016-172017-18(P)Source: PBSTable 2.4: Area, Production and Yield of CottonYearArea(000 Hectare)% ChangeProduction(000 Bales)% ChangeYield(Kgs/Hec)% 511.87523.0P: Provisional (July-February)Source: Pakistan Bureau of Statistics15
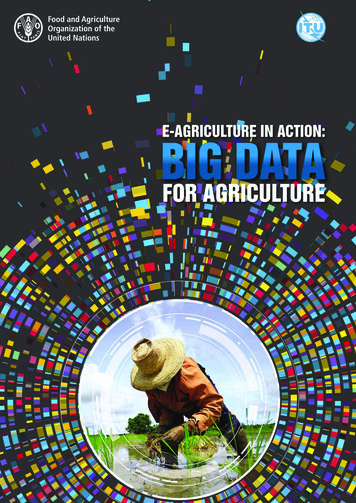
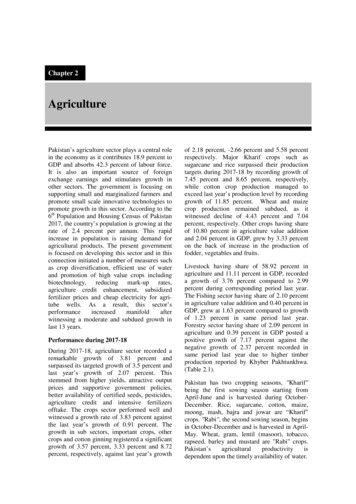
Pakistan Economic Survey 2017-18201World Cotton OutlookThe production and consumption of major cotton growing countries is given in Table 2.5.Table 2.5: Production and Consumption of Major Cotton Growing Countries2015-16 E2016-17 rs4.074.65World 15Pakistan2.152.15Europe & 0.750.75Brazil0.700.73Others3.683.60World Total24.2024.57E: Estimated, P: Projected(Million Tonnes)2017-18 1.311.440.730.763.7425.38Source: Pakistan Central Cotton Committee, Ministry of Textile Industry (February, 2018)ii) SugarcaneSugarcane is high value cash crop of Pakistanand is significantly important for sugar andsugar related industries in the nationaleconomy. It provides raw material for sugarindustry which is the country’s second largestagro-industryindustry sector after textiles. The year2017-18, witnessed another record season forthe sugarcane crop production at 81.102 milliontonnes showing an increase of 7.4 percent overthe last year’s productionroduction of 75.482 milliontonnes which comfortably exceeded the targetof 70.3 million tonnes by a considerable marginof 15.4 percent. Its production accounts 3.6percent in agriculture’s value addition and 0.70.percent in overall GDP. Sugarcane crop wascultivated on an area of 1,313 thousand hectarescomparedared to last year’s area of 1,2181thousandhectares witnessed an increase of 7.8 percent.The sugarcane production increased duedu to16increase in area sown as good economic returnencouraged the growers tot bring more areaunder cultivation and comparatively timelypayments from sugar mills last year. The area,production and yield of sugarcane during lastfive years are given in Table 2.6 and Figure 2.2.Fig 2.2: Sugarcane Production (000 826282664000600002013-14Source: PBS2014-15 2015-1620152016-172017-18(P)
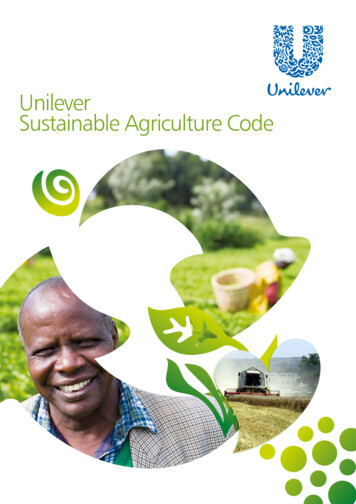
AgricultureTable 2.6: Area, Production and Yield of SugarcaneYearAreaProduction(000 Hectare) % Change (000 Tonnes) % 2017-18 (P)1,3137.881,1027.4P: Provisional (July-February)Source: Pakistan Bureau of Statisticsiii) RiceIn Pakistan, rice is an important food as well ascash crop. After wheat, it is the second mainstaple food crop and second major exportablecommodity after cotton. During 2017-18,2017areacultivated under rice crop has increased by 6.4percent to 2,899 thousandand hectares compared to2,724724 thousand hectares of the correspondingperiod of last year. The production of ricereached historically high level of 7,4427thousand tonnes against the production of 66,849thousand tonnes and recorded an increase of 8.7percentnt over production of last year. Riceaccounts for 3.1 percent in the value added inagriculture and 0.6 percent of GDP. Rice areaincreased due to higher domestic prices andavailability of inputs on subsidisedsubsidise rates, goodadvisory along with increase in export, whichmade rice cultivation attractive for growers.The area, production and yield of rice in lastfive years are shown in Table 2.7 and Figure2.3.Fig 2.3: Rice Production (000 Tonnes)744275007003700068016798During 2017-18, wheat crop was cultivated onan area of 8,734734 thousand hectares showing adecrease of 2.6 percent compared to 8,9728thousand hectares during the correspondingperiod last year. Wheat production stood at25.492 million tonnes during 2017-18,2017recording a decline of 4.4 percent over theproduction of 26.674 million tonnes last year.year684965006000550050002013-142014-15 2015-162015Source: PBSTable 2.7: Area, Production and Yield of RiceYearAreaProduction(000 Hectare) % Change(000 Tonnes)% 18(P)2,8996.47,4428.7P: Provisional (July-February)Source: Pakistan Bureau of Statisticsiv) WheatYield(Kgs/Hec.)% 2016-172017-18(P)Yield(Kgs/Hec.)% Change2,4372,422-0.62,4832.52,5141.22,5672.1Wheat accounts for 9.1 percent of the valueadded in agriculture and 1.7 percent of GDP ofPakistan. The shortfall in production isattributed to decline in area sown, delayed andprolonged sugarcane crushing season, acutewater shortages and fog and smog in thecountry. The position over the last five years isgiven in Table 2.8 and Figure 2.4.17
Pakistan Economic Survey 2017-18201Fig 2.4: Wheat Production (000 00230002013-142014-152015-162016-172017-18 (P)Source: PBSTable 2.8: Area, Production and Yield of WheatYearAreaProduction(000 Hectares)% Change(000 Tonnes)% 17-18 (P)8,734-2.625,492-4.4P: Provisional (July-February)Source: Pakistan Bureau of Statisticsv) MaizeDuring 2017-18,18, maize crop was cultivated onan area of 1,229229 thousand hectares andwitnessed decline of 8.8 percent over last year’scultivated area of 1,348348 thousand hectares.Maize crop production recorded a decline of 7.0percent as its production stood at 5.702 milliontonnes compared to the last year’s production of6.134 million tonnes. Maize contributes 2.4percent value added in agriculture and 0.5percent to GDP. Thehe decline in productionoccurred due to decrease in area cultivated asmaize growers switched over to cotton,sugarcane and rice crops .The position ispresented in Table 2.9 and Figure 2.5.Fig 2.5: Maize Production (000 50035002500Source: PBSTable 2.9: Area, Production and Yield of MaizeYearAreaProduction(000 Hectares) % Change (000 Tonnes) % -18(P)1,229-8.85,702-7.0P:Provisional (July-February)Source: Pakistan Bureau of Statistics18Yield(Kgs /Hec.)% 52016-172017-18(P)Yield(Kgs /Hec.)% Change4,2334,3232.14,4262.44,5502.84,6402.0
Agricultureb) Other CropsGram is the largest Rabi pulse crop, accountingfor 76 percent of total production of pulses inthe country and occupies about 5 percent ofcropped area. During 2017-18, gram productionwitnessed an increase of 3 percent on accountof increase in area sown and favourable weathercondition prevalent at the time of sowing. Theproduction of Bajra, Jowar and Rapeseed &Mustard witnessed increase of 9.8 percent, 4.1percent and 0.1 percent, respectively. Theproduction of Barley has recorded a decline of0.3 percent in production during 2017-18. Thearea and production of other crops are given inTable 2.10.Table 2.10: Area and Production of other Kharif and Rabi CropsCrops2016-172017-18 (P)% Change inAreaProductionAreaProduction production overLast year(000 Hectares) (000 Tonnes) (000 Hectares) (000 m9713309783403.0Barley6158.16057.9-0.3Rapeseed & Mustard190180.5198180.70.1Tobacco47100471000.0P: Provisional (July-February)Source: Pakistan Bureau of StatisticsDuring 2017-18, the production of Onion,Mash, and chillies posted a positive growth of8.1 percent 4.2 percent and 3.8 percent,respectively, compared to their production lastyear. However, the production of pulse MasoorTable 2.11: Area and Production of Other CropsCrops2016-17AreaProduction(000 Hectares)(000 to179.63,852.9Onion137.91,833.2Chillies63.6142.7P: Provisional (July-February)Source: Pakistan Bureau of Statisticsi) OilseedsThe major oilseed crops grown in the countryinclude Sunflower, Canola, Rapeseed/Mustardand Cotton. Total availability of edible oilsduring 2016-17 remained at 3.623 milliontonnes of which local production contributed0.431 million tonnes (12 percent) and theimport share of edible oil/oilseeds was 3.191million tonnes (88 percent). The import bill ofedible oil during 2016-17 was Rs 320.893billion (US 3.063 billion).(Lentil) and Potato remained the same as lastyear’s production, while the production ofMoong remained 8.7 percent lower than lastyear’s production .The area and production ofother crops are given in Table 2.11.2017-18(P)AreaProduction(000 Hectares)(000 981.765.1148.1% Change inproductionover Last year0.0-8.74.20.08.13.8During 2017-18 (July-February), 1.944 milliontonnes of edible oil worth Rs 155.278 billion(US 1.453 billion) has been imported. Localproduction of edible oil during 2017-18 (JulyFebruary) is provisionally estimated at 0.503million tonnes. Total availability of edible oilfrom all sources is provisionally estimated at2.447 million tonnes during 2017-18 (JulyFebruary).The area and production of oilseedcrops during 2016-17 and 2017-18 is given inTable 2.12.19
Pakistan Economic Survey 2017-18Table 2.12: Area and Production of Major Oilseed CropsCrops2016-17 (Jul-Feb)2017-18 (Jul-Feb) (P)AreaProductionAreaProductionSeedOilSeedOil(000 Acres)(000 Acres)(000 Tonnes) (000 Tonnes)(000 Tonnes) (000 d/ nola35166613011Total6,6923,0154317,6383,555503P: ProvisionalSource: Pakistan Oilseed Development Board (PODB), Pakistan Bureau of StatisticsII. Farm Inputsi) FertilizersFertilizer is the most important and expensiveinput contributing 30 to 50 percent, on average,to the crop yield. The domestic production offertilizers during 2017-18 (July-March)decreased slightly by 5.4 percent over thecorresponding period last year due to diversionof domestic piped natural gas from small scaleurea producers, while imported fertilizerincreased by 21.1 percent. Total offtake offertilizer nutrients witnessed a decline by 3.6percent. Nitrogen offtake decreased by 5.0percent and phosphate by 1.4 percent. Potashofftake recorded a significant increase of 31.5percent during 2017-18 (July-March). Thegovernment in order to enhance productivity inagriculture sector provided the followingsubsidies: Tax relief on phosphate fertilizer equivalentto Rs. 300 per 50 kg bag of DAP Reduction in GST on urea from 17 to 5percent/voluntary price reduction by thefertilizers manufactures Cash subsidy of Rs. 100 per 50 kg bag ofurea Subsidy of Rs. 800 and Rs. 500 per bag ofSOP and MOP respectively, by theGovernment of Punjab in order to promotethe use of PotashTotal availability of urea during Kharif 2017was 4,445 thousand tonnes comprising of 1,489thousand tonnes of opening inventory and 2,956thousand tonnes of domestic production (Table2.13). Urea offtake was about 3,234 thousandtonnes, leaving inventory of 796 thousand20tonnes for Rabi 2017-18. Availability of DAPwas 1,360 thousand tonnes comprising of 59thousand tonnes of opening inventory, 867thousand tonnes of imported supplies and 434thousand tonnes of local production. DAPofftake was 992 thousand tonnes leaving aninventory of 367 thousand tonnes for upcomingRabi 2017-18. About 422 thousand tonnes ofurea was exported during Kharif 2017.Rabi 2017-18 started with an opening balanceof 796 thousand tonnes of urea (Table 2.13).Domestic production during Rabi 2017-18 wasestimated around 2,698 thousand tonnes. Ureaofftake during current Rabi 2017-18 isprojected around 3,003 thousand tonnes, against3,494 thousand tonnes of total availability,leaving a closing balance of 307 thousandtonnes for next season. DAP availability duringRabi 2017-18 will be around 1,531 thousandtonnes, which include 367 thousand tonnes ofopening inventory, 787 thousand tonnes ofimported supplies and domestic production of377 thousand tonnes. Offtake of DAP duringRabi season is estimated at 1,403 thousandtonnes, leaving a balance of 135 thousandtonnes for next season.Total availability of urea during Kharif 2018will be around 3,229 thousand tonnescomprising of 307 thousand tonnes of openingbalance and 2,922 thousand tonnes of domesticproduction (Table 2.13). Urea offtake isexpected to be around 2,959 thousand tonnes,reflecting a closing balance of 270 thousandtonnes. Total availability of DAP will be 557thousand tonnes against the expected offtake of782 thousand tonnes. Thus, there is a gap of225 thousand tonnes of DAP which will be metthrough imports by private sector.
AgricultureTable 2.13: Fertilizer Supply Demand SituationDescriptionKharif (Apr-Sep) 2017UreaDAPOpening stock148959Imported supplies0867Domestic Production2956434Total 0Write on/off7-0.6Closing stock796367Source: National Fertilizer Development Centerii) Improved SeedBetter seed quality is important for sustainableagricultural production and ensuring nationalfood security. Federal Seed Certification &Registration Department (FSC&RD) is anattached department of Ministry of NationalFood Security & Research, with the mandate toregulate quality of seeds of various crops.During 2017-18 (July-February) brief activitiesperformed by department are as followed:1. Achievementsa)i.Registration of Seed Companies:Seed companies applied for grant ofregistration as local seed producerA total number of 84 seed companiesapplied for grant of registration asLocal Seed Producer and eachdeposited fee of Rs. 50,000/ii. Seed companies applied for grant ofregistration as seed importerA total of 14 seed companies appliedfor grant of registration as SeedImporter and each deposited fee of Rs.75,000/-.iii. Seed company applied for grant ofregistration as seed exporterOnly one Seed Company applied forgrant of registration as Seed Exporterwith no requirement for submission forfee as per Seed (Business Regulation)Rules, 2016.iv. Renewal of seed companies as localseed producerA total of 25 seed companies appliedfor grant of renewal as Local SeedRabi (Oct-Mar) 007307135(000 Tonnes)Kharif (Apr-Sep) 5Producer and each deposited fee of Rs.25,000/-.v. Registration of Seed Processing UnitsA total of twenty seven (27) cases ofseed processing units received forregistration during the period underreport. The fee for registration of a seedprocessing unit is Rs. 10, 000/-.b)Registration of new Varieties ofVarious Crops: 40 new candidate varietiesof wheat, cotton, sugarcane, mungbean,barley, tomato, berseem, cucumber, bittergourd, ground nut and mango have beenapproved for multiplication (Punjab 17, Sindh13 and Khyber Pakhtunkhwa 10). A numberof 295 new candidate varieties wereconsidered in 1st meeting of VEC-SubCommittee on enlisting which includesvegetables, maize, paddy, potato, fodder andtobacco varieties.c)Field Crop Inspection: During theperiod under report, a total of 60,032 acres ofdifferent crops (wheat, cotton, paddy, maize,pulses, oilseeds, vegetables, fodders, barleyand potato) offered by the public and privateseed agencies were inspected for certificationpurposes.d)Seed Sampling & Testing: A quantityof 582,113 MT locally produced seed (BNS,pre-basic, basic, certified and approvedcategories) of major and minor crops wassampled and tested for purity, germinationand seed health purposes.e)Imported seed consignments: A totalquantity of 35,634 MT of imported seed ofvarious crops/hybrids (maize, paddy,sunflower, canola, fodders, potato, vegetables21
Pakistan Economic Survey 2017-18etc.) valuing Rs. 10,108.81 million wastested under Seed (Truth-in-Labeling) Rules,1991 at the port of entries i.e. Karachi andLahore.research, academia and FSC&RD FieldOffices.i)Seed Germination Laboratory: Atotal number of 1,742 samples tested during2017-18 (July-February). It comprises localas well as imported seed samples.f)Seed Quality Monitoring in theMarkets: Under the provision of amendedSeed Act, 1976, a total number of 58 caseswere filed in the concerned Courts of Lawagainst the seed dealers found sellingsubstandard seeds and a quantity of 14.42 MTseed of different crops was seized.g)Central Seed Testing Lab: CentralSeed Testing Laboratory (CSTL) Islamabadreceived approximately 1,200 seed samplesfrom FSC&RD field stations through QualityManager/Director. A total of 1,170 seedsamples of different crops were tested forseed purity, seed moisture and othercomponents.h)Seed Health Testing: A total of 1,014seed samples of wheat, cotton and paddywere tested. Seed Health Testing Laboratoryalso extended its training services to morethan 60 officials belongs to different sectorsof the country i.e. public/private sectors,During the above mentioned period 3 samplesof International Seed Testing Associate(ISTA) for Proficiency Testing (PT) sampleswere tested and seed germination laboratorygot 1 A-Grade, 1 B-Grade and 1 C-Grade.2. DUS Examination: A total of 167 newcandidate lines of Vegetables, Pulses, Fruits,Potato, Sugarcane, Forage, Maize and Wheathave been studied for Distinctness, Uniformityand Stability (DUS) trails during the subjectperiod. Work is still in progress.3. Registration/Renewal of Fruit PlantNurseriesDuring the period under review, five fruit plantnursery owners have deposited fee forregistration while 3 nursery owners havedeposited fee for renewal of their nurseries. Thedetail is given in Table 2.14.Table 2.14: Area ,Seed Requirements and Seed Availability*CropSowingTotal Seed Targeted SeedSeed Availability (Metric Tonnes)AreaRequirement RequirementPublicPrivateImportedTotal(000 Ha)(MT)(MT)(Loc 0,8181,737,330412,83769,868* : Provisional 2017-18 (July-February)Source: Federal Seed Certification & Registration Department476,61035,635582,113FoddersPotatoiii) MechanizationThe production of tractors has seen aremarkable growth of 37.6 percent during FY2018 (July-February) compared to theproduction of same period last year. The22demand of tractors has increased due togovernment’s supportive policies as the GST ontractors has been reduced to 5 percent, andgoing forward the demand is expected toincrease which will further stimulate the tractor
Agricultureindustry. The production and price of locallymanufactured tractors is given in Table 2.15.Table 2.15: Prices and Production of Locally Manufactured Tractors 2017-18 (July-February)Tractors Model – Horse PowerPrice/UnitPrice/UnitProductionActual Sale(HP)ExcludingIncluding(in Nos.)(in Nos.)GST (Rs)GST (Rs)M/s Al-Ghazi TractorsNH 480-S (55 HP)704,000739,2004,7074,695NH 480-S-W.P (55 HP)720,000756,0002,3572,353NH-Ghazi (65 HP)791,000830,5507,2517,226NH-Ghazi WDB (65 HP)800,000840,000177177NH- 640 (75 HP)1,024,0001,075,2002,6152,604NH -640 WDB (75 HP)1,030,0001,081,500158156NH -640-S (85 HP)1,041,0001,093,0506564NH -640-S WDB (85 HP)1,055,0001,107,7502928NH-70-56 (85 HP)1,540,0001,617,00045Dabung- (85-HP)1,055,0001,107,750384378M/s Millat TractorsMF-240 (50 HP)703,000738,1507,2217,210MF-350 Plus (50 HP)720,500756,5253726MF-260 (60 HP)792,300831,9157,3687,107MF-360 (60 HP)822,500863,625433409MF-375-S (75 HP)1,047,0001,099,3503,3332,766MF-385 2WD (85 HP)1,108,5001,163,9258,9899,032MF-385 4WD (85 HP)1,645,8001,728,090197223Grand Total45,32544,459Note: GST @ 5 percentSource: Tractor Manufacturer Association, Federal Water Management Celliv) IrrigationThe country faced water shortages duringmonsoon, post monsoon and winter seasons.During the monsoon season (July-September)2017, actual rainfall was 22.8 percent lower at108.8 mm against normal rainfall of 140.9 mm.During the post-monsoon season (October-December) 2017, the actual rainfall remained39.0 percent below the normal rainfall of 26.4mm. During the winter season (January-March)2018, actual rainfall remained 56.7 percentbelow the normal rainfall of 74.3 mm. Rainfallrecorded during the monsoon, post monsoonand winter is given in Table 2.16.Table 2.16: Rainfall* Recorded During 2017-18Monsoon RainfallPost Monsoon Rainfall(Jul-Sep) 2017(Oct-Dec) 2017Normal**140.926.4Actual108.816.1Shortage (-)/excess ( )- 32.1-10.3% Shortage (-)/excess ( )-22.8- 39.0*: Area Weighted, **: Long Period Average (1961-2010)Source: Pakistan Meteorological DepartmentDuring Kharif (April-September) 2017, canalhead withdrawals stood at 69.97 Million AcreFeet (MAF) showing a decrease of 2 percent ascompared to 71.37 MAF during the sameperiod last year. During Rabi (October-March)2017-18, the canal head withdrawals witnessed(in Millimeters)Winter Rainfall(Jan-Mar) 201874.332.2-42.1-56.7a decline of 19 percent and stood at 24.16MAF, compared to 29.66 MAF during thesame period last year. The province-wise detailis shown in Table 2.17.23
Pakistan Economic Survey 2017-18Table 2.17: Canal Head Withdrawals (Below Rim Station)Million Acre Feet (MAF)ProvinceKharifKharif % Change inRabiRabi% Change in(Apr-Sep) (Apr-Sep) Kharif 2017 (Oct-Mar) (Oct-Mar) Rabi 2017-1820162017Over 20162016-172017-18Over er 9.6624.16-19Source: Indus River System AuthorityWater Sector strategy centers around fiveimportant elements i.e. water augmentation,water conservation, protection of infrastructurefrom water logging and salinity and floods,groundwater management and institutionalreforms. The existing strategy entailsaugmentation of surface resources to be doneby construction of water storage dams,conservation of water to be undertaken throughlining of canals and water courses andefficiency enhancement to be done byrehabilitation and better operation of existingsystem. The extended strategy will involvegroundwater recharge, use of saline water,water cost/price as a mechanism of efficiency,sustainable use of resources (land, water andenvironment), climate change implications andtrans- boundary water implications.An amount of Rs 36.750 billion were allocatedfor water sector’s development projects/programs during the year 2017-18. The majorwater sector projects under implementation areshown in Table 2.18.Table 2.18: Major Water Sector Projects under ImplementationProjectLocationApp. costLive(Rs. in million)StorageBasha Dam(Dam Part)KhyberPakhtunkhwa& GilgitBaltistanGomal Zam Dam KhyberPakhtunkhwaKachhi CanalBalochistan(Phase-I)Darawat DamSindhNaiGaj DamSindhKurramTangi Dam Khybe
of 10.80 percent in agriculture value addition and 2.04 percent in GDP, grew by 3.33 percent on the back of increase in the production of fodder, vegetables and fruits. Livestock having share of 58.92 percent in agriculture and 11.11 percent in GDP, recorded a growth of