Transcription
NeuroRegulation http://www.isnr.orgSpatial Vector-based Approach to the ERP Analysis asApplied to an EEG-based Discrimination of Traffic LightSignalsSharmin Sultana and Gleb V. TcheslavskiDrayer Department of Electrical Engineering, Lamar University, Texas, USAAbstractThe purpose of the study was to assess the utility of the spatial vector-based representation of multichannelelectroencephalography (EEG; when each spatial vector denotes an “instantaneous” sample of cortical activationevolving over time) in the analysis of cortical responses to visual stimulation—as opposed to the traditional,temporal vector-based approach, when vectors are associated with distinct EEG channels. This representationwas used in the analysis of EEG collected in the virtual traffic light environment with the attempt to determine thecolor of traffic light perceived by four participants. Kruskal-Wallis (K-W) analysis of variance was implementedfor selected EEG electrodes. To utilize all available information, discrimination value was evaluated next for 32dimensional EEG spatial vectors followed by modified “k nearest neighbors” (knn) classification. K-W testindicated that EEG samples at selected electrodes are different between different colors of traffic light and whenobserved for specific latencies. The average accuracy of a modified three-class knn classifier was approaching60% (the random assignment would yield approximately 33%) for the specific poststimuli latencies. Theproposed technique allows analyzing stimulation-synchronized cortical activity with the temporal resolutiongenerally determined by the sampling rate of the neuroimaging modality. The discrimination value appearsinstrumental for predicting the clusterability of data assessed. Stimulation-evoked cortical responses are oftenof interest in studies of human cognition. The proposed technique may overcome the low signal-to-noiselimitation of the traditional evoked response potential (ERP) analysis and possibly provide means to assess suchresponses under the real-time constraint.Keywords: traffic light perception; EEG spatial vectors; VEP; discrimination value; modified knn classifierCitation: Sultana, S., & Tcheslavski, G. V. (2019). Spatial vector-based approach to the ERP analysis as applied to an EEG-baseddiscrimination of traffic light signals. NeuroRegulation, 6(4), 170–180. https://doi.org/10.15540/nr.6.4.170*Address correspondence to: Gleb V. Tcheslavski, DrayerDepartment of Electrical Engineering, Lamar University, P.O. Box10009, Beaumont, TX 77710, USA. Email: gleb@lamar.eduEdited by:Rex L. Cannon, PhD, SPESA Research Institute, Knoxville,Tennessee, USACopyright: 2019. Sultana and Tcheslavski. This is an OpenAccess article distributed under the terms of the Creative CommonsAttribution License (CC-BY).Reviewed by:Jon A. Frederick, PhD, Lamar University, Beaumont, Texas, USAEstate M Sokhadze, PhD, University of South Carolina, School ofMedicine–Greenville, Greenville, South Carolina, USAIntroductionUnderstanding cognitive processes involved in criticaltasks may be essential for future scientific andtechnological advances. Virtual technologies andsimulated environments utilized during the lastdecade allow studying cognitive mechanisms evokedunder various perception scenarios in the controlledlaboratory setting rather than in the real-life scenery.Analysis of electroencephalogram (EEG) is anestablished and potentially accurate technique tostudy human cognitive tasks. Event related potentials(ERPs)—distinctive electrophysiological responses170 www.neuroregulation.orgto specific (usually external) stimuli—are, amongother applications, used in some neurofeedbackapplications (Strehl et al., 2017) and in studying visualperception (Rutiku, Aru, & Bachmann, 2016; Yigal &Sekuler, 2007).Considering letter applications,ERPs are usually registered over visual cortices.Analyzing visual evoked potentials (VEPs)—the EEGcomponents related to perception of visualinformation—permits linking brain electrical activity tovisual stimulation by studying changes in EEG thatoccur following the stimuli (Walsh, Kane, & Butler,2005). In particular, evidences suggest that VEPsmay be related to the color that a subject perceives.Vol. 6(4):170–180 2019doi:10.15540/nr.6.4.170
Sultana and TcheslavskiNeuroRegulationFor instance, Yeh, Lee, and Ko (2013) suggest thatthe images with high preference color combinations(blue on white or white on blue) may producesignificantly faster response in EEG (peak latency ofP100 component) with significantly greater amplitudeof P300 component. Wang and Zhang (2010)concluded that images of a red car result in a largeramplitude of P300 component compared to blue carimages.However, evaluating ERPs or VEPs usually requiresaveraging of multiple EEG epochs recorded inresponse to identical stimulation events and thus useof VEPs in real time may be limited. In the presentreport, we evaluate an alternative approach to thetraditional VEP analysis that may alleviate theunderlined limitation. The proposed approach will beapplied to the analysis of a driver’s response toimages of traffic lights.Evaluating Drivers’ Response to Traffic Lights:Literature ReviewAnalyzing drivers’ cognitive responses may helpdeveloping an in-car brain computer interface (BCI)as possible means for improving road safety.Attempts were recently made to relate the perceivedcolor of traffic light to the subject’s EEG. Bayliss n between red and yellow traffic lights.Studying the P300 component of VEPs, authorssuggest that this component “occurs at red and notyellow lights” (p. 189). While reporting an averageaccuracy of 85%, the work leaves the perception ofthe third, green traffic light, unaddressed. Lin et al.(2007) have further developed the yellow or redclassification, reporting similar accuracy of 85%. Theauthors also extended their study by including allthree traffic light signals (Liang, Lin, Wu, Huang, &Chao, 2005; Lin, et al., 2008). However, since theparticipants were instructed to act based on the trafficlight color they perceive, we may hypothesize that thecognitive response to the driving environment may becontaminated by the action-related cortical response.More recent studies by Khaliliardali, Chavarriaga,Gheorghe, and Millán (2012) utilized the contingentnegative variation (CNV) potential for detection of theanticipated visual cue, such as the instruction toeither “go” or “stop.” A countdown appearing on thescreen was used as the contingent warning stimulidesigned to involve the subjects in the anticipatingstate. However, watching a countdown may not be avery realistic scenario. A required action (applyingeither the brake or the accelerator pedal) may171 www.neuroregulation.orgproduce a more complex cortical response than thatevoked by viewing a traffic light itself.Considering ERPs or VEPs, reports suggest that thecomponent P100 (occurring within approximately thefirst 100 milliseconds after the stimuli) varies with theamount of subject’s attention (Clark & Hillyard, 1996;Heslenfeld, Kenemans, Kok, & Molenaar, 1997;Kenemans, Kok, & Smulders, 1993; Mangun,Hillyard, & Luck, 1993).P300 was previouslyassociated with a red traffic light in a virtual drivingenvironment, while being absent when yellow trafficlights were perceived (Bayliss & Ballard, 1998).N400, observed at poststimulus latencies between250 and 550 ms, is usually associated with semanticintegration (Kutas & Hillyard, 1980, 1984) and withpseudo-action (Holcomb & McPherson, 1994; vanElk, van Schie, & Bekkering, 2008).In the present study, participants’ perception will belimited to vision only. Multichannel EEG will representparticipants’ cognitive response to the virtual trafficlight environment in the form of static images of trafficlights. We propose utilizing an alternative, spatialvector-based, approach in the analysis of cognitiveresponses in terms of VEPs, which comprises thenovelty of this study. We expect that different trafficlight colors may be linked to the specific VEP featuresand that it may be further possible to classify them.Not hypothesizing regarding the origins of perceptualchanges, the primary goal of the present study is tovalidate the proposed technique on detectingdifferences between the drivers’ cognitive responses(via EEG) evoked by the specific traffic light color.Material and MethodsThis study followed Lamar University InstitutionalReview Board guidelines and was approved by theLU IRB committee. The informed consent wasobtained from all study participants prior theexperimentation. No identifiable personal informationwas retained in the research data.Participants, Experimental Setup, and EEGAcquisitionContinuous EEG was recorded from four subjects(three males and one female, aged from 25 to 35years) with normal color vision, corrected to normalvision, at least one year of driving experience, nohistory of known neurological disorders, and withoutbeing tired or sleepy during data collection. Therecordings were performed using the AdvancedNeuro Technology (ANT, Netherlands) systemequipped with 32 electrodes positioned according toVol. 6(4):170–180 2019doi:10.15540/nr.6.4.170
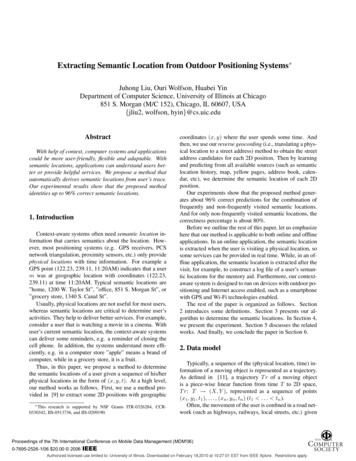
Sultana and TcheslavskiNeuroRegulationthe extended International 10/20 electrode placementmap. EEG was prefiltered in the 0.3–50 Hz range,notch-filtered at 60 Hz, sampled at 256 Hz, and storedin a computer for an off-line processing. One to sixEEG recordings were obtained per each participantunder the identical conditions; the EEG with lessvisible artifacts was selected for the further analysis.Visual stimulation consisted of images of traffic lightsignals presented via a multimedia projector on ascreen at approximately 2 meters in front of thesubject. The images were covering most of thesubject’s visual field and were displayed for 300 msfollowed by a black screen for 1500 to 2100 ms. Theimages of traffic light signals of different colors weredisplayed in a randomized order. A sample image ofthe red traffic light is shown in Figure 1.Figure 1. A sample image of the traffic light signal.Similar images of green and yellow traffic light signalswere also used for visual stimulation.EEG AnalysisEEG can be viewed as a stochastic, nonstationary intime, multichannel process. Due to its low magnitude(generally up to 100 V), EEG is often a subject tovarious artifacts that originate either from thesurroundings, body functions, equipment (externalartifacts), or from within the brain (internal artifacts).These artifacts are usually reduced to improveaccuracy of the EEG analysis. As an example, DCoffsets are normally removed from EEG before furtherprocessing. Additionally, spatial filters that reducesurface currents may improve the signal-to-noiseratio of EEG potentially improving the classification ofmental tasks (Mourino et al., 2001). One of such172 www.neuroregulation.orgfilters, a common average reference (CAR) spatialfilter, is particularly popular due to its robustness,good performance, and computational efficiency(Ludwig et al., 2009). Therefore, CAR spatial filterwas implemented in this project after DC offsets wereremoved from EEG.We have recently demonstrated that the discretewavelet transform (DWT) decomposition of the VEPscan be instrumental in their classification of theperceived color of traffic light (Hoque & Tcheslavski,2018). However, the reported approach requires thecomplete VEP being available for the processing and,therefore, may not be suitable for real-timeapplications. Selection of the most appropriate EEGchannels/electrodes contributing to the moreaccurate classification is another challenge. Besides,the temporal dynamics of VEPs may be of interest.Therefore, we propose an alternative approach toanalyze EEG data acquired while participants wereperforming cognitive tasks.The VEP Analysis: Its Limitations and anAlternative ApproachTraditionally, VEPs can be viewed as the time-lockedresponses that are treated as stimulation-specific.VEPs can be extracted by averaging the EEGsegments (epochs) synchronized with the specificrepetitive stimuli—the color of traffic light images, forinstance—and for the EEG electrodes associatedwith the visual cortex. Since differences in cognitionmay be of interest, the VEP components related toboth cognition and memory may be assessed. Oneof the objectives of the present project was todetermine whether the VEP components—such asP100, P300, or N400—are elicited in a virtual trafficlight environment and can be used for the traffic lightcolor classification.From a physics standpoint, discrete-time M-channelEEG can be viewed as a sampled in both time andspace version of a continuous spatial distribution ofan electric potential that evolves over time; hence aspatiotemporal distribution. From the mathematicalstandpoint, a discrete EEG epoch synchronized withthe external (visual, in our case) stimulation can beviewed as a collection of temporal vectors, whereeach vector corresponds to a specific EEG channel.It is safe to assume that only the selected channelswill contribute to VEPs. Another, perhaps lesstraditional, approach will be to consider such anepoch as a single spatial vector evolving over time.In this case, this vector at any time instance is aninstantaneous sample of continuous electric potentialrepresented by EEG that is sampled (in space) at theVol. 6(4):170–180 2019doi:10.15540/nr.6.4.170
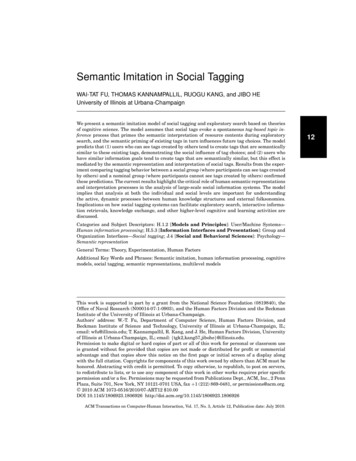
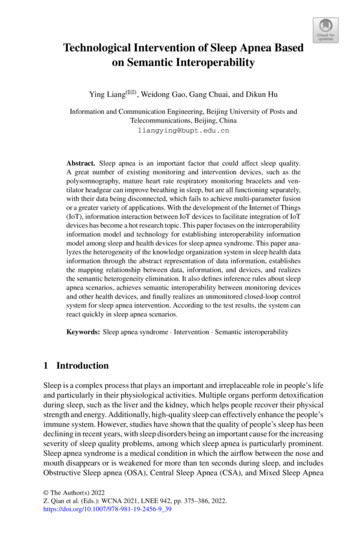
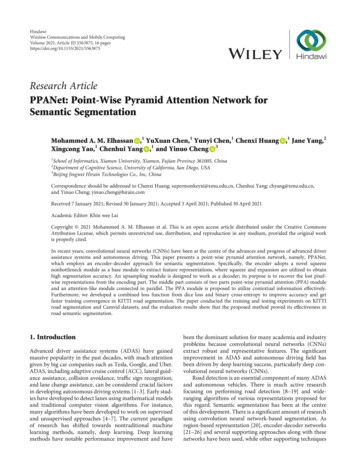
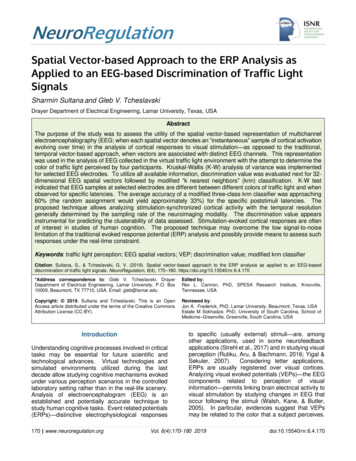
Sultana and TcheslavskiNeuroRegulationindividual electrodes’ locations. The cartoon diagramin Figure 2 illustrates this dual representationconcept.EEGchannel #a spatial vectorM* * * * * * * * * * *4* * * * * * * * * * *3* * * * * * * * * * *2* * * * * * * * * * *1* * * * * * * * * * *0n0 1 n0 3a temporalvectorTime index, nFigure 2. A schematic diagram of a dual representation ofan M-channel discrete EEG.The diagram in Figure 2 shows a traditional temporalEEG vector for the channel 3 that starts at the timeinstance n0 1 and is 9-sample long (blue dash–dotcontour) and a spatial EEG vector for all M EEGchannels and for the time instance n0 3 (green dashcontour). We may argue that the traditional temporalvector concept can be utilized to estimate VEPs;however, the spatial vector concept may be moreadequate for the analysis of the perception-relatedalterations in the temporal distribution of the corticalactivity. We will be using the latter, spatial vectorapproach.Selection of the Statistical Analysis TechniquesProblems involving assessment of statisticaldifferences between clusters of multidimensionalvectors emerge in many areas of science andengineering. Yet, no universally accepted approachseems to exist for their solution. One procedure toalleviate this problem is to reduce the assessedvectors to scalar quantities, such as vector norm or asingle judiciously selected coordinate of theexamined vector. Traditional statistical tools, such asANOVA, can be applied then to scalars. Adopting thespatial vector representation of EEG, the latter wouldlead to evaluating statistical differences between173 www.neuroregulation.orgEEG samples recorded from a specific electrode.This, however, will considerably reduce theinformation content available for the analysis. We willform the analysis statistics as single-channel EEGsamples corresponding to the specific poststimuluslatencies. Three groups of observations will beformed corresponding to red, yellow, and greencolors of traffic light images; each group will consistof 140 observations (4 participants, 35 repetitions ofeach stimulus per participant). Kruskal-Wallis (K-W)one-way analysis of variance will be conducted toassess whether samples originate from differentdistributions.On the other hand, addressing the outlinedshortcoming, Krauss et al. (2018) have recentlyintroduced the quantity referred to as discriminationvalue as means to analyze spatiotemporal corticalactivations; more specifically, to assess theirclusterability. In present study, EEG recordings werepartitioned into epochs synchronized with stimulipresentation allowing pre- and poststimulation buffersof 100 ms and 200 ms, respectively. However,instead of the traditional temporal representation,epochs were partitioned into spatial vectors of theinstantaneous EEG; that is, the vectors composedfrom the EEG recorded for a particular time instanceand for all available 32 electrodes. Since eachstimulus was repeated 35 times, three clusters ofsuch spatial vectors were formed containing 35vectors each. Intra- and intercluster Euclideandistances were evaluated between these vectors andthe instantaneous discrimination value (IDV) wasestimated for them as in (1). Please refer to theAppendix for the detailed description of the classifierdesign.In the present project, the initial k was selected as 10and the modified knn was implemented for threeclasses according to Figure A1. To evaluate theperformance of the classifier, leave-one-out crossvalidation was applied.Data analysis wasimplemented using MATLAB R2008a.ResultsAfter selecting the least contaminated EEGrecordings, Figure 3 illustrates the VEPs obtained byaveraging over 35 epochs corresponding to the red,green, and yellow images of traffic light evaluated forfour subjects and for three different EEG channels.Vol. 6(4):170–180 2019doi:10.15540/nr.6.4.170
VEP Amplitude, OzSultana and TcheslavskiNeuroRegulation51005-50VEP Amplitude, Cz-1010-55105500-5-5-1010-1042550000-2-510VEP Amplitude, Fz10-54-510-41055002500-2-5-1000100200300Latency, ms400-4500-1000100200300Latency, ms400-5500-1000100200300Latency, ms400-5500-1000100200300Latency, ms400500Figure 3. VEP amplitudes for four subjects, Oz, Cz, and Fz electrodes, and for three colors of traffic light images; bluevertical lines illustrate stimulation on- and offsets.Each column in Figure 3 represents a specificparticipant; the graph color represents the color of thecorresponding traffic light. In Figure 3, one canobserve well-pronounced VEPs evaluated fordifferent EEG electrodes.For instance, thoseevaluated for the first subject and for Oz channel (theupper left panel) resemble traditional flash VEPs withwell-defined P200 (approximate latency of 150 ms),N300 (past 200 ms), and P300 (approximately 340ms) components, while other participants producedsomewhat less pronounced VEPs. We also observeclear responses to the stimulation at electrodes, suchas Cz, not normally associated with the visual system.On the contrary, this channel, among other functions,is normally linked to the motor cortex. Similarly, thefrontal channel, Fz, is usually associated withmemory-related tasks and high-level informationprocessing, rather than just vision. Perhaps, welldefined responses at these channels may indicatethat the stimulation evokes a more complex responseincluding motor- and memory-related components inaddition to those from the vision-related corticalregions. Local extrema in these evoked responsesevaluated for different EEG channels appear atsimilar latencies for each participant. Therefore, wemay hypothesize that fusing information from different174 www.neuroregulation.orgEEG channels could lead to more comprehensivedescription of perception phenomenon.Close examination of Figure 3 shows that, althoughVEPs appear somewhat different for different stimuli(i.e., the color of traffic light), the observed alterationsdo not appear consistent between participants oreven between different EEG channels recorded fromthe same individual. We conclude that neither theshape nor the latency of VEPs evoked by images oftraffic lights of different colors appear contributing tothe reliable discrimination between cognitiveresponses to the images. Therefore, we assess theutility of the spatial vectors approach next. EEGepochs corresponding to three images of traffic lights(i.e., red, yellow, and green) were formed for eachparticipant. EEG was represented as collections ofinstantaneous spatial vectors. The dimensionality ofthese vectors is determined by the number of EEGchannels (32 in our study).The samplescorresponding to the specific channels—Oz, Cz, andFz—were used as observations in the Kruskal-Wallisone-way analysis of variance. The resulting Hstatistics is shown in Figure 4.Vol. 6(4):170–180 2019doi:10.15540/nr.6.4.170
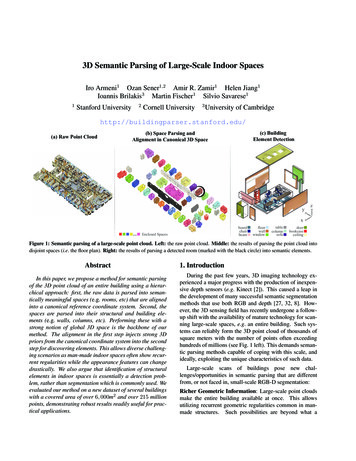
Sultana and TcheslavskiNeuroRegulationchi-square distribution and assuming the significancelevel of 0.05, we may conclude that the nullhypothesis of equal medians can be rejected for theEEG responses to different traffic light color at theselatencies. On the other hand, using EEG data from asingle electrode only may result in discardingimportant information. Additionally, spikes in Hstatistics after the stimulation off-set (i.e., for latenciesexceeding 300 ms) may be difficult to explain.Nevertheless, we may argue that local maxima in Hstatistics may indicate significant differences incortical activations observed in response to differentstimuli. We implement the discrimination valueutilizing all available EEG data followed by theclassification of spatial vectors of instantaneous EEG.OzCzFz121086420-1000100200Latency, ms300400500Figure 4. H-statistics evaluated by the Kruskal-Wallis testbetween instantaneous EEG samples corresponding to red,yellow, and green color of traffic light images and EEGelectrodes indicated in the legend, blue vertical linesillustrate stimulation on- and offsets.Figure 5 illustrates IDVs—according to (1)—and theaverage instantaneous classification accuracies(ACA) for the same EEG epochs that were used forevaluating VEPs in Figure 3.As seen in Figure 4, H-statistics exceeds 6 for thespecific latencies and EEG electrodes. Since thedistribution of H can usually be approximated by the-255-2-3050Instantenous Discrimination Value (IDV)-3-4504545 -5-5-440-540504045-103540-6-63535-7-7353030 -630-8-8-1525253025-9-9605545-4ACAIDV5025Average Classification Accuracy (ACA), percentKruskal-Wallis H-statistics1420-10-1000100 200 300Latency, ms400500-8-1000100 200 300Latency, ms40020-10500 -1000100 200 300Latency, ms40020-20500 -1000100 200 300Latency, ms400500Figure 5. Instantaneous discrimination values (IDV) and average instantaneous classification accuracies (ACA) for the threeclass modified knn classifier and for four participants. Blue graphs illustrate the IDV; red graphs represent ACA of a modified3-class knn classifier.One observation that can be made while examiningFigure 5 is that the IDV and ACA graphs are generallyopposite to each other; that is, local maxima in ACAare seen at approximately the same latencies as localminima in the discrimination value. The latter isconsistent with the expectation that more negativeIDV indicates more distinct clusters and, therefore, abetter classification performance can be expected.The ACA was evaluated as the average of thepercentages of correct classifications for the threeclasses (i.e., three traffic light colors) considered. For175 www.neuroregulation.orgsuch problems, a random assignment to classeswould lead to ACA of approximately 100/3 33%.Therefore, ACA exceeding 50% may indicate that theunderlying classification features (EEG spatialvectors) are indeed dissimilar between the differentclusters.We also observe that the classification accuracygenerally reaches its local maximum at the latencybetween 100 and 200 ms for all participantsassessed.Similar results (i.e., the oppositeVol. 6(4):170–180 2019doi:10.15540/nr.6.4.170
Sultana and TcheslavskiNeuroRegulationappearance of IDV and ACA and the highestclassification accuracy within the same latency range)were also observed for other EEG sets recorded fromthe same participants and under the identicalexperimental conditions (not included in the presentreport).Discussion and ConclusionsAlthough VEPs elicited by traffic light images ofdifferent colors appear dissimilar, such dissimilaritiesdo not seem to be consistent between the experimentsubjects. We may thus conclude that the traditionalVEP-based approach may be insufficient to reliablydetermine EEG alterations that may be related to thespecific color of traffic light that the individualperceives.On the other hand, the alternativetechnique handling EEG epochs as collections ofinstantaneous spatial vectors that are used as theclassifier’s feature vectors appears more promisingfor the EEG-based assessment of traffic lightperception. Furthermore, this approach appearssuitable for real-time processing (after the classifier istrained with the appropriate library of feature vectors).The well-established techniques assessing statisticaldifferences, such as ANOVA or Kruskal-Wallis tests,can be applied to the instantaneous EEG samplesevaluated for the individual electrodes priorattempting the classification of spatial vectors.Additionally, the discrimination value evaluated ental for predicting the outcomes of suchclassification.Positions of local ACA maxima shown in Figure 5 canbe related to the results of previous studies on humancognition. For instance, we may conclude that noreliable detection of traffic light color arises at thepoststimulus latencies prior 100 ms. The latteragrees with Thorpe, Fize, and Marlot (1996) whosuggested that the recognition of familiar objectsgenerally occurs within 150 ms after stimulus onset.Another local maximum in ACA that is evident for allassessed participants at the approximate latency of300 ms, perhaps, can be attributed to the P300component of VEP that was previously reported ascontributing to the classification of traffic light color(Bayliss & Ballard, 2000; Liang et al., 2005; Lin et al.,2007).We have observed that the classification performancewas greatly affected by the implemented EEGpreprocessing steps, especially by the baselinecorrection applied to epochs. Perhaps implementingmore sophisticated baseline correction methods may176 www.neuroregulation.orglead to an improved performance. Another potentialimprovement could be an incorporation of EEGartifact suppression techniques. Replacing the knnclassifier with more advanced methods may alsocontribute to a better performance.Addressing the possible limitations of the presentstudy, one such limitation is a relatively smallparticipant pool, although it may be sufficientconsidering the pilot nature of the report. Additionally,participants with more diverse background and ofbroader age range could be of interest. It is unclearwhether the observed discrimination between EEGvectors is due to the mere recognition of colors or tomore complicated perceptual mechanisms involvingthe environment analysis. Perhaps using images ofsolid color or colored figures for visual stimulation orincluding participants with no driving experiencecould provide further insight to this question.We hypothesize that the temporal resolution of theproposed technique is mostly determined by thesampling rate of the neuroimaging modality used (i.e.,EEG in the present study). Therefore, increasing thisrate may improve the temporal resolution of thestimulation-related analysis. It may also be of interestto apply the proposed technique for theinterparticipants comparison of cortical activationsevoked by the identical stimulation, althoughindividual cognitive specifics may diminish the utilityof such comparison.Based on the reported results, we conclude thatrepresenting stimulation-synchronized EEG epochsas collections of spatial vectors may better reveal thetemporal structure of event potentials and that thediscrimination value is instrumental for the predictionof clusterability (i.e., whether the analyzed data setcan be partitioned into distinct clusters) of eventrelated cortical activity.Due to the very low signal-to-noise ratio in EEG,evaluating ERPs normally requires averaging overmultiple EEG epochs collected in response to thesame stimulus. The latter severely limits the use ofevoked potentials in real-time applications includingneurofeedback, in which the effectiveness of operantconditioning decreases dramatically with the numberof seconds between the behavior and thereinforcer/punishment (Sherlin et al., 2011). Althoughthe spatial vector-based analysis also assumescollection of the library of responses (EEG epochs inour study) to train the classifier, the classificationstage may occur in real time. This advantage of theproposed technique may make it attractive forVol. 6(4):170–180 2019doi:10.15540/nr.6.4.170
Sultana and TcheslavskiNeuroRegulationapplications requiring instantaneous feedback.Finally, we further hypothesize that the spatial vectorbased approach may also be instrumental for othermultichannel neuroimaging techniques, such asmagnetoencephalography (MEG).AcknowledgmentsAuthors express their gratitude to previous membersof ADSPRL, especially to Md Zobayed Ali, for theircontribution to the project and participation in EEGacquisition.Author DisclosureThis study was funded by Lamar University. Theauthors declare that the research was conducted inthe absence of any commercial or financialrelationships that could be construed as a potentialconflict of interest.ReferencesBayliss, J. D., & Ballard, D. H. (1998). The effects of eye trackingin a VR helmet on EEG recording. Technical Report 685,University of Rochester National Resource Laboratory for theStudy of Brain and Behavior.Bayliss, J. D., & Ballard, D. H. (2000). A virtual reality testbed forbrain–computer interface research. IEEE Transactions onRehabilitation Engineering, 8(2), 188–190. https://doi.org/10.1109/86.847811Clark, V. P., & Hillyard, S. A. (1996). Spatial selective attentionaffects early extrastriate but not striate components of thevisual evoked potentials. Journal of Cognitive Neuroscience,8(5), 387–402. https://doi.org/10.1162/jocn.1996.8.5.387Duda, R. O., Hart, P. E., & Stork, D. G. (2000). PatternClassification, 2nd edition. New York, NY: Wiley.Heslenfeld, D. J., Kenemans, J. L., Kok, A., & Molenaar, P. C. M.(1997). Feature processing and attention in the human visualsystem: An overview. Biological Psycho
Drayer Department of Electrical Engineering, Lamar University, Texas, USA Abstract The purpose of the study was to assess the utility of the spatial vector-based representation of multichannel electroencephalography (EEG; when each spatial vector denotes an "instantaneous" sample of cortical activation