Transcription
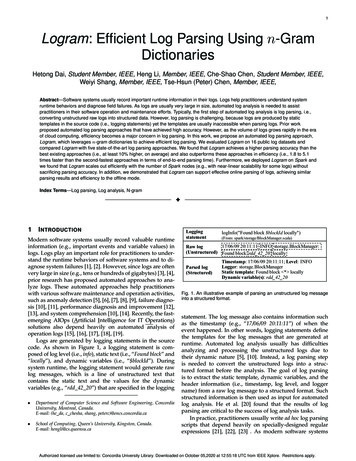
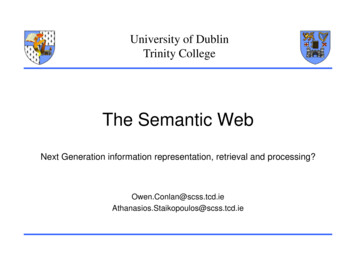
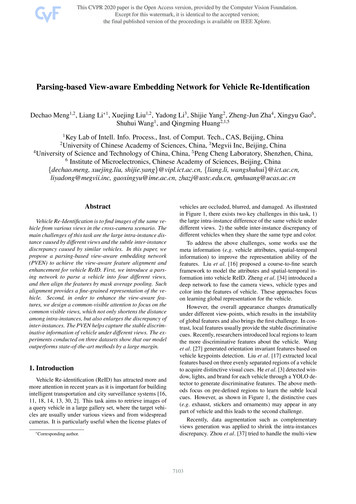
3D Semantic Parsing of Large-Scale Indoor SpacesIro Armeni1 Ozan Sener1,2 Amir R. Zamir1 Helen Jiang1Ioannis Brilakis3 Martin Fischer1 Silvio Savarese112Stanford UniversityCornell University3University of Cambridgehttp://buildingparser.stanford.edu/(a) Raw Point Cloud(c) BuildingElement Detection(b) Space Parsing andAlignment in Canonical 3D Spaceyzx.boardchairbeamEnclosed ilingFigure 1: Semantic parsing of a large-scale point cloud. Left: the raw point cloud. Middle: the results of parsing the point cloud intodisjoint spaces (i.e. the floor plan). Right: the results of parsing a detected room (marked with the black circle) into semantic elements.AbstractIn this paper, we propose a method for semantic parsingof the 3D point cloud of an entire building using a hierarchical approach: first, the raw data is parsed into semantically meaningful spaces (e.g. rooms, etc) that are alignedinto a canonical reference coordinate system. Second, thespaces are parsed into their structural and building elements (e.g. walls, columns, etc). Performing these with astrong notion of global 3D space is the backbone of ourmethod. The alignment in the first step injects strong 3Dpriors from the canonical coordinate system into the secondstep for discovering elements. This allows diverse challenging scenarios as man-made indoor spaces often show recurrent regularities while the appearance features can changedrastically. We also argue that identification of structuralelements in indoor spaces is essentially a detection problem, rather than segmentation which is commonly used. Weevaluated our method on a new dataset of several buildingswith a covered area of over 6, 000m2 and over 215 millionpoints, demonstrating robust results readily useful for practical applications.1. IntroductionDuring the past few years, 3D imaging technology experienced a major progress with the production of inexpensive depth sensors (e.g. Kinect [2]). This caused a leap inthe development of many successful semantic segmentationmethods that use both RGB and depth [27, 32, 8]. However, the 3D sensing field has recently undergone a followup shift with the availability of mature technology for scanning large-scale spaces, e.g. an entire building. Such systems can reliably form the 3D point cloud of thousands ofsquare meters with the number of points often exceedinghundreds of millions (see Fig. 1 left). This demands semantic parsing methods capable of coping with this scale, andideally, exploiting the unique characteristics of such data.Large-scale scans of buildings pose new challenges/opportunities in semantic parsing that are differentfrom, or not faced in, small-scale RGB-D segmentation:Richer Geometric Information: Large-scale point cloudsmake the entire building available at once. This allowsutilizing recurrent geometric regularities common in manmade structures. Such possibilities are beyond what a
single-view depth sensor would provide, as they have partof one room or at most few rooms in their scope.Complexity: Existing semantic segmentation methods designed for small-scale point clouds or RGB-D images arenot immediately applicable to large-scale scans due to complexity issues and the fact that choosing a set of representative views from an unbounded number of feasible singleviews is non-trivial.Introduction of New Semantics: Large-scale point cloudsof indoor spaces introduce semantics that did not exist insmall-scale point clouds or RGB-D images: disjoint spaceslike rooms, hallways, etc. Parsing a raw point cloud intosuch spaces (essentially a floor plan) is a relatively new andvalid problem.Novel Applications: A number of novel applications becomes feasible in the context of whole building pointclouds, such as, generating space statistics, building analysis (e.g., workspace efficiency), or space manipulation (e.g.,removing walls between rooms).Aforementioned points signify the necessity of adopting new approaches to semantic parsing of large-scale pointclouds. In this paper, we introduce a method that, given araw large-scale colored point cloud of an indoor space, firstparses it into semantic spaces (e.g., hallways, rooms), andthen, further parses those spaces into their structural (e.g.floor, walls, etc.) and building (e.g. furniture) elements (seeFig. 1). One property of our approach is utilizing in semantic element detection the geometric priors acquired fromparsing into disjoint spaces, and then, reincorporating thedetected elements in updating the found spaces (Sec. 3.2).Another key property is reformulating the element parsing task as a detection problem, rather than segmentation.Existing segmentation paradigms start with the assumptionthat each point must belong to a single segment/class. However, the problem of building element parsing better fits adetection approach. Clutter can occlude parts of importantelements, e.g. a white board can occlude a wall. To a segmentation technique, this wall would be an irregular entitywith a hole on it, while detecting the wall as a whole provides a better structural understanding of it (see Sec. 4).The contributions of this paper can be summarized as:I) We claim and experimentally evaluate that space dividers (i.e. walls) can be robustly detected using the emptyspace attributed to them in the point cloud. In other words,instead of detecting points belonging to the boundaries of aroom, we detect the empty space bounded by them.II) We show that structural and building elements can berobustly detected using strong geometric priors induced byspace parsing. We demonstrate satisfactory parsing resultsby heavily exploiting such features.III) We collected a large-scale dataset composed of colored 3D scans1 ) of indoor areas of large buildings with var1 Collectionof points with 3D coordinates and RGB color values.ious architectural styles. A few samples of these spaces canbe seen in Fig. 1 and 5. We annotated the semantic spacesand their elements in 3D. We further collected a set of RGBD images registered on the colored point cloud to enrich thedataset (not used by our method). Annotations are consistent across all modalities (3D point cloud and RGB, anddepth images). The dataset, annotations, the code and parsing results of the proposed framework are available to public at buildingparser.stanford.edu.2. Related WorkWe provide an overview of the related literature below,but as a brief summary, the following main points differentiate our approach from existing techniques: 1) processing a large-scale point cloud of an entire building (indoorspaces), rather than one or few RGB-D images, 2) detectionof space dividers (walls) based on their void (empty) spacerather than planar-surface/linear-boundary assumptions, 3)utilizing a set of geometric priors extracted in a normalizedcanonical space, 4) adopting a detection-based approach,rather than segmentation, to element parsing.Semantic RGB-D and 3D segmentation have been investigated in a large number of papers during the past fewyears. For instance, [31, 25] proposed an RGB-D segmentation method using a set of heuristics for leveraging 3Dgeometric priors. [22] developed a search-classify basedmethod for segmentation and modeling of indoor spaces.These are different from our method as they address theproblem in a small-scale. A few methods attempted usingmultiple depth views [30, 15], yet they as well remain limited to a small-scale and do not utilize the advantages ofa larger scope. [23] performed semantic parsing of buildings but for outdoor spaces. To parse a panoramic RGBD image, [42] uses the global geometry of the room andcuboid like objects. Though an RGB-D panorama includesmore information than a typical RGB-D image, it is notas comprehensive as a 3D point cloud. There also exist many object detection methods developed for RGB-D.These methods either try to extend the RGB methods directly into RGB-D by treating depth as a fourth channel[14, 20, 32, 27, 3] or use external sources like CAD models[33]. These methods use image-specific features and do notextend to point clouds. They are also not designed to handlelarge structural elements, such as floor and ceiling.In the context of floor plan estimation, [4] proposed anapproach based on trajectory crowd sourcing for estimatinga floor plan, while we use an automatically generated 3Dpoint cloud. [39] reconstructed museum type spaces basedon Hough transform which is challenged in cluttered scenes(as verified by our experiments), though their goal is not estimation of floor plan. [41] also employs similar planar surface assumption in order to estimate the semantics of a single room using contextual information. [21] reconstructed
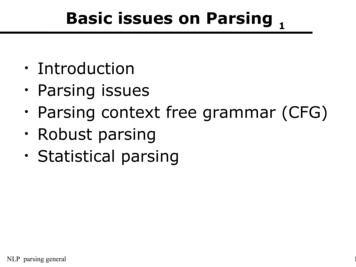
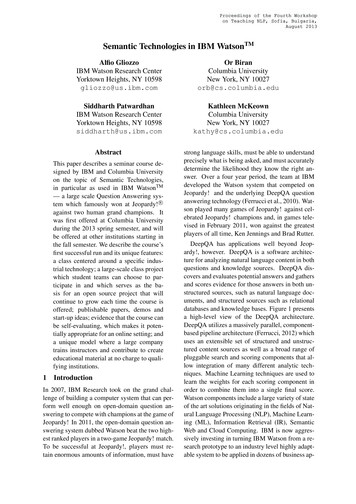
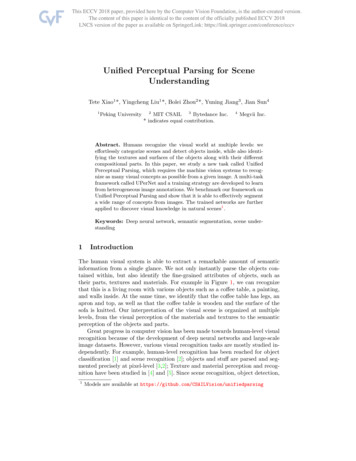
b. Convolution with Filter Banka.Point Clouda. Input Signal1/2cc. Max Pooling200150100yc δ cwx503500 12 10 8 6 4 20y2300MaxPool250200150c.b.Output Inputd. Final Space Dividers250100503500 12 10 8 6 4 20202x300250262830323420015010050262830Density Histogram32340 12Convolved Signal Peaks 10 8 6 4 2Maximum PeaksNMSFigure 2. Left: Convolution of the devised filter with the histogram signal. The Histogram signal along axis x is the histogram of xcoordinates of all points. Right: Space divider detection algorithm. We start with the density histogram signal (a), convolve it with thefilter bank (b), and perform max-pooling (c) to identify the space dividers (d).cluttered indoor spaces but their method as well as that of[24] require prior knowledge of scan locations and extraction of planar patches as candidate walls. [37] generateda minimalistic floor plan by first triangulating the 2D floorplan and then merging adjacent segments to obtain the finalspace partitioning. Their approach does not handle occlusions effectively and requires the scan locations. Liu et al.[19] reconstructed a building in 3D given monocular imagesand the floor-plan. On the contrary, we find the floor-plan aswell as semantic elements therein given a 3D point cloud.3. Parsing Point Cloud into Disjoint SpacesOur hierarchical parsing method starts with parsing thewhole building into spaces that are semantically meaningful(e.g. rooms). This step yields an understanding of the spatiallayout and the spaces therein, which will play a central rolein the formulation of the second step (Sec. 3.2).3.1. Detection incorporating void spacesEach scanned element in a point cloud is represented as agroup of points encompassing its inner void (empty) space.The scanned points belong to the exterior surfaces of theelement since only this outer shell is visible to a 3D sensor.However, the inner void is a crucial component in definingthe element and its overall shape. This perspective suggeststhat void space could be actively incorporated in detectingand understanding 3D elements.Space dividers (e.g. walls) separating neighboring enclosed spaces are not an exception. Previous efforts towardsdetecting walls in point clouds overlook this and try to to fitplanar surfaces (e.g. [41]) or linear boundaries employingalgorithms, such as RANSAC or Hough Transform. Theseare easily challenged in practice since walls are often cluttered with furniture, and sometimes even not visible.In contrast, we follow the “void-based” approach and detect space dividers based on their signature in point clouds:a space divider is depicted as a void space bounded by twocoarsely parallel margins. This signature remains robusteven if the enclosed space is severely cluttered, since wedo not detect surfaces or space boundaries but the void in-between. This is shown in Fig. 2 left (b) which depictstwo adjacent rooms. The wall and its void space are indicated with red lines. If we form a 1 dimensional histogram of density of points along the x axis (i.e. the signalin Fig. 2 left (b)), the wall appears with the signature of twopeaks with an empty space in-between. Attempting to finda wall through detecting planar surfaces would be equivalent to looking for peaks in this signal. As apparent, manystrong peaks (e.g. due to the bookcase or table side) appearwhich make detection of walls difficult. Instead, the peakgap-peak structure is significantly more discriminative androbust. This signature is one of the useful consequences ofhaving the point cloud of the entire building at once.3.1.1 Detecting the peak-gap-peak patternIn order to detect the peak-gap-peak pattern, we follow atemplate matching approach using a bank of peak-gap-peakfilters and perform the matching operation via convolutionson a density histogram signal (Fig. 2 left (a)). This filterbank is shown in Fig. 2 right (b) and has the characteristic oftwo peaks separated by void with varying widths. The bluecurve in Fig. 2 left (c) is the convolution response whichshows the filter has strongly responded to the peak-gappeak signature and suppressed the other peaks. It shouldbe noted that the employed filter assumes buildings withroughly planar walls, and hence, does not handle circularand oval shaped rooms or other configurations that deviate from the major axes of the building. However, as nonrectangular rooms make up for a considerably small portionof indoor space layouts [34], this assumption is consideredreasonable. A remedy to irregular walls/rooms would be toemploy a similar approach, but with a 2D filter bank thatis also parametrized over curvature. Since though they account for a small portion, the practical importance of thisimprovement would not be obvious.In greater detail, given a raw point cloud, we first alignthe three main axes 2 of x y z with the general struc2 We used PCA. However, there are other methods dedicated to this task(Manhattan frame estimation) that could be employed off-the-shelf in morecomplex cases [13, 35].
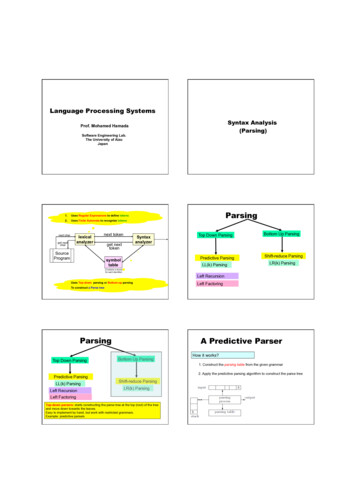
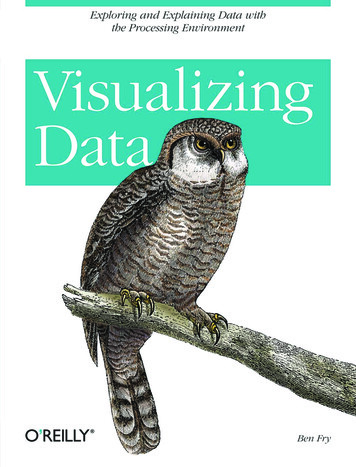
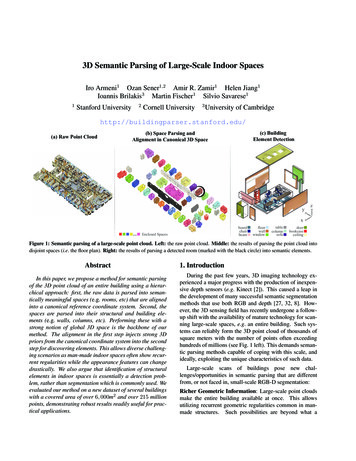
a. Raw Point Cloudb. Oversegmentationc. Neighbor GraphNeighboring segmentsd. ConnectedComponent Graphe. Merged Resultsf. After ElementDetectionConnected segmentsFigure 3. Merging the over-segments: We start with a set of over-segments (b) generated from the point cloud (a) and create their neighborgraph (c). Then, we merge nodes (d-e) as explained in Sec. 3.1.2. We update (f) the results given the output of element detection (Sec. 4.2).ture of the building. We form a 1 dimensional histogramof density of points along one of the three axes, say H(s).Then, we create a bank of filters parametrized by the passwidth (c) and the stop-width (δ) as shown in Fig. 2 right (b).1The filters can be represented as gδ,c (s) 2CΠ δ C (s) 212C Π δ2 (s) where Πk (s) 1[ s k] and 1[A] is an indicator function which is 1 when A is true and 0 otherwise.We compute responses of filters when convolved withH(s) as shown in Fig. 2 right (b). Each convolution resultsin a 3-dimensional score function over the axis of choices and the parameters c and δ. We then apply max-poolingacross s (i.e. pooling parameters are c and δ) to detect a setof wall candidates over the axis of choice. Finally, we applynon-maximum suppression to detect the final wall locations(see [5] for details). We use a bank of filters and poolingsince the shape characteristics of space dividers (e.g. width)is not known a priori.The found dividers decompose the point cloud into slicesalong the direction of the detection axis. We then performthe same procedure for the 2nd and 3rd axes on each sliceto fully partition the point cloud. Since we process eachaxis independently, any divider is elongated in its originaldirection resulting in an over-segmented grid (see Fig. 3(b)). This is due to the fact that we detect the dividers ina 1-dimensional manner (i.e. by considering one axis at atime). This reduction to 1 dimension enables us to scale tolarge point clouds (linearly with respect to covered area),but it cannot count for the fact that a divider may not extend across the entire building, thus leading to an oversegmentation. In order to efficiently recover the correct segmentation, we perform a series of merging operations.3.1.2 MergingIn order to merge the over-segments, we adopt a bottomup approach by recursively merging neighbors. We form agraph in which each oversegment is represented by a node,and edges exist between each node and its closest spatialneighbors (see Fig. 3 (c)). We then examine each edgefor the existence of a divider between its incident nodes.We check this by detecting the peak-gap-peak on the chunkof point cloud formed by the two incident nodes using thesame method of Sec. 3.1.1. If a divider is detected, theedge is removed from the graph. When all edges are examined, the surviving ones (shown in Fig. 3 (d)) denote theover-segments that should be merged. Therefore, the finalspaces (Fig. 3 (e)) are the Connected Components of thegraph with survived edges (each Connected Component isone space). Through transitivity, the merging operation canextend to any shape and size. In other words, any two oversegments with a path between them will be merged (e.g.,see the large room in the middle of Fig. 3 (a)).In summary, by exploiting the void-based principle wedeveloped an unsupervised, parameter-free and efficient algorithm to parse a large point cloud into disjoint spaces.3.2. Canonical Coordinate System Among SpacesDecomposing the raw point cloud into disjoint spacesprovides geometric priors for detecting semantic elements.This is mostly because spaces have recurrent structure andlayout configuration. This structure can be easily exploitedby creating a common coordinate system for all spaces.Specifically, we perform the following operations on one semantic space (e.g. a room, hallway, etc.) to form an x y zCartesian reference coordinate system.I) We choose the (z) axis of the reference system as thegravitational axis.II) We align the x axis along the entrance to the room.Consequently, y axis will be perpendicular to the entrancewall. (see [5] for details).III) We then scale the space into a unit cube by simplynormalizing the coordinates of the aligned points to rangein [0,1]. This allows better generalization and informationtransfer across different spaces and buildings.
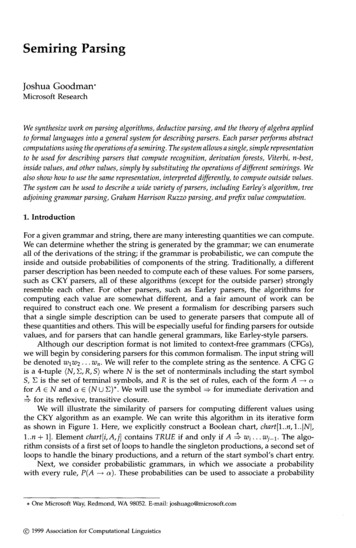
An example reference system is shown in Fig. 4. Thisprocedure puts each space in a unit cube aligned across alldetected spaces. It results in a geometric representation ofit in a single and coherent coordinate system. Such a procedure is not straightforward in the conventional single-view3D or RGB-D scans since global context is not captured.4. Parsing Disjoint Spaces into ElementsGiven a space in the common reference system, we wishto detect and label the semantic elements therein.Parsing-by-Detection: Structural building analysis andaugmented reality are some of the applications that benefitfrom parsing a point cloud into semantic elements. An analysis of such applications suggests that assuming every pointmust belong to one class, as in the conventional segmentation paradigm, is not a concrete assumption since it resultsin elements of incomplete geometry (e.g. hole in wall segment due to clutter). The applications can benefit from anotion of the parsed element and its structural characteristics as a whole regardless of occlusions (Sec. 1). Also, thereis always a considerable number of points that either do notbelong to any class or are not in the interest of the application. Hence, we argue that a more suitable approach isdetecting and localizing each element, rather than segmentation.Representing Detections: Our detection framework follows a 3D sliding window approach; we slide a set of candidate windows (boxes in 3D) for each class and classifyif there is an object of the class of interest in the window.These classifiers, window sizes, and their shapes are alllearned.In order to learn the size and shape of the candidate windows, we first need a representation for 3D windows. Sincethe semantic spaces are normalized with respect to the common coordinate system, our candidate windows should liein it as well. In addition to the size, we also need to represent the shape. We create K-by-K-by-K voxel grid bydividing the window into equal sized sub-3D windows anddefine the occupancy pattern Bi for i [K by K by K]as Bi is 1 if the sub-window i is part of the shape and 0 otherwise. To summarize, a candidate window is representedby its position P (location of the bottom-left corner in thecommon coordinate system), its 3D size S in the unit cube,and its occupancy pattern B.To classify each candidate window as an object or not weneed a set of features which can discriminatively representthe geometry and appearance of the volume specified by thewindow. Since our points lie in the normalized unit cube,P and S are informative about the global geometry of thewindow with respect to the space (global features). We alsocompute a set of features for each occupied sub-window aslocal geometry and appearance features (local features). WeTable 1. Features that represent each 3D window. The numberin the parenthesis shows the dimensionality of the feature component.Global FeaturesPSPosition: normalized position of the 3D window (3)Size: normalized size of the 3D window (3)Local Features (per voxel l [K K K])Bl Occupancy: 1 if l is occupied, 0 otherwise (1)dl Ratio: ratio of the number of points in the l to theClr , Clg , Clrnxl , nyl , nzlκtotal number of points in the window (1)Color: average color of the points in the l (3)Normal: surface normal of the points in the l (3)Curvature: Surface curvature of points in the l (1)list our features in Table 1 and visualize them in Fig. 4.Learning to Detect Elements: Our learning approach consists of learning candidate window shapes and learning object detectors. Learning candidate windows: In order tolearn a dictionary of candidate detection windows, we compute a set of detection windows as the tightest boundingboxes and their occupancy pattern for each element in thetraining data. We then group this set into clusters usingAffinity Propogation [11] with distance metric intersectionover-union and the occupancy pattern. After clustering, wecompute a single detection window per cluster with sizeequal to the average of the cluster members size and occupancy pattern equal to the mode of that of the cluster members. Training element detectors: In order to learn the element detectors, we use linear classifiers such that given afeature vector Φ of the detection window and the classifierw, Φ w τ means the candidate window corresponds toa semantic element. We train a linear classifier per classvia LIBLINEAR [10]. Negative examples include both elements of other classes and randomly mined hard negatives.Semantic Element Proposal Generation: Our learningprocedure results in element detectors we and a dictionaryof shapes per class. Given the learnt parameters, we use asliding window approach to detect element proposals. Ateach sliding position, the SVM detectors are evaluated foreach shape atom in the dictionary. The resulting detectionsare further eliminated with non-maximum suppression producing a final set of proposals as {(Di , ei , li )}1.N whereDi is the position of the detection, ei is the label of the semantic element class, and li is the detection score .4.1. Enforcing Contextual Consistency using CRFThe element proposal generation step does not exploitthe context of space, as all elements are generated with noexplicit consideration of others. However, there is a strongcontext among semantic elements since the location of onegives a prior over the location of the others. To exploit thisproperty, we employ a graphical model based approach.
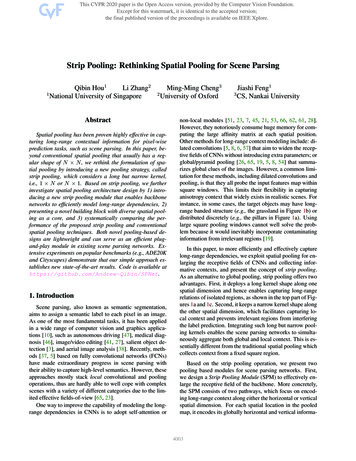
(1,0,1)occupancycurvature[B, d, C r, Cg, Cb, nx, ny, nz, κ]ratio colornormalfilters. We then remove edges from the graph when no wallis found and use a connected components graph to form thefinal space parsing (see Fig. 3 (f)).S (Sx, Sy, Sz)(1,0,0)z ysizeP (P x, P y, P z )(0,1,0)5. Experimentsposition(0,0,0)xFigure 4. Detection box in the unit cube reference coordinatesystem and features for a sample object (table). Our featuresare the detection anchor point, size and features of each sub-box.Features of non-occupied voxels are 0 (see Table 1 for all features).Given a collection of detection proposals, we want tochoose a subset of them as the final elements. We defineour model based on a graph G(V, E) in which the nodescorrespond to the detection proposals and the edges modelthe relationship among elements. Each node is connected toitsPke nearest proposals from each class e. Hence, we have( e ke )kVk edges. For each node, we want to infer if itshould be in the final detection set or not which results ina binary label space as yv {0, 1}. The edge features areΦe (v,w) [Bv , Bw , Sv , Sw , Pv Pw , ], where · is theabsolute value function. The unary feature is the detectionscore acquired from the SVM classifier.Following the log-linear model [16], we predict the finalelements as a maximization problem of the energy function:XXarg maxw0 lv yv yv yu (weu ,ev · Φu,v ) , (1)yv V(u,v) Ewhich can be written as an integer program by introducingauxiliary variables yuv yu yv u, v V as:XXarg maxw 0 lv y v yvu (weu ,ev · Φu,v )yv Vs.t.yuv yu(u,v) E u V, v N (u)s.t.yu yv yuv 1(2) u, v E.This maximization is performed using an off-the-shelfLP/MIP solver and the weight vectors w are learned usingStructured SVM [36]. Our implementation follows the existing S-SVM-CRF implementations [17, 18, 29] and thedetails can be found in the supplementary [5].4.2. Updating the Disjoint Space Parsing ResultsSince ‘wall’ is one of the classes in the element detection step, we utilize the identified walls to update the spacedividers found by the peak-gap-peak method of Sec. 3.1.1.This may recover the walls missed by the peak-gap-peakfilters as the element detection step incorporates additionalfeatures, such as, color or local geometry. In a similar wayto the merging operation discussed in Sec. 3.1.2, we obtainthe neighbors graph of the found spaces, and for each pairof neighbors we check if there is a detected wall in the connection area; the only difference is that the walls now comefrom the element detection step and not the peak-gap-peakIn this section, we present our experimental results andshare the insights we drew from them. We also showcasethem in [6].5.1. DatasetOur dataset is composed of five large-scale indoor areas from three different buildings, each covering approximately 1900, 450, 1700, 870 and 1100 square meters (totalof 6020 square meters). These areas show diverse properties in architectural style and appearance and include mainlyoffice areas, educational and exhibition spaces, and conference rooms, personal offices, restrooms, open spaces, lobbies, stairways, and hallways are commonly found therein.One of the areas includes multiple floors, whereas the resthave one. The entire point clouds are automatically generated without any manual intervention using the Matterport [1] scanner (only 3D point clouds; no images used byour method). Parts of these areas can be seen in Fig. 5.We detect 12 semantic elements, which are structuralelements (ceiling, floor, wall, beam, column, window anddoor) and commonly found items and furniture (table,chair, sofa, bookcase and board). Notice that these classesare more fine-grained and challenging than many of the semantic indoor segmentation datasets [32, 40].5.2. Parsing into Disjoint SpacesThe qualitative results of the proposed space parsingmethod for several sample areas in the dataset are providedin Fig. 5. Parts (a), (g), and (e) show the raw point cloud,manually generated ground truth, and our results beforethe update step, respectively. Part (d) illustrates the oversegmented space before merging which shows the effectiveness of the merging step. It is worth mentioning thatthe hallways are sometimes over-segmented although theybelong to one segment in the ground truth. This is attributedto “bottleneck” areas in some hallways which in combination with their narrow width creates the illusion of a spacedivider in the density histogram. However, after updatingthe parsed spaces such issues are resolved (Part (f)).Baselines: We compare our method with a RANSAC-basedplane fitting and a Hough transform-based line fitting methods. These approaches were used in two prominent [28, 39]papers in this area. Even though their goal is not space parsing their intermediate results can be adopted. To make thebaselines appropriate for space segmentation we post process their detections and well tweaked their parameters. Theresults shown in Fig. 5 and Table 2 were achieved usingthese parameters.
b. HoughTransform [39]c. RANSAC[28]d. Ours(oversegmented)e. Ours(merged)f. Ours(updated)g. Ground TruthArea 3Area 2(2nd floor)Area 1a. RawPoint CloudFigure 5. Space Parsing Qualitative Results.Table 2. Evaluation of space parsing (floor plan generation).BuildingfinalOursover-segmRANSACbased [28]2D Houghbased antitative Results: Table 2 provides quantitative resultsfor space parsing. We adopt the standard unsupervised clustering metric Adjusted Rand Index (ARI) [26] as the measure. Given the ground truth and the parsing result, ARIconsiders all feasible matching between space labels andcomputes a weighted average of accuracy of each matching. Both the final and oversegmented results of the proposed method outperform the baselines.5.3. Parsing into Semantic ElementsBaselines: We compare our method against the top performing algorithms from the KITTI object detection [12]dataset, mBOW [7] and Vote3D [38]. We only compareagainst the algorithms only using point clouds, not RGB-D.In order to evaluate the contribution of each feature, wealso compare against: No Local Geometry: We remove thesurface normal (nxl , nyl , nzl ), point densities (dl ) and the curvature (κ) from the feature set to evaluate the importance oflocal geometry, No Global Geometry: We remove the normalized position Pix , Piy , Piz to evaluate the i
Figure 1: Semantic parsing of a large-scale point cloud. Left: the raw point cloud. Middle: the results of parsing the point cloud into disjoint spaces (i.e. the floor plan). Right: the results of parsing a detected room (marked with the black circle) into semantic elements. Abstract In this paper, we propose a method for semantic parsing