Transcription
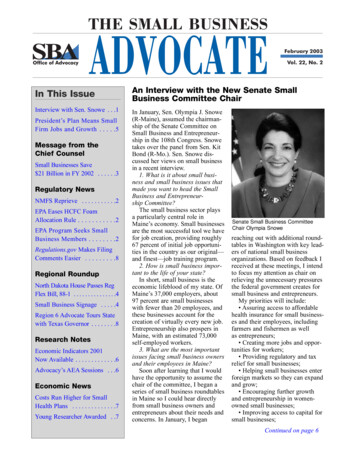
Design of a Small–Scale Biodiesel Production SystemJeffrey Anderson, Jessica Caceres, Ali Khazaei, Jedidiah Shirey Abstract – The city of Fredericksburg is located in centralVirginia and is home to 592 farms covering 16% of the totalland area. Farms in this region have experienced decliningprofits from an average of 555 per farm in 1997 to - 14,931per farm in 2007. One of the ways to reduce operating costs andreturn to profitability is to significantly reduce diesel costs. Analternative to purchasing diesel is to produce biodiesel fromvegetable oil extracted from crops grown on the farm and sellthe excess biodiesel that is not used. The goal of this paper is todesign the process and evaluate the financial feasibility ofconverting farm crops into biodiesel using a small-scalebiodiesel production facility on a farm.Five crops were selected as design alternatives based onregional availability, productivity, and cost criteria: Canola,Corn, Peanut, Soybean, and Sunflower. These alternatives wereevaluated using two Monte Carlo models: (1) a BiodieselProduction Model to simulate the amount of biodiesel and otherbyproducts produced and (2) a Business Model to simulate thenet present value of each alternative after 15 years. Thebiodiesel production model inputs are: (i) expected crop yield,(ii) oil content percentage, and (iii) oil press efficiencypercentage. The outputs of this model are: (i) biodiesel yield, (ii)meal yield, (iii) glycerin yield, and (iv) net energy ratio; each ofthe yield outputs is an input for the financial model. Otherinputs for the financial model include meal revenue, equipmentcosts, chemical expenses, planting and harvesting costs, lostprofit cost, and biodiesel sales. The output is the net presentvalue of each crop alternative at the end of 15 years.Utility of each crop alternative from first to last is as follows:Peanut (1.0), Sunflower (0.68), Canola (0.55), Soybean (0.52),and Corn (0.45). Plotting utility against net present value showsthat Canola is the most cost-effective alternative and therecommended crop type.I. INTRODUCTIONFredericksburg, Virginia is an independent cityapproximately 50 miles south of Washington, D.C. andencompassed by the counties of Spotsylvania and Stafford.These two counties are home to 592 farms ranging from 1 to2,000 acres, with an average size of 115 acres. These farmshave a total of 72,000 acres of farmland, of which over34,000 acres are cropland [1].The United States Department of Agriculture (USDA)defines a farm as “any place from which 1,000 or more ofagricultural products were produced and sold, or normallyManuscript received April 1, 2013. This work was supported in part byDr. Terence Thompson of North Point Farm. All authors are students at theVolgenau School of Engineering, Department of Systems Engineering andOperations Research, George Mason University, Fairfax, Virginia 22030United States of American.J. Anderson (email: jander12@gmu.edu), J. Caceres (email:jcaceres@gmu.edu), A. Khazaei (email: akhazaei@gmu.edu), and J. Shirey(email: jshirey@gmu.edu).would have been sold, during the census year” [1]. The valueof sales is the amount of income generated by the selling ofagricultural commodities. Essentially, it is the farm’spaycheck before expenses. In 2007, 41.6% of farms in theFredericksburg area had value of sales below 1,000, and0.34% had value of sales greater than or equal to 500,000.The USDA further defines farms by size: small farms arefarms with 250,000 or less in sales of agriculturalcommodities [2]. In 2007 over 98% of the farms inFredericksburg were, by USDA definition, small farms.This paper is specifically interested in these farms.The income of operation or income from operations (IFO)is the total profit realized by a business after all costs arededucted from all business related income to include totalsales, government payments, and other farm related income[1].For the years 2002 and 2007, USDA data shows that thetotal income from operations (IFO) of Fredericksburg farmsis negative. The average income from operations for farms inFredericksburg has decreased from approximately 500 peryear in 1997 to approximately - 15,000 per year in 2007 [1],[3], [4].The total farm IFO deficit has increased over 77% from 2.45 million in 2002 to 4.33 million in 2007. Data alsoshow that the year 1997 was the last time farmers had apositive IFO [1], [3], [4]. Farmers are collectively and onaverage losing money. Any business sustaining losses suchas these will not be sustainable in the long run.A factor affecting profit is the increase of farm productionexpenses from approximately 23,800 per farm in 1997 to 30,500 per farm in 2007. Oil price dependent categoriessuch as fertilizers, lime, and soil conditioners and gasoline,fuels, and oils have increased by 122% and 137%respectively from 1997 to 2007 [1], [4]. Collectively, thesecategories make up 21% of the total production expenses.The price of diesel in the Central Atlantic Region of theUnited States has increased by nearly 230% since 1997 [5],causing production expenses to rise as the cost of oil pricedependent categories increases.An alternative to purchasing diesel is to produce biodieselfrom vegetable oil extracted from crops grown on the farm.II. BIODIESEL PRODUCTIONBiodiesel is a biofuel made from living or recently livingorganisms such as algae, animal fats, or vegetable oils andcan be used in diesel engines without the need for enginemodification. Biodiesel is biodegradable and a cleaning andlubricating agent which helps increase the life of dieselengines.
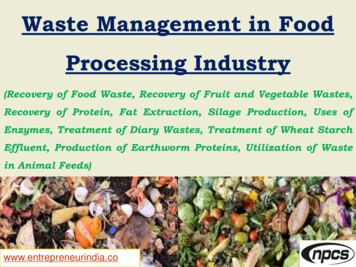
A. Biodiesel Production ProcessFig. 1 depicts the biodiesel production process on a farm.B. Neighboring FarmersThe main objective of the neighboring farmers in regardsto biodiesel is to minimize safety hazards. They do not wantto be affected by hazardous spills that can cause land orwater contamination, or be affected by odors that may becaused by biodiesel production.C. WorkersFarmers that decide to produce their own biodiesel offerthe opportunity for new jobs in Fredericksburg. Theworkers’ objective is to earn a salary by helping with theproduction process of biodiesel for the primary stakeholder.Safety is also an important matter; working in a safeenvironment minimizes the risks involved in the productionprocedures, helps them perform their duties correctly andavoids possible extra expenses due to accidents. The farmerwill have to provide them with proper safety gear such asboots, gloves, face shield, and goggles to be able to handlehazardous materials in a safe manner.Fig. 1. The biodiesel production process involves 5 major steps: (1) Selecta crop to use for vegetable oil, (2) Plant crop and harvest when fully grown,(3) Extract oil from harvested crop, (4) Perform transesterification toconvert vegetable oil to biodiesel, and (5) Use or sell biodiesel and otherbyproducts of process. Step (3) is performed by a vegetable oil press andStep (4) is performed by a biodiesel processor.B. HazardsAs part of the transesterification process, methanol and acatalyst, potassium hydroxide, are used. Each of thesechemicals has the potential to be hazardous if not usedcorrectly. Methanol is flammable and can be ignited underalmost all ambient temperatures. Potassium hydroxide is anirritant and cause serious damage if exposed to human skin.Although potentially hazardous, these chemicals pose nosignificant risk to human operators if handled with care.C. Net Energy RatioThe net energy ratio is the units of energy obtained frombiodiesel divided by the units of energy that go into biodieselproduction. If the net energy ratio of an energy source is lessthan 1, then the amount of energy required to produce thatsource is greater than the amount of energy gained fromusing it and is therefore not beneficial. Thus, a requirementof the biodiesel production system is that biodiesel beproduced with a net energy ratio greater than 1.III. STAKEHOLDER ANALYSISA. FarmersFarmers located in the Fredericksburg area are the primarystakeholders for this project. The farmer’s main objective isto make money by reducing operating costs and producing aquality product to sell. Producing their own fuel has thepotential to reduce operating costs and cause the farmer togain a positive net profit. The farmer also must minimize theamount of land dedicated to producing biodiesel in order tocontinue to profitably produce and sell crops.D. Food ConsumersOne of the disadvantages of increased biodieselproduction in the United States is possible food shortage inthe future. Farmers choosing to plant more acres of cropsdedicated to biodiesel production will also be less likely tomeet market demand for food in the long-run. This decisioncan cause the food crop supply to decrease and result inincreasing crop prices. Thus, it is essential that farmersselect a crop type that maximizes biodiesel yield so that theimpact on food supply is minimized.E. GovernmentThe government’s objective is to promote non-pollutingalternative fuels while also achieving energy independence.They are interested in increasing the United States’ nationalenergy security, improving air quality and public health, anddeveloping economic, academic, and research opportunitiesin the Commonwealth of Virginia. Government agencies,such as the Internal Revenue Service (IRS) and the VirginiaDepartment of Taxation, support increasing biodieselproduction by creating tax incentives and giving grants tobiodiesel producers.F. Stakeholder TensionsNeighboring farmers want to make sure that the biodieselproduction is done in a safe manner and will not causehazardous spills, water and land contamination, or thepresence of unpleasant odors on their property. Employeesneed to be provided with the appropriate working gear toavoid hazardous accidents. Preventing these accidents fromoccurring will increase biodiesel production expenses andcreate tensions between farmers and their neighbors andemployees. As biodiesel production increases, decreasingfood supplies will create tensions between farmers andconsumers. Lastly, the government provides incentives forthe production of alternative sources of fuel, but they alsohave regulatory agencies that control and regulate biodiesel
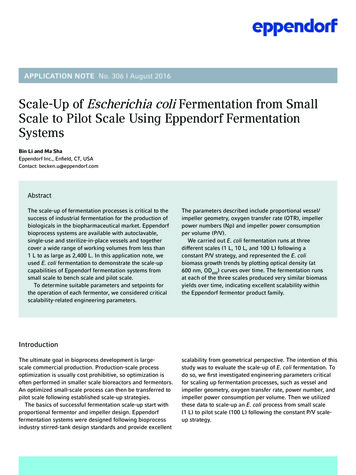
production and make sure it is done in a safe manner.Farmers who want to sell biodiesel have to abide by theAmerican Society for Testing and Materials (ASTM)Standard D6751 [6] which specifies the requirements forbiodiesel that is sold. Producing biodiesel according to thisstandard can increase production costs as it requires precisemeasurements and quality storage containers.The biodiesel system designed in this project will mergethe needs and objectives of all the stakeholders and willcreate a win-win solution financially for all stakeholders.IV. STATEMENT OF NEEDA. Problem StatementIncreasing fuel prices and lack of net profit threaten thelong term sustainability of farms located in Fredericksburg.Farmers rely heavily on petrochemical diesel, which hasincreased in price by nearly 230% since 1997[5] - the lastyear that farmers in the Fredericksburg area of Virginia hadan average net profit.B. Statement of NeedThere is a need for a small-scale biodiesel productionsystem for farms located in Fredericksburg. The design ofthe biodiesel production system will take into account thewhole life-cycle process of biodiesel production, from cropplanting to the final biodiesel yield. A win-win situation forall stakeholders will be achieved by helping farmers savemoney on fuel costs through biodiesel production whilecreating new product to sell, providing farmers with theproper information to minimize hazardous spills and safetyrisks, minimizing the impact on food supplies byrecommending the optimal crop type, and furthering thegovernment’s goal of energy independence.V. DESIGN ALTERNATIVESTo produce biodiesel, four components are necessary: (1)a crop source, (2) a vegetable oil press, (3) a biodieselprocessor, and (4) a biodiesel storage tank. Detailed analysisof the off-the-shelf equipment (vegetable oil press, biodieselprocessor, and biodiesel storage tank) showed that they weresimilar in performance and cost and did not provide anyadvantages from one to another. This left the most criticalaspect of the design, the vegetable oil source. This decisionexhibits the most amount of variability (e.g. crop yield),affects the productivity of the process (i.e. biodiesel yield peracre), and has the most significant yearly impact on costs.Five crop alternatives were identified based on regionalavailability, productivity, and cost criteria: Canola, Corn,Peanut, Soybean, and Sunflower. These crops vary in theamount of vegetable oil they contain, as well as in theamount of valuable byproduct (meal and glycerin) that theyproduce.Of these crop alternatives, Peanut, Soybean, and Corn arecurrently grown in Virginia as crops whereas Canola andSunflower are not widely grown (although the climate isfavorable for their growth).VI. METHOD OF ANALYSISThe method of analysis includes three processes: theBiodiesel Production Model, the Business Model, and theutility function. The Biodiesel Production Model simulatesthe expected value for the biodiesel yield for each alternativeand the Business Model simulates the expected net presentvalue (NPV) associated with each alternative at the end ofthe system lifespan. The utility function is based on a valuehierarchy containing three discriminators: biodiesel yield(gallons per acre) and length of planting, harvesting season(days), and the hazard level. Biodiesel yield values aresupplied by the Biodiesel Production Model. The utility ofeach alternative will be plotted versus the NPV of eachalternative in the utility analysis.Each model is a Monte Carlo simulation, and therelationship between the two models is depicted in Fig. 2.Fig. 2. Monte Carlo simulation containing two models: BiodieselProduction Model and Business Model. Biodiesel Production Modelsimulates the expected yield of biodiesel and other byproducts which arethen inputs to the Business Model. The Business Model accounts for all ofthe variable costs associated with biodiesel production and calculates theNPV at the end of 15 years.A. Model AssumptionsThe following assumptions were made for the model:1) The lifespan of the machinery is 15 years2) The farm contains 75 acres of cropland3) There is no salvage value for the machinery at theend of the system lifespan4) Farmers own the proper equipment to plant andharvest crops5) There exists unlimited demand for biodiesel,glycerin, and meal6) After the first year of biodiesel production, all fuelneeds will be supplied by the previous year’sbiodieselB. Biodiesel Production ModelIn order to model the uncertain nature of biodieselproduction, crop yield and vegetable oil press efficiencywere used as random variable inputs. Distributions for the
crop yield are based on historical crop yields for theFredericksburg area (Corn) [1], the state of Virginia (Canola[11] and Peanut [12]), and the United States (Sunflower [13]and Soybean [14]). The outputs of the biodiesel model areexpected biodiesel yield, expected glycerin yield, expectedmeal yield, and the net energy ratio. These values werecalculated using (1), (2), and (3) below [7], [8]. Table I liststhe variables used to calculate the yields.TABLE Iis the initial machinery investment,is the net cashflow in year t, is the discount factor, is the inflation rateper year, and n is the number of years. Values for p wereobtained from the U.S. Bureau of Labor Statistics inflationforecast [9] and the duration of the model was determined tobe 15 years based on the lifespan of the machinery. Equation(5) was used to calculate the net cash flow for each year [10],and Table II describes the variables for (5).BIODIESEL PRODUCTION MODEL VARIABLESSymbol(5)DescriptionTABLE IIBUSINESS MODEL VARIABLESBiodiesel Yield per Acre (gallons)Crop Yield per Acre (lbs)Oil Content by Weight (percentage)Pounds per Gallon of Biodiesel ( 7.6 lbs/gal)Oil Press Efficiency (percentage)Meal Yield per Acre (lbs)Glycerin Yield per Acre (gallons)Glycerin Yield Ratio (0.105)Biodiesel Yield Ratio (0.9885)SymbolChemical expenses (dollars per acre)Crop costs (dollars per acre)Opportunity cost (dollars per acre)Glycerin revenue (dollars per acre)Meal revenue (dollars per acre)Biodiesel sales (dollars)Biodiesel acreage on farm (acres)Yearly maintenance costs (dollars)State biodiesel incentives (dollars per acre)(1)(2)The output of this model is the net present value ofbiodiesel production for each crop after 15 years.VII. RESULTS(3)The factor with the largest impact on the yield amount isthe crop yield and the oil content of the crop - both of whichare random variables based on historical data from theUSDA. The alternatives range from 4% oil content for cornto 43% oil content for sunflower. Meal yield is inverselyproportional to the vegetable oil content of the crop; high oilcontent tends to produce lower meal yield. Meal and glycerinyield were calculated because these byproducts can be soldto offset the cost of biodiesel production. The yieldequations were used to calculate the expected yields for eachyear that the simulation was run.C. Business ModelThe random variable inputs for the model include theoutputs from the Biodiesel Production Model (biodiesel,glycerin, and meal yield) as well as planting and harvestingcosts, opportunity cost, meal revenue, and glycerin revenue.Opportunity cost represents the profit lost by not selling thecrop as a food source. Other inputs are machinery costs,chemical costs, state biodiesel incentives, and the number ofacres committed to biodiesel production. The output is theNPV for each crop alternative. Equation (4) was used tocalculate the NPV for the lifespan of the system.(4)DescriptionA. Biodiesel Production Model50,000 iterations of each simulation were run with theassumption that the farm had 75 acres of cropland. Ninesimulation scenarios were run for biodiesel acreage of 10,15, and 20 acres and discount rates of 2%, 5%, and 7%.Table III shows the results of the Biodiesel ProductionModel ranked from highest yield per acre to the lowest.These factors are not affected by the biodiesel acreage or thediscount rate and remain constant for each simulationscenario.TABLE IIIPRODUCTION MODEL l Yield136 gal/acre62 gal/acre102 gal/acre35 gal/acre19 gal/acreNER4.093.053.431.770.84Corn has the lowest biodiesel yield at 19 gallons per acre.Canola and Peanut have significantly higher biodiesel yields– about 5 and 7 times the Corn yield respectively.As a result, Corn has a NER that is significantly lower thanthe other crops because the amount of biodiesel from corn islower. The NER for Corn is lower than 1 and does not meetthe requirement that biodiesel be produced with a NERgreater than 1. Peanut and Canola have relatively high NERconsistent with the higher biodiesel yield.0.84
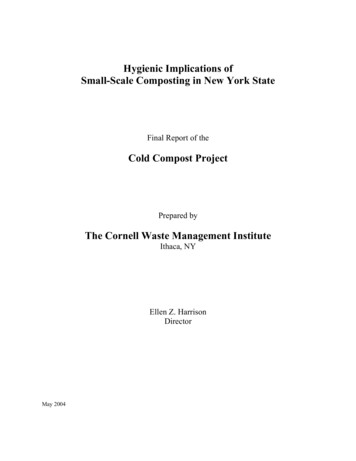
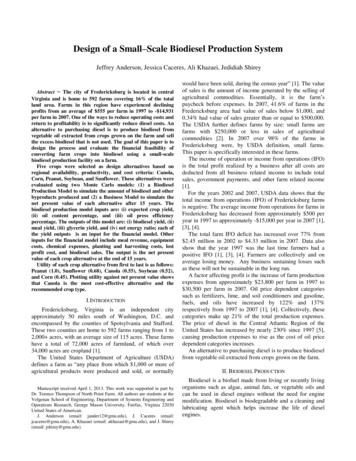
B. Business Model ResultsFig. 3 shows the mean net present value results for eachcrop alternative for a discount rate of 2%.Fig. 5. Based on the average NPV results, Corn and Canola each achieve apositive ROI within 2 years. No other crops achieve a positive ROI.Fig. 3. Based on the average NPV results, Corn produces a positive returnon investment (ROI) within 5 years and is the only alternative that producesa ROI. Corn has the lowest biodiesel yield but the highest meal yield whichprovides a significant contribution to profit.With 10 acres committed to biodiesel production, Corn isthe only alternative with a positive average NPV. Based onthe NPV distribution, Corn has an 80% chance of achievinga positive NPV. Canola has a 14% chance of achieving apositive NPV. Peanut, Soybean, and Sunflower all have a0% chance of achieving a positive NPV.Fig. 4 shows the average NPV for the next scenario: 15acres dedicated to biodiesel production.Fig. 4. Based on the average NPV results, Corn and Canola achieve apositive ROI within 3 and 5 years respectively. No other crops achieve apositive ROI. Sunflower and Soybean are almost identical in average NPVin Fig. 4.When increased to 15 acres, Canola has a 90% chance ofachieving a positive NPV. Corn increases to an 86% chance.Peanut and Soybean have a 0% chance of a positive NPV.Sunflower has less than 1% chance of a positive NPV.Fig. 5 shows the average NPV for the next scenario: 20acres dedicated to biodiesel production.At 20 acres producing biodiesel, there is a 99% chance ofa positive NPV when using Canola. Corn increases to an88% chance of a positive NPV. Peanut and Soybean have0% chance of a positive NPV. Sunflower increases to a 10%chance of a positive NPV.As the number of acres committed to biodiesel increases,the mean NPV for Corn and Canola and the probability of apositive NPV increase significantly. Increased acreage has aminimal negative impact on Peanuts and Soybeans and aminimal positive impact on Sunflower. Scenarios with thehigher discount rates of 5% and 7% mirror these results butwith numbers of smaller magnitude.C. Sensitivity AnalysisSensitivity analysis was conducted for the price of dieseland the number of acres committed to biodiesel production.In order for Peanut to produce a positive NPV, diesel priceswould have to increase to 13.00, 7.50, and 6.50 dollars pergallon for 10, 15, and 20 acres of biodiesel productionrespectively. Varying the number of biodiesel acres anddiesel prices cannot result in a positive NPV for Soybeans.Sunflower could attain a positive NPV if the number ofbiodiesel acres increased to 42 or if the price of dieselincreased to 17.50 and 8.50 dollars per gallon for 15 and 20biodiesel acres respectively.D. Utility AnalysisIn order to determine the best crop alternative, threefactors were analyzed in a value hierarchy: (1) Biodieselyield in gallons per acre with a weight of 0.5, (2) Length ofplanting and harvesting season in days with a weight of 0.3,and (3) Hazard level associated with biodiesel productionwith a weight of 0.2. These factors and their weights weredetermined through discussion with the project sponsor.Maximizing the biodiesel yield per acre is essential tominimizing the number of biodiesel acres and in turn theimpact on food supplies. The length of the planting andharvesting season measures the time until biodiesel can beproduced – a shorter time is more desirable. The hazardsassociated with biodiesel production all stem from thechemicals and catalysts that are mixed with the vegetable oil.Thus, all of the crop alternatives have the same level of
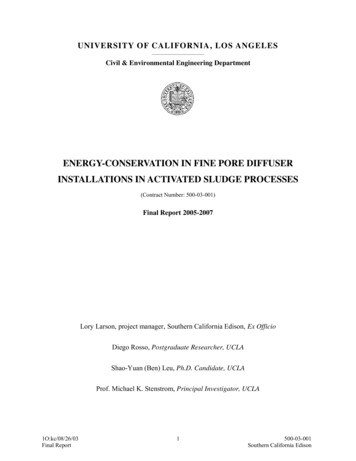
hazard. The method of analysis includes evaluating the utilityof each alternative in comparison to the NPV in order todetermine the best crop alternative. Fig. 6 shows the utilityfor each crop alternative plotted against the NPV (rangedfrom the minimum to the maximum on the 90% confidenceinterval) for 20 acres committed to biodiesel production.requirement. With the existing price for diesel, biodieselyield per acre, and planting and harvesting expenses,biodiesel production using Peanut, Soybean, or Sunflower isnot profitable.It is recommended that farmers in the Fredericksburgarea of Virginia implement biodiesel production usingCanola. Furthermore, by committing additional acres of landto biodiesel production farmers will be able to sell theunused biodiesel for a profit.ACKNOWLEDGMENTThe authors would like to thank Dr. Terry Thompson for hiscontribution as the sponsor of this project. Also, specialthanks to instructors Dr. Lance Sherry (lsherry@gmu.edu),Mr. Juan Mantilla, and Miss Lewis for contributing to thecompletion of this project.REFERENCES[1]Fig. 6. Utility vs Net Present ValueThe results of the utility analysis show that Peanut has thehighest utility but also the lowest NPV. Corn has the highestNPV but also the lowest utility and high NPV variability.Soybean and Sunflower both have moderate utility but anegative NPV. Canola has the middle utility but a positiveNPV. Table IV shows the alternatives ranked according toutility.TABLE IVRESULTS WITH UTILITY AND 410033700-3550040800Peanut, Soybean, and Sunflower all have a negative NPVwhich makes them infeasible to implement. Corn has apositive NPV but the low biodiesel yield results in a lowutility value. If the corn yield increased significantly, Corncould produce more biodiesel and become a more viableoption. Canola’s long planting and harvesting season resultsin a low level of utility. The high biodiesel yield allows thefarmer to sell the excess biodiesel for a profit.VIII. RECOMMENDATIONSFarmers committing 20 acres to biodiesel productionutilizing Canola can achieve a positive ROI within 2 years.When utilizing 20 acres of farmland, the Canola NPVdistribution has a 99% probability of achieving a positiveNPV at the end of 15 years at the 2% discount rate.Although biodiesel production using Corn is profitable,it does not provide sufficient biodiesel for the average farm’sneed and does not meet the minimum net energy ratioUSDA Census of Agriculture, 2007 Census, Volume 1, Chapter 2:County Level Data, [online] 7/Full Report/Volume 1, Chapter 2 County Level/Virginia/. Accessed 14 October 2012.[2] USDA Census of Agriculture, 2007 Census of Agriculture- SmallFarms, [online] 7/Online Highlights/Fact Sheets/Farm Numbers/small farm.pdf.[3] USDA Census of Agriculture, 2002 Census of Agriculture- SmallFarms, [online] 2/index.php.Accessed 14 October 2012.[4] USDA Census of Agriculture, 1997 Census of Agriculture- SmallFarms, [online] 1997/index.php.Accessed 14 October 2012.4.09 Administration. [online][5] United States Energy ndler.ashx?n pet&s emd ep3.05d2d pte nus dpg&f a. Accessed3.43 September 2012.[6] American Society for Testing of Materials. m. Accessed October 2012.0.84[7] S. Fore, W. Lazarus, P. Porter,N. Jordan, “Economics of small-scaleon-farm use of canola and soybean for biodiesel and straightvegetable oil biofuels”, Biomass and Energy, Volume 35, Issue 1,January 2011, Pages 193-202. le/pii/s0961953410002722[8] S. Hoover, “Energy balance of a grassroots biodiesel productionfacility.” es/energy-balance.[9] United States Bureau of Labor Statistics. pi/documents/US CPI Forecast -- Annual.pdf[10] D. Lopes, A. Neto, P. Martins, “Economic simulation of biodieselproduction: SIMB-E tool,” Energy Economics, 2011. iew.html[11] D. Starner, A. Hamama, H. Bhardwaj, “Prospects of canola as analternative winter crop in Virginia, 2002. /v5-127.html[12] USDA, National Agriculture Statistics Service, Crop Production.[online] xls[13] USDA, National Agriculture Statistics Service. [online]www.ers.usda.gov/datafiles/Oil Crops Yearbook./table20.xls[14] USDA, National Agricultural Statistics Service. [online]www.ers.usda.gov/datafiles/Oil Crops Yearbook 2012/table2.xls
Biodiesel is a biofuel made from living or recently living organisms such as algae, animal fats, or vegetable oils and can be used in diesel engines without the need for engine modification. Biodiesel is biodegradable and a cleaning and lubricating agent which helps increase the life of diesel engines.