Transcription
From hero to zero:Peabody Energy Corp.Case Study Competition 20151
TABLE OF CONTENTS1.Company Overview and brief market analysis . 32. Current market Trends – the Energy Market and the Coal sector . 72.1 Shale energy will be a game changer for the U.S. 72.2 Required investment to continue producing coal will rise over the next few years . 82.3 Increasing demand for energy will rebalance the energy-mix sources . 82.4 Natural Gas will make life harder for coal producers . 92.5 Regulations and environmental awareness will also be harder on coal producers . 102.6 Wind powered turbines are getting competitive and may hurt coal production. 113. Peabody’s Financial Status . 123.1. A path to leverage and decreased profitability . 123.2. Credit Rating. 164. Projections for 2020 . 18KERRISDALE CAPITAL INVESTMENTCASE STUDY COMPETITION2
From hero to zero: Peabody Energy Corp.1. Company Overview and brief market analysisPeabody Energy is the world’s largest private-sector producer and distributor ofcoal. Present in 25 countries, this company produces thermal coal for power generationas well as metallurgical coal used in producing steel. The company has been strugglingwith deteriorating prices, as the demand for coal was hit by low natural gas prices,increasing use of alternative energy sources and the global drive to reduce carbonemissions by cutting coal and other fossil fuel generated energy consumption.The company currently provides 10% of the electricity generated in the US and2% of the energy around the world. Peabody Energy is the market leader in the U.S.providing 18.6% of the total volume of coal produced (cf. Table 1) - an equivalent to183 275 thousand tons in 2013.Table 1 - Comparison of the top 4 producers in the US market (2014)KERRISDALE CAPITAL INVESTMENTCASE STUDY COMPETITION3
Peabody operates through the entire value chain, from mining the coal, to sellingand distributing it for electricity production and steelmaking. Peabody Energy alsomarkets, brokers and trades coal in the world’s fastest-growing economies.Analysing the US market, a very relevant market for Peabody Energy due to itsmarket size and overall Peabody Energy exposure, we can clearly see that the wholesector is suffering profound changes. At a first glance all but one of the top 4 producersshow very negative net incomes, and all of the companies are disinvesting heavily,which can seriously injure future profits by limiting the companies’ size in a capitalintensive sector. All the larger companies face lower gross margins than the sectoraverage, which could be a sign of how difficult it is for these companies to reduce theirsize without compromising future growth, due essentially to the weight of CapitalExpenditures in the business model.“Current prices are eliminating profit margins for a growing number of coalproducers. [.] Over half of China’s coal producers have cash costs in excess ofdomestic Chinese spot prices, and throughout the US higher cost miners are currentlyproducing at a loss.” – according to Carbon Tracker, a financial specialist concerningcarbon investments.Peabody’s current production and distribution is concentrated in the U.S. andAustralia, as we can see in the Figure 1. This geographical segmentation is severelypressuring the company. On one side, U.S. and Australian markets are more matureeconomies, with increased pressures to reduce carbon emissions and bringing upcompetitive energetic alternatives like Natural Gas or renewables, or event the recentgame changers Shale Gas and Oil. Fast-growing markets like China or India tend toKERRISDALE CAPITAL INVESTMENTCASE STUDY COMPETITION4
value price and efficiency whilst caring less for carbon emissions in this stage ofdevelopment, but these developing countries already have local producers which arebetter positioned in a scenario of higher concentration of Coal consumption worldwide.Exporting to these markets will remain a challenge due to: (1) stronger currency; (2)low to unexisthent local presence when compared to local competition - in markets withhigher market entry barriers than most developed countries; and (3) shipping costs.Figure 1 - Peabody’s coal sales from 2009 to 2013 by producting region.In its current geographies, Peabody Energy faces fierce competition in the coal miningmarket (Table 2). There are huge players like BHP Billiton, Rio Tinto PLC, GlencorePLC and China Shenhua Energy Co Ltd, most of them with higher EBITDA marginsand well diversified in the energy sector. Moreover, being China one of the mostimportant markets for coal mining we should note that this market already has wellestablished strong players - like China Shenhua Energy Co Ltd, the world’s largest coalmining enterprise. Due to that fact, Peabody Energy should not take the expectedgrowth in the Chinese coal market as granted, since it won’t be that easy to appropriatethe piece of the cake that could ensure some revenue. Actually, in 2014, Chinese coalKERRISDALE CAPITAL INVESTMENTCASE STUDY COMPETITION5
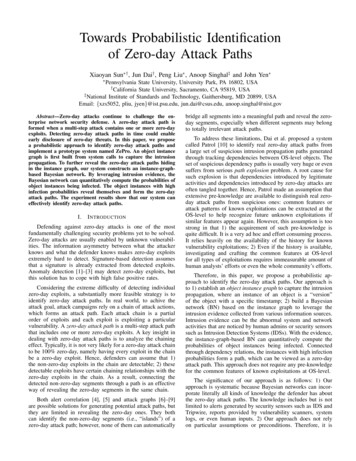
imports declined 35 million tonnes, since China itself faced oversupply, with theChinese Government intervening to close some facilities in order to keep prices stable.M arket shareMarket cap[1]( Millions)EBI TDAmargin (% )Coal revenueYOY (% )China Shenhua Energy Co Ltd3.40% 57,33431.87%12.79%Coal I ndia Ltd1.60% 38,62125.97%0.74%Glencore PLC1.60% 57,5623.61%1.63%China Coal Energy Co Ltd1.50% 11,17914.74%-4.70%BHP Billiton Ltd1.30% 133,05444.88%-7.88%Yanzhou Coal M ining Co Ltd1.10% 7,67615.88%-3.00%Peabody Energy Corp1.00% 2,03610.44%-13.17%Rio Tinto PLC0.70% 90,23635.24%-10.03%Anglo American PLC0.50% 26,13826.24%-11.31%Arch Coal I nc0.40% 2638.72%-20.00%CompanyTable 2 - Industry Market Leaders in coal mining worldwide1Overall, Peabody Energy has been suffering for all these effects in general, andthis has translated into a sharp decrease in its stock price (cf. Figure 2). Not only such achange in stock price is unusual, but given the future trends noted in the next part of thisreport, we believe the downfall will keep its negative pace steadily into bankruptcy.1Bloomberg, tail/coal-miningKERRISDALE CAPITAL INVESTMENTCASE STUDY COMPETITION6
Figure 2 - Evolution of Peabody’s stock value2. Current market Trends – the Energy Market and the Coal sector2.1 Shale energy will be a game changer for the U.S.According to Scott Nyquist and Susan Lund, in their November 11, 2014 article forForbes, Shale Revolution: Opportunity to Jump-Start Economic Growth, shale oil andshale gas have experienced high growth in the U.S. in the most recent years and shaleenergy is a true game changer for the U.S. economy. The U.S. Energy InformationAdministration projects 9.5 million crude oil barrels production per day in 2015 in theU.S., from 5 million barrels per day in 2008, mostly driven by shale production. Since2007, shale gas production has grown 51% per year. This type of energy is becomingmore efficient and proved reserves in the U.S are one of largest in the world, havingincreased five times since 2007. This will affect Peabody Energy as the U.S. is a keymarket for the company.KERRISDALE CAPITAL INVESTMENTCASE STUDY COMPETITION7
2.2 Required investment to continue producing coal will rise over the next few yearsDavid Mitchell from Datamonitor’s Energy and Sustainability section, a marketintelligence agency, states the UK as an example, noting that this also applies to othercountries:“The energy sector will also need a huge amount of investment in order to sustainwhere it is going. To give you a U.K. example, over the next 10 years, asignificant proportion of U.K. power generation capacity will come offline. So thecoal plants that we built 20 to 25 years ago will come offline. The amount ofmoney needed in the U.K. energy sector to rebuild those plants is about 200-300billion over the next 10 years. That’s many times more levels of investment thanhave ever been spent in that economy before. And the U.K. is not unique. Lots ofother countries will need to invest, and that investment will either come fromtaxpayers when the government makes those investments, or it will come fromtaxpayers paying higher energy prices.”This means that to keep the current production pace, the capital-intensive electricityproducers that use coal as an input will have to consider facing huge investments, notonly due to keep pace with innovative processes but also to keep their current plantsrunning safely. Considering the state of public finances in the overall developed world,it seems unlikely that a state/taxpayers intervention would come easy.2.3 Increasing demand for energy will rebalance the energy-mix sourcesThe 2013 International Energy Association annual report states that energy demand willrise continuously in the next coming years. However, this rise in demand will make wayfor a rebalance in the proportion of the contributing energy sources:KERRISDALE CAPITAL INVESTMENTCASE STUDY COMPETITION8
-Renewable energy sources, like wind and solar, will continue to increase theirshare in total energy production;-Most of the new energy demand will come from the transport andpetrochemical industries, both of which is based on oil;-Renewable energy consumption will see its subsidies more than double overthe medium term, but fossil fuel subsidies will remain high;Therefore, our analysis tells us that although energy demand will rise in the upcomingyears, due to these factors, fossil fuels will evermore concentrate on oil production andrenewable energy will be more competitive, implying a negative outlook for theimportance of coal in the future.2.4 Natural Gas will make life harder for coal producersAccording to MarketRealist’s analysis of the coal market, natural gas and coalare competing fuels for electricity generation. Since oil production is steadilyincreasing, and natural gas is a by-product of the oil production or can be producedmore intensively when oil prices go down - by deploying facilities to switch from oilproduction to natural gas production - the increase in natural gas production is leadingto ever cheaper natural gas, which has negative impact on the demand for coal. Theimpact can be seen in this Figure 3 - below that shows the US market share of these 2sources of electricity generation. Since the US is a major energy market and Peabody isvery exposed to the American market, this is another trend to take into consideration.KERRISDALE CAPITAL INVESTMENTCASE STUDY COMPETITION9
Figure 3 – US market share of coal and natural gas (2007-2014)2.5 Regulations and environmental awareness will also be harder on coal producersSince regulations are tightening in almost every market due to general increasingawareness concerning global warming and tax payers preference for greener solutions,cleaner energy solutions will make way for future capacity additions. This can be seenin the US market, especially if we take into consideration that it was one of thecountries which hasn’t signed the Kyoto treaty regarding CO2 gas emissions limits.According to the US Energy Information Administration of the 4350 Megawatts of newelectricity generating capacity that were added in the first half of 2014, renewableenergy accounted for around 42%, natural gas for around 53%, and zero to coal-firedcapacity. Therefore, coal is rapidly losing share in the total electricity output – from50% in 2004 to 37% in 2014.KERRISDALE CAPITAL INVESTMENTCASE STUDY COMPETITION10
Also, new regulations that impose a drastic reduction in carbon dioxideemissions are not only slowing future investments but turning existing facilitieseconomically weakened in order to comply with the necessary physical improvementsto obey the new environmental laws.2.6 Wind powered turbines are getting competitive and may hurt coal productionAccording to data compiled by Bloomberg: “Power from coal costs about 78.30 amegawatt-hour to produce and gas costs 69.71, compared with 82.61 for onshorewind farms”. The same source states that the cost of wind power has declined about90% in the past twenty years, decreasing 30 percent only in the last three years.Figure 4 – US power plant capacity additionsKERRISDALE CAPITAL INVESTMENTCASE STUDY COMPETITION11
3. Peabody’s Financial Status3.1. A path to leverage and decreased profitabilityDespite high revenue growth rates from 2009 until 2011 (Figures 5 and 6), since 2012Peabody Energy’s revenue has decreased at a fast rate. We can see that althoughrevenue has been volatile, the number of tons sold has remained stable over the years,which indicates that Peabody Energy is highly dependent on global coal prices and hasstruggled to increase its production sold, in spite of recent acquisitions.Source: Thomson Reuters Eikon in 18-02-2015, at 15:20hFigures 5 and 6 – Revenues, Cost of Revenues and Annual GrowthBut even more concerning is the sharp decrease in its gross margin (Figure 7).KERRISDALE CAPITAL INVESTMENTCASE STUDY COMPETITION12
Figure 7 - Peabody’s Gross Margin (2009-2014)Gross margin in 2014 was 15,8%, well below both the sector (24,2%) and the industryaverage (28,3%). Coal industry is capital intensive and has important fixed costs. Also,tons sold were stable during this period. As a result, the cost of revenue represents agrowing percentage of revenue. The implication is that the company doesn’t haveflexibility to reduce its production costs in case of a further decrease in revenue.Analyzing profitability ratios and the Operating and Net profit Margins (Figures 8 to11) is clear that Peabody Energy is losing both margins and profitability at a staggeringpace, performing well below the industry and sector average:KERRISDALE CAPITAL INVESTMENTCASE STUDY COMPETITION13
Return on AssetsPeabody Energy Corp8%Return on EquityIndustrySectorPeabody Energy -23%2014Figures 8 to 11 - Peabody’s Net Profit Margin, OM, ROA and ROE, Source: ThomsonReuters Eikon in 18-02-2015Profitability is falling, but we still need to see how the company is concerning liquidityand long-term solvency (Figures 12 and 13).Total Debt represented 219.5% of Equity in 2014, a value much higher than the industryand sector average (49.6% and 56.2% respectively). Long-term Debt represents anastounding 5.97 Billion and the Current Ratio is below one.Interest expensesaccounted in 2014 to 426.6 Million. With we should bear in mind that only incorporate bonds by 2016 650 Million will be due, by 2018 1.6 Billion and by 2020 650 Million2 and 1,2 Billion for a Term Loan Facility due in 2020.2MorningstarKERRISDALE CAPITAL INVESTMENTCASE STUDY COMPETITION14
Figures 12 and 13 - Peabody’s Current Ratio and Debt to EquityCurrent RatioPeabody Energy CorpTotal Debt/EquityIndustrySectorPeabody Energy : Thomson Reuters Eikon in 18-02-2015, at 15:20hPeabody Energy’s profitability is sharply decreasing and its debt is incredibly high. It isthen important to consider the cash flow evolution (Table 3).( M illion)200820092010201120122013TotalCash from Operating Activities1297.81.051.0871.6331.5157226.008Capital Expenditures(264)Cash from I nvesting Activities(383)(546)(847)(395,4)(406,5)(703,6)Long Term Debt I ssued0,00,01.150,04.101,4Net Change in Cash4045393061.034667541Free Cash Flow(986)(3.807,8) 6-240-1153997865293943.951Table 3 – Peabody’s Free Cash Flow; Source: Thomson Reuters Eikon in 18-02-2015, at 15:20hThe cash generated from operations has been decreasing, from 1.1297.8 in2008 to 722 Million in 2013. Operations have been generating less and less cash andthe company has relied on Debt to finance itself The company has successfully raisedsince 2009 until 2013 6.44 Billion to face the decrease in cash generation fromoperation and invest. From the press release in January 27, 2015 we see a furtherdecrease in the cash flows generated from operations in 2014, which totaled 336.6KERRISDALE CAPITAL INVESTMENTCASE STUDY COMPETITION15
Million. That is a 53.4% fall from the cash flow from operation in 2013. In December31, 2014 Cash & Equivalents were only 298 Million.In 2011, Peabody Energy acquired Macarthur Coal in a 4.9 Billion takeover, a movethat has yet to produce results.Furthermore, the company has reduced its capital expenditures and projects for2015 a 180-200 Million capital expenditure. This decrease in capital expenditures willhave an effect in an industry that needs new investments and innovation to face theenvironmental and technological challenges.Calculating the wide known Altman Z-score in 2013 to assess thefinancial distress of the company and the probability of going bankrupt within two yearswe reached a Z-score of 0.94. We used the formula: Z 1.2T1 1.4T2 3.3T3 0.6T4 0.999T5, where T1 Working Capital / Total Assets;T2 Retained Earnings /Total Assets; T3 Earnings Before Interest and Taxes / Total Assets; T4 MarketValue of Equity / Book Value of Total Liabilities; T5 Sales/ Total Assets. This meansthat Peabody Energy is in the “Distress” zone, as the Z-score is below 1.81.3.2. Credit RatingMoody’s, Fitch and Standard & Poor’s are unanimous3: the company’s financialinstruments are Non-investment grade speculative, just one level from becoming HighlySpeculative3Moody’s rates Peabody Energy Corp. as Ba3, both Fitch and Standard & Poor’s as BB-.KERRISDALE CAPITAL INVESTMENTCASE STUDY COMPETITION16
Figure 14 - Credit Default SwapsWe can see a huge increase in the cost to insure Peabody Energy bonds for the event ofdefault. The Credit Default Swaps for the company’s senior 5 year bonds are nowtrading close to 900 basis point when in February 2014 they were close to 300 basispoint. This market reaction shows how serious is the company’s current financialdistress.Figure 14 - Peabody Energy’s Bonds44Morningstar, in February 18KERRISDALE CAPITAL INVESTMENTCASE STUDY COMPETITION17
Taking a further look on Peabody Energy’s bonds (Figure 14) we see that for 6.50%Senior Notes due on 2020 corresponds a Yield to Matury of 10.85%, superior in 4.35percentage points to the coupon. This value shows that the market requires a highremuneration for the risk of lending money to Peabody Energy.4 - Projections for 2020Since we know that the quatity sold has been somewhat stable during the periodanalysed, we identified as a driver for revenues the evolution of the coal prices. Usingthe World Bank commodities price forecast in nominal U.S. dollars, released on January22, 2015 for Coal, Australia, we reach the following annual growth table:Annual GrowthCoal, .10%4.00%4.20%Table 4 – Coal price forecast, AustraliaWe applied this growth rate to the revenues and projected the following Free CashFlow5:( M illions)Free Cash 52.4407.3456.6495.82,178.50Table 5 – Projected FCF5Assumptions for projection: Gross Margin equal to three previous years’ average;Selling/General/Administrative expenses equal to three previous years’ average; value forProperty/Plant/Equipment remains constant; Unusual expense and other operating expenses equal to threeprevious years’ average; Total Interest Exp.(Inc.),Net-Operating equal to three previous years’ average;Capital expenditures equal to 200 Million yearly; no tax payments on negative operating income; taxused is US Corporate rate; Accounts Receivable Days, Accounts Payables Days and Days in Inventoryare constantKERRISDALE CAPITAL INVESTMENTCASE STUDY COMPETITION18
If we compare with the amount of cash needed to pay the debt until 2020 (Table 6):( M illions)Debt 4,004.20Table 6 – DebtIn our opinion, by 2020 Peabody Energy Corp. will go bankrupt. After analysing themarket and the company status:i.The company has a huge debt and it is not generating enough cash to repayit;ii.Operational margin has been decreasing with no signs of recovery;iii.Decreased demand on coal in preference of other less polluting sources ofenergy;iv.Mass extraction of shale gas and oil, increased efficiency of renewableenergy and natural gas competition;v.Assets, like mines, will start to lose value as coal is a declining sector, whatwill compromise an eventual sell.If the company fails to restructure its debt, we strongly believe bankruptcy is themost probable scenario.KERRISDALE CAPITAL INVESTMENTCASE STUDY COMPETITION19
Market cap[1] ( Millions) EBI TD A mar gi n (%) . Evolution of Peabody's stock value 2. Current market Trends . energy is a true game changer for the U.S. economy. The U.S. Energy Information