Transcription
Basics of LC/MSPrimer
ContentsWhy Liquid Chromatography/Mass Spectrometry?4Instrumentation6Ion SourcesElectrospray ionizationAtmospheric pressure chemical ionizationAtmospheric pressure photoionization6789Mass AnalyzersQuadrupoleTime-of-flightIon trapFourier transform-ion cyclotron resonance (FT-ICR)1010111112Collision-Induced Dissociation and Multiple-Stage MSCID in single-stage MSCID and multiple-stage MS131414Adapting LC MethodsSample preparationIonization chemistry161717Capillary LC/MS and CE/MS19Applications20Molecular Weight DeterminationDifferentiation of similar octapeptidesDetermining the molecular weight of green fluorescent protein202021Structural DeterminationStructural determination of ginsenosides using MSn analysis2222Pharmaceutical ApplicationsRapid chromatography of benzodiazepinesDetection of degradation products for salbutamolIdentification of bile acid metabolites24242425Biochemical ApplicationsRapid protein identification using capillary LC/MS/MS and database searching2626Clinical ApplicationsHigh-sensitivity detection of trimipramine and thioridazine2828Food ApplicationsIdentification of aflatoxins in foodDetermination of vitamin D3 in poultry feed supplements using MS3282830Environmental ApplicationsDetection of phenylurea herbicidesDetection of low levels of carbaryl in food323232CE/MS ApplicationsAnalysis of peptides using CE/MS/MS3434
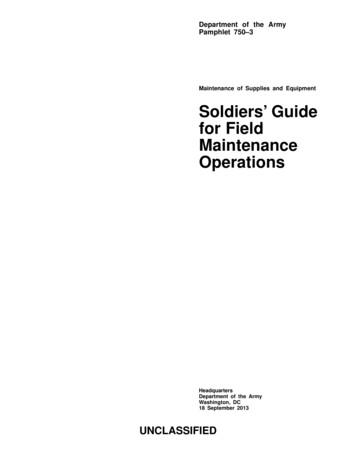
Why Liquid Chromatography/Mass Spectrometry?Liquid chromatography is a fundamentalseparation technique in the life sciencesand related fields of chemistry. Unlike gaschromatography, which is unsuitable fornonvolatile and thermally fragile molecules,liquid chromatography can safelyseparate a very wide rangeof organic compounds,from small-molecule drugmetabolites to peptidesand proteins.R% Rel. OOH% Rel. AbundanceTraditional detectors forliquid chromatographyinclude refractive index,electrochemical, fluorescence, and ultraviolet-visible(UV-Vis) detectors. Someof these generate twodimensional data; that is,data representing signalstrength as a function oftime. Others, includingfluorescence and diodearray UV-Vis detectors,generate three-dimensionaldata. Three-dimensionaldata include not only signalstrength but spectral datafor each point in time.Mass spectrometers also generate threedimensional data. In addition to signalstrength, they generate mass spectraldata that can provide valuable informationabout the molecular weight, structure,identity, quantity, and purity of a sample.Mass spectral data add specificity thatincreases confidence in the results of bothqualitative and quantitative analyses.m/zFigure 1. Two-dimensional abundance data and three-dimensionalmass spectral data from a mass spectrometer4
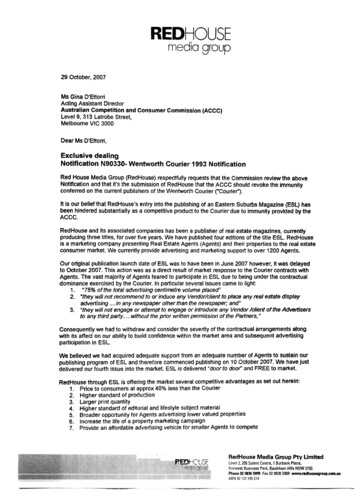
For most compounds, a mass spectrometer ismore sensitive and far more specific than allother LC detectors. It can analyze compoundsthat lack a suitable chromophore. It can alsoidentify components in unresolved chromatographic peaks, reducing the need for perfectchromatography.Some mass spectrometers have the ability toperform multiple steps of mass spectrometryon a single sample. They can generate amass spectrum, select a specific ion fromthat spectrum, fragment the ion, and generateanother mass spectrum; repeating the entirecycle many times. Such mass spectrometerscan literally deconstruct a complex moleculepiece by piece until its structure is determined.Mass spectral data complements data fromother LC detectors. While two compoundsmay have similar UV spectra or similar massspectra, it is uncommon for them to have both.The two orthogonal sets of data can be usedto confidently identify, confirm, and quantifycompounds.1200000MS 0m/z1325200100510152025303540min.Figure 2. Identification of three components in a chromatographically unresolved peak5
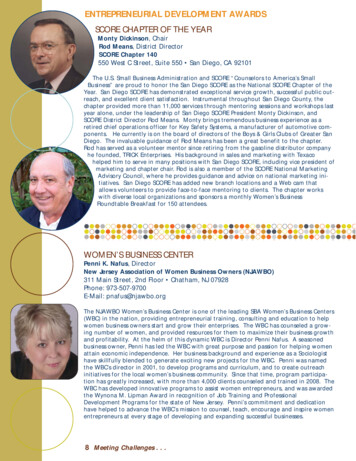
molecules from the analyte molecules (directliquid inlet, thermospray) or did so before ionization (particle beam). The analyte moleculeswere then ionized in the mass spectrometerunder vacuum, often by traditional electronionization. These approaches were successfulonly for a very limited number of compounds.InstrumentationMass spectrometers work by ionizing molecules and then sorting and identifying the ionsaccording to their mass-to-charge (m/z) ratios.Two key components in this process are theion source, which generates the ions, and themass analyzer, which sorts the ions. Severaldifferent types of ion sources are commonlyused for LC/MS. Each is suitable for differentclasses of compounds. Several different typesof mass analyzers are also used. Each hasadvantages and disadvantages depending onthe type of information needed.The introduction of atmospheric pressureionization (API) techniques greatly expandedthe number of compounds that can be successfully analyzed by LC/MS. In atmosphericpressure ionization, the analyte moleculesare ionized first, at atmospheric pressure.The analyte ions are then mechanicallyand electrostatically separated from neutralmolecules. Common atmospheric pressureionization techniques are:Ion SourcesMuch of the advancement in LC/MS over thelast ten years has been in the developmentof ion sources and techniques that ionize theanalyte molecules and separate the resultingions from the mobile phase. Electrospray ionization (ESI) Atmospheric pressure chemical ionization(APCI) Atmospheric pressure photoionization (APPI)Earlier LC/MS systems used interfaces thateither did not separate the mobile phaseFigure 3. Applications of variousLC/MS ionization techniques100,000Electrospray IonizationMolecular Weight10,0001000APPIAPCI10010NonpolarVery PolarPolarity6
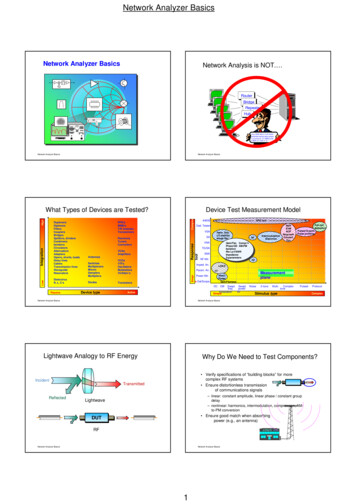
Electrospray ionizationElectrospray relies in part on chemistry to generate analyte ions in solution before the analytereaches the mass spectrometer. The LC eluentis sprayed (nebulized) into a chamber at atmospheric pressure in the presence of a strongelectrostatic field and heated drying gas.IonsNebulizer gasSolvent spray Some gas-phase reactions, mostly protontransfer and charge exchange, can alsooccur between the time ions are ejectedfrom the droplets and the time they reachthe mass analyzer.Electrospray is especially useful for analyzinglarge biomolecules such as proteins, peptides,and oligonucleotides,but can also analyzesmaller moleculeslike benzodiazepines and sulfatedconjugates.Heated nitrogen drying gas Dielectric capillary entranceFigure 4. Electrospray ion sourceThe electrostatic field causes furtherdissociation of the analyte molecules.The heated drying gas causes the solventin the droplets to evaporate. As the dropletsshrink, the charge concentration in thedroplets increases. Eventually, the repulsiveforce between ions with like charges exceedsthe cohesive forces and ions are ejected(desorbed) into the gas phase. These ionsare attracted to and pass through a capillarysampling orifice into the mass analyzer.Evaporation -- - - - - 100,000 u / 10 z 1,000 m/zWhen a large molecule acquires many charges,a mathematical process called deconvolutionis often used to determine the actual molecularweight of the analyte.Analyte ion ejected - -- --- Large moleculesoften acquire more than one charge.Thanks to thismultiple charging,electrospray canbe used to analyzemolecules as largeas 150,000 u eventhough the mass range (or more accuratelymass-to-charge range) for a typical LC/MSinstruments is around 3000 m/z. For example:Figure 5. Desorption of ionsfrom solution - -- --- - - - - 7
Atmospheric pressurechemical ionizationIn APCI, the LC eluent is sprayed througha heated (typically 250 C – 400 C) vaporizerat atmospheric pressure. The heat vaporizesthe liquid. The resulting gas-phase solventmolecules are ionized by electrons dischargedfrom a corona needle. The solvent ions thentransfer charge to the analyte moleculesthrough chemical reactions (chemical ionization). The analyte ions pass through a capillarysampling orifice into the mass analyzer.APCI is applicable to a wide range of polarand nonpolar molecules. It rarely results inmultiple charging so it is typically used formolecules less than 1,500 u. Due to this,and because it involves high temperatures,APCI is less well-suited than electrosprayfor analysis of large biomolecules that maybe thermally unstable. APCI is used withnormal-phase chromatography more oftenthan electrospray is because the analytes areusually nonpolar.Figure 6. APCI ion sourceHPLC inletNebulizer (sprayer)Nebulizing gasVaporizer (heater)Drying gas Coronadischargeneedle8 Capillary
Atmospheric pressure photoionizationAtmospheric pressure photoionization (APPI)for LC/MS is a relatively new technique. Asin APCI, a vaporizer converts the LC eluent tothe gas phase. A discharge lamp generatesphotons in a narrow range of ionizationenergies. The range of energies is carefullychosen to ionize as many analyte moleculesas possible while minimizing the ionizationof solvent molecules. The resulting ions passthrough a capillary sampling orifice into themass analyzer.APPI is applicable to many of the samecompounds that are typically analyzed byAPCI. It shows particular promise in twoapplications, highly nonpolar compoundsand low flow rates ( 100 µl/min), where APCIsensitivity is sometimes reduced.In all cases, the nature of the analyte(s)and the separation conditions have a stronginfluence on which ionization technique:electrospray, APCI, or APPI, will generatethe best results. The most effective techniqueis not always easy to predict.Figure 7. APPI ion sourceHPLC inletNebulizer (sprayer)Nebulizing gasVaporizer (heater)UV lampDrying gashv Capillary9
through the filter at a given time. Quadrupolestend to be the simplest and least expensivemass analyzers.Mass AnalyzersAlthough in theory any type of mass analyzercould be used for LC/MS, four types: Quadrupole mass analyzers can operate intwo modes:QuadrupoleTime-of-flightIon trapFourier transform-ion cyclotron resonance(FT-ICR or FT-MS) Scanning (scan) mode Selected ion monitoring (SIM) modeIn scan mode, the mass analyzer monitors arange of mass-to-charge ratios. In SIM mode,the mass analyzer monitors only a few massto-charge ratios.are used most often. Each has advantages anddisadvantages depending on the requirementsof a particular analysis.SIM mode is significantly more sensitive thanscan mode but provides information aboutfewer ions. Scan mode is typically used forqualitative analyses or for quantitation whenall analyte masses are not known in advance.SIM mode is used for quantitation and monitoring of target compounds.QuadrupoleA quadrupole mass analyzer consists of fourparallel rods arranged in a square. The analyteions are directed down the center of thesquare. Voltages applied to the rods generateelectromagnetic fields. These fields determinewhich mass-to-charge ratio of ions can passFigure 8. Quadrupole mass analyzerTo detectorFrom ionsourceMass Range1 Scanm/zAbundanceScanm/ztime1 ScanAbundanceDiscrete Massesm/zSIMFigure 9. The quadrupole massanalyzer can scan over a rangeof mass-to-charge ratios oralternate between just a few10timem/z
Time-of-flighttravel faster and arrive at the detector first,so the mass-to-charge ratios of the ions aredetermined by their arrival times. Time-offlight mass analyzers have a wide massrange and can be very accurate in theirmass measurements.In a time-of-flight (TOF) mass analyzer, auniform electromagnetic force is applied toall ions at the same time, causing them toaccelerate down a flight tube. Lighter ionsIon trapFlight tube (field-free region)An ion trap mass analyzer consists ofa circular ring electrode plus two endcaps that together form a chamber. Ionsentering the chamber are “trapped” thereby electromagnetic fields. Another fieldcan be applied to selectively eject ionsfrom the trap. RepellerDetector AccumulationFrom ion sourceIon traps have the advantage of being ableto perform multiple stages of mass spectrometry without additional mass analyzers.Flight tube (field-free region)Repeller DetectorEjection Abundance EjectionAccumulationFigure 10. Time-of-flight mass analyzerAbundancem/zm/zFigure 11. Ion trap mass analyzer11
Fourier transform-ioncyclotron resonance (FT-ICR)An FT-ICR mass analyzer (also called FT-MS)is another type of trapping analyzer. Ionsentering a chamber are trapped in circularorbits by powerful electrical and magneticfields. When excited by a radio-frequency(RF) electrical field, the ions generate a timedependent current. This current is convertedby Fourier transform into orbital frequenciesof the ions which correspond to their mass-tocharge ratios.Like ion traps, FT-ICR mass analyzers canperform multiple stages of mass spectrometrywithout additional mass analyzers. They alsohave a wide mass range and excellent massresolution. They are, however, the most expensive of the mass analyzers.Figure 12. FT-ICR mass analyzer 12
279.1Collision-Induced Dissociationand Multiple-Stage MSCH3The atmospheric pressure ionizationtechniques discussed are allrelatively “soft” techniques. Theygenerate primarily:OO300000SNHNCH3250000Molecular ions M or M –Protonated molecules [M H] Simple adduct ions [M Na] Ions representing simple lossessuch as the loss of a water[M H – H2O] H2N20000015000050000100 200300m/zFigure 13. Mass spectrum ofsulfamethazine acquiredwithout collision-induceddissociation exhibitslittle fragmentationCH3m/z 186OO S186.0[M Na]0m/z 156124.1301.0280.0100000The resulting molecular weightinformation is very valuable, butcomplementary structural information is often needed. To obtainstructural information, analyte ions arefragmented by colliding them with neutralmolecules in a process known as collisioninduced dissociation (CID) or collisionallyactivated dissociation (CAD). Voltages areapplied to the analyte ions to add energy tothe collisions and create more fragmentation.80000 N281.0 [M H]350000NNHNCH3Figure 14. Mass spectrumof sulfamethazine acquiredwith collision-induceddissociation exhibits morefragmentation and thusmore structural information279.1m/z 108156.1m/z 213 H2Nm/z 124 323.0[M Na]280.1213.2187.0157.1125.120000107.1301.040000[M H]108.2600000100200300m/z13
CID in single-stage MSCID is most often associated with multistagemass spectrometers where it takes placebetween each stage of MS filtering, but CIDcan also be accomplished in single-stagequadrupole or time-of-flight mass spectrometers. In single-stage mass spectrometers,CID takes place in the ion source and is thussometimes called source CID or in-source CID.Analyte (precursor) ions are accelerated andcollide with residual neutral molecules to yieldfragments called product ions.The advantage of performing CID in singlestage instruments is their simplicity andrelatively low cost. The disadvantage is thatALL ions present are fragmented. There isno way to select a specific precursor ionso there is no sure way to determine whichproduct ions came from which precursor ion.The resulting spectra may include mass peaksfrom background ions or coeluting compoundsas well as those from the analyte of interest.This tradeoff may be acceptable when analyzing relatively pure samples, but does not givegood results if chromatographic peaks are notwell resolved or background levels are high.CID and multiple-stage MSMultiple-stage MS (also called tandem MS orMS/MS or MSn) is a powerful way to obtainstructural information. In triple-quadrupole orquadrupole/quadrupole/time-of-flight instruments (see Figure 16), the first quadrupole isused to select the precursor ion. CID takesplace in the second stage (quadrupole oroctopole), which is called the collision cell.Figure 15. In-sourceCID with a singlequadrupole ryAbundanceLC/MS/MSQ1Q2 (CID)Q3m/zFigure 16. MS/MS in a triple-quadrupole mass spectrometer14
A major advantage of multiple-stage MSis its ability to use the first stage of MS todiscard nonanalyte ions. Sample cleanupand chromatographic separation becomemuch less critical. With relatively puresamples, it is quite common to do awaywith chromatographic separation altogetherand infuse samples directly into the massspectrometer to obtain product mass spectrafor characterization or confirmation.The third stage (quadrupole or TOF) thengenerates a spectrum of the resultingproduct ions. It can also perform selectedion monitoring of only a few product ionswhen quantitating target compounds.In ion trap and FT-ICR mass spectrometers,all ions except the desired precursor ionare ejected from the trap. The precursorion is then energized and collided to generateproduct ions. The product ions can beejected to generate a massA.spectrum, or a particular production can be retained and collided toobtain another set of product ions.This process can be sequentially automated so that the most abundant ion(s) from each stageof MS are retained and collided.This is a very powerful techniquefor determining the structure ofAccumulationmolecules. It is also a powerfultechnique for obtaining peptideC.mass information that relates tothe sequence of amino acids ina peptide. B. Nonprecursor ions ejectedD. Product ions ejectedand detectedAbundanceCollisionFigure 17. MS/MS in an iontrap mass spectrometerm/z15
Adapting LC MethodsEarly LC/MS systems were limited by fundamental issues like the amount of LC eluent themass spectrometer could accept. Significantchanges to LC methods were often required toadapt them to MS detectors.Modern LC/MS systems are more versatile.Many mass spectrometers can accept flowrates of up to 2 ml/min. With minor modifications, the same instruments can also generategood results at microliter and nanoliter flowrates. Ion sources with orthogonal (off-axis)nebulizers are more tolerant of nonvolatilebuffers and require little or no adjustment,even with differing solvent compositions andflow rates.Changes to LC methods required for modernLC/MS systems generally involve changes insample preparation and solution chemistry to: Ensure adequate analyte concentration Maximize ionization through carefulselection of solvents and buffers Minimize the presence of compounds thatcompete for ionization or suppress signalthrough gas-phase reactionsFigure 18. Salt deposits in this AgilentAPCI ion source had little effect onperformance thanks to orthogonalspray orientation and robust ionsource design16
Sample preparationSample preparation generally consists ofconcentrating the analyte and removingcompounds that can cause background ionsor suppress ionization. Examples of samplepreparation include: On-column concentration to increaseanalyte concentration Desalting to reduce the sodium andpotassium adduct formation thatcommonly occurs in electrospray Filtration to separate a lowmolecular-weight drug from proteinsin plasma, milk, or tissueIonization chemistryBecause formation of analyte ionsin solution is essential to achievinggood electrospray results, carefulattention must be paid to propersolution chemistry. For electrospray: Select more volatile buffers toreduce the buildup of salts in theion source Adjust solvent pH according to thepolarity of ions desired and the pHof the sample Use solvents that have low heats of vaporization and low surface tensions to enhanceion desorption Make sure that gas-phase reactions donot neutralize ions through proton transferor ion pair reactionsIf pH adjustments interfere with properchromatography, postcolumn modificationof the solvent may be a good solution. Thiscan improve MS response without compromising chromatography. 13pH 2.5 12 14 11 15 10 9 12 11pH 6 10 13 9 14 8 15pH 12Figure 19. Effect of solvent pH on the abundance of multiply chargedions of the protein Lysozyme in electrospray mode17
Vaporizer temperature also affects APCIionization results. The temperature must behot enough to vaporize the solvent but notso hot as to cause thermal degradation of theanalyte molecules.Solution chemistry is less critical for APCIoperation because ionization occurs in thegas phase, not the liquid phase, but solventselection can still have a significant effect onAPCI analyte signal response. Select more volatile solvents Select solvents with a lower charge affinitythan the analyte Protic solvents generally work better thannonprotic solvents for positive ion mode For negative ionization, solvents that readilycapture an electron must be used Ammonium salts in the mobile phase cancause ammonium adduct formation200 C1234567 8569 101112 13 14 1516400 C1234789101112 13 14 15 16Figure 20. APCI analysis with an inadequate vaporizer temperature (200 C) yields poorresults for some compounds compared to a more typical vaporizer temperature (400 C)18
Capillary LC/MS and CE/MSCapillary electrophoresis (CE) is a techniquewith a high separation efficiency and theadded benefit of being able to handle verycomplex matrices. It has proven useful forsuch diverse samples as: peptides, drugs ofabuse, drugs in natural products, flavanoids,and aromatic amines.Capillary LC and capillary electrophoresis(CE) are commonly used alongside HPLC.Capillary LC at microliter to nanoliter flowrates often provides better sensitivity thanconventional flow rates for extremely smallsample quantities. It is commonly used forprotein and peptide analysis but has alsoproven very useful for the analysis of smallquantities of drugs.% Relative Abundance2.0With specialized nebulizers and methodadjustments, electrospray ionization can beused for both capillary LC/MS and CE/MS.The mass spectrometry benefits of selectivityand sensitivity are available to both of theseseparation techniques.Base Peak50 mM NaPO3Salbutamol5 µg/mLTerbutaline5 µg/mL1.5HOHOOHNH1.0HONHOHHO0.50.024681012Time (min)Figure 21. CE/MS/MS analysis of terbutaline and salbutamol shows good chromatographic separation and goodsignal even in the presence of a high concentration of sodium phosphate salt19
ApplicationsDifferentiation ofsimilar octapeptidesLC/MS is suitable for many applications, frompharmaceutical development to environmentalanalysis. Its ability to detect a wide rangeof compounds with great sensitivity and specificity has made it popular in a variety of fields.Figure 22 shows the spectra of two peptideswhose mass-to-charge ratios differ by only1 m/z. The only difference in the sequenceis at the C-terminus where one peptide hasthreonine and the other has threonine amide.The smaller fragments are identical in the twospectra, indicating that large portions of thetwo peptides are very similar. The larger fragments contain the differentiating peptides.One fundamental application of LC/MS isthe determination of molecular weights. Thisinformation is key to determining identity.100Figure 22. Mass spectradifferentiating two verysimilar octapeptides858.5Molecular Weight 0Ala-Ser-Thr-Thr-Thr-Asn-Tyr-Thr 00800m/z
Determining the molecular weightof green fluorescent proteinThe upper part of the display in Figure 23shows the full scan mass spectrum of GFP.The pattern of mass spectral peaks is characteristic of a multiply charged analyte. Eachpeak represents the molecule with a differentnumber of charges. The lower display is adeconvoluted mass spectrum generated bythe data system for the singly charged analyte.Green fluorescent protein (GFP) is a 27,000Dalton protein with 238 amino acids. It emitsa green light when excited by ultraviolet 89.95100000746.15767.55120000726.25Figure 23. Molecularweight determinationof green fluorescentprotein by electrospray LC/MS839.45895.45 866.45926.15959.15During electrospray ionization, GFP acquiresmultiple charges. This allows it to be analyzedby a mass spectrometer with a relativelylimited mass (mass-to-charge) range. Massdeconvolution is then used to determinethe molecular weight of the protein.15001000000800000Deconvoluted spectrumMW 26828.846000004000002000002670026800269002700021
MSn analysis in an ion trap mass spectrometerpermits multiple stages of precursor ionisolation and fragmentation. This stepwisefragmentation permits individual fragmentationpathways to be followed and provides a greatdeal of structural information.Structural DeterminationAnother fundamental application of LC/MSis the determination of information aboutmolecular structure. This can be in additionto molecular weight information or insteadof molecular weight information if the identityof the analyte is already known.Figure 24 shows the full scan mass spectrumfrom a direct infusion of the ginsenoside Rb1.The most prominent feature is the sodiumadduct ion [M Na] at m/z 1131.7. MS/MSof m/z 1131.7 yields a product ion at m/z 789.7corresponding to cleavage of a single glycosidic bond (Figure 25). Subsequent isolationand fragmentation of m/z 789.7 (Figure 26)yields two products: a more abundant ion atm/z 365.1 corresponding to loss of the oligosaccharide chain (–Glc 2 –Glc), and a lessabundant ion at m/z 627.5 representing theloss of a deoxyhexose sugar.Structural determination ofginsenosides using MSn analysisGinseng root, a traditional Chinese herbalremedy, contains more than a dozenbiologically active saponins called ginsenosides. Since most ginsenosides containmultiple oligosaccharide chains at differentpositions in the molecule, structural elucidationof these compounds can be quite complicated.1001131.7HOOHOOOOHOHOH% Relative Abundance80OHOOHOH[M Na] m/z 001200Figure 24. Full scan massspectrum of ginsenosideRb1 showing primarilysodium adduct ions
100HO789.7OOOHOHOHOOHOH% Relative Abundance80Figure 25. Full scanproduct ion (MS/MS)spectrum from the sodiumadduct at m/z 1131.7MS/MS of 1131.7OOHm/z 789.7OH [M Na]m/z 1131.760HOOOHHO40OHOOOm/z gure 26. Subsequentfull scan product ionspectrum (MS3) fromthe ion at m/z 789.7365.11131.7789.7100OH% Relative Abundance80Na m/z 627.5m/z 700800m/z23
Identification of bile acidmetabolitesPharmaceutical ApplicationsRapid chromatographyof benzodiazepinesThe information available in a mass spectrumallows some compounds to be separatedeven though they are chromatographicallyunresolved. In this example, a series of benzodiazepines was analyzed using both UV andMS detectors. The UV trace could not beused for quantitation, but the extracted ionchromatograms from the MS could be used.The MSn capabilities of the ion trap massspectrometer make it a powerful tool forthe structural analysis of complex mixtures.Intelligent, data-dependent acquisition techniques can increase ion trap effectivenessand productivity. They permit the identificationof minor metabolites at very low abundancesfrom a single analysis. One application isthe identification of metabolic products ofdrug candidates.The mass spectral information provides additional confirmation of identity. Chlorine has acharacteristic pattern because of the relativeabundance of the two most abundant isotopes.In Figure 27, the triazolam spectrum showsthat triazolam has two chlorines and thediazepam spectrum shows that diazepamhas only one.Figure 27. MS identificationand quantification ofindividual benzodiazepinesfrom an incompletelyresolved mixtureRapid chromatography and isotopic informationmAU2UV1.51343.10.5Triazolam0345.12 pamDiazepam150Alprazolam100Estrazolam287.21 ClLorazepam50oxazepam250Diazepam0124234min300350
This example uses the in vitro incubation ofthe bile acid deoxycholic acid with rat livermicrosomes to simulate metabolism of adrug candidate. Intelligent, data-dependentacquisition was used to select the two mostabundant, relevant ions in each MS scan.These precursor ions were automaticallyfragmented and full scan product ionspectra collected.corresponding to a predicted minor metabolite(cholic acid) that eluted at 9.41 minutes. Thefull scan MS/MS product spectrum (Figure 28C)from the ion at m/z 407 confirms the identity.Significant time was saved because theconfirming MS/MS product ion spectra wereacquired automatically in the same run as thefull scan MS data.Figure 28A shows the base peak chromatogram. Figure 28B shows the extracted ionchromatogram of the [M-H] – ion at m/z 40711.645Base Peak:m/z 150–500412.01MinorMetabolite3AFigure 28. Identification of a minormetabolite of deoxycholic acidthrough MS/MS12.2810.24213.490.7710246841012149.41Bm/z 40732102468289.5100OHMS/MS of 407at 9.41 ic Acid0100200300400500m/z25
In this example, a capillary LC and ion trapmass spectrometer were used to acquiredata from a mixture of five tryptically digestedproteins at a concentration of 1 pmol/µl each(Figure 29). Using intelligent, automated datadependent acquisition, a full scan production (MS/MS) spectrum was acquire from themost abundant relevant ion in each mass scanthroughout the entire run. All MS and MS/MSdata were acquire from a single analysis.Biochemical ApplicationsRapid protein identificationusing capillary LC/MS/MSand database searchingTraditional methods of protein identificationgenerally require the isolation of individualproteins by two-dimensional gel electrophoresis. The combination of capillaryLC/MS/MS with intelligent, data-dependentacquisition and probability-based databasesearching makes it possible to rapidly identifyas many as 100 proteins in a single 0.3714.434.4311.7520.5921.090.2Base Peak:m/z 150 –200022.350.051015202530Figure 29. Base peak chromatogram generated from 1 pmol total material injected on col
Basics of LC/MS . Contents Why Liquid Chromatography/Mass Spectrometry? 4 Instrumentation 6 Ion Sources 6 Electrospray ionization 7 . HPLC inlet Nebulizing gas hv Figure 7. APPI ion source. 10 Mass Analyzers Although in theory any type of mass analyzer could be used for LC/MS, four types: