Transcription
Thermodynamic PropertiesAugust 26, 2010OutlineUnit one – Properties of PureSubstances Extensive, E, m, intensive, T, P, , andspecific, e E/m, variables m/V 1/v density 1/(sp. vol.) Look at P-v-T data for real substances Ideal gases PV nRuT mRTLarry CarettoMechanical Engineering 370Thermodynamics– Engineering gas constant: R Ru / M– With v V/m, Pv RTAugust 26, 2010 Use of V or v V/m gives difference betweenPV mRT and Pv RT2Thermodynamic VariablesThermodynamic System Extensive variables (volume, mass,energy) depend on size of system Intensive variables (pressure,temperature, density) do not Specific variables are ratio of anextensive variable to mass (e.g. specificvolume, v V/m) General notation, if E is an extensivevariable, e E/m is specific variable Basic unit of analysis defined by boundarieswhere all interactions occur State of system defined by properties Interaction of system with surroundings– Can interchange energy and mass– Open/closed systems: Have/Do not have massaddition or removal Open system called control volume– Isolated system: constant energy and mass– All interactions across boundaries34Thermodynamic StateIdeal Gas Equations Two independent intensive propertiesdetermine the state of a simplecompressible system Once the state of a system is determined all other properties are known Thermodynamic processes are acontinuous series of states known as aquasi-equilibrium process From chemistry: PV nRuT Ru Universal gas constant 8.314kJ/kmol·K 8.314 kPa · m3/kmol·K 10.73 psia ·ft3/lbmol ·K Engineering gas constant, R Ru/M Definition of mol, n m / M PV nR Tu PV (m/M)(MR)T mRTPV mRT P(V/m) Pv RTPv RT5ME 370 – Thermodynamics61
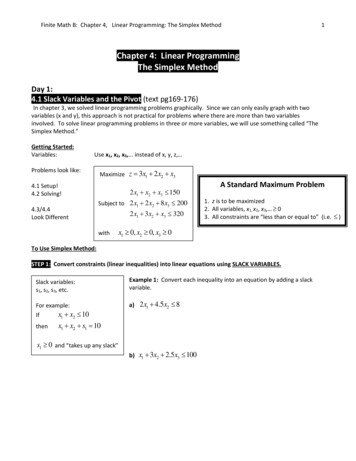
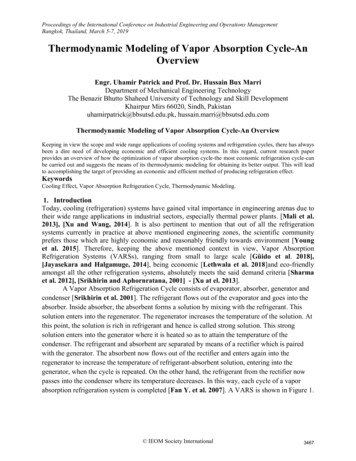
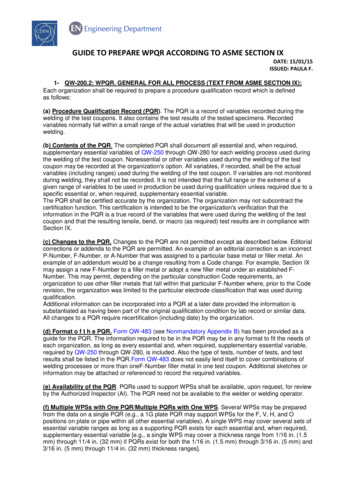
Thermodynamic PropertiesAugust 26, 2010Z 1 is ideal gasTR T/TcritWhy Use Ideal Gas?Figure 3-51 from Çengel,Thermodynamics An EngineerApproach, 2008PR P/Pcrit Simple equations Real gas behavior close to ideal gas forlow pressure (or high temperature) Want P low compared to Pc Example calculation: find specificvolume of water at 1,000oC and 10 kPa Compare to property table value of v 58.758 m3/kg for water (page 918)7Finding R8Ideal Gas Calculation Table A-1, page 908: for water, R 0.4615 kJ/kg·K 0.4615 kPa·m3/kg·K1kJ 1 kN·m 1 (kN/m2)·m3 1 KPa·m30.4615 kPa m 3(1273.15 K )58.756 m 3RTkg K v 10 kPaPkg Error is only 0.0017% at this point Ideal gas often used for “permanentgases” such as air9Ideal Gas Calculation IIP-v-T for Real Substances Three phases: gas, liquid and solid Look at gas and liquid Thought experiment A volume of 20 ft3 at a pressure of300 psia contains 20 lbm of Helium;what is the temperature? T PV / (mR) R 2.6809 psia ft3/lbm R (page 958)T PV mR 300 psia 20ft 3 2.6809 psia ft 3(20 lbm )lbm R– Add heat to a liquid at constant pressure;measure T and v– After a while vapor starts to form 111.9 R 347.7 o F Heat addition increases volume by convertingliquid to gas while T is constant (at constant P)– Finally have only gas that expands readily Ideal gas has v/T const (at constant P)11ME 370 – Thermodynamics10122
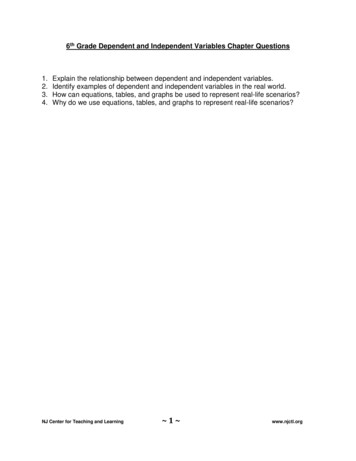
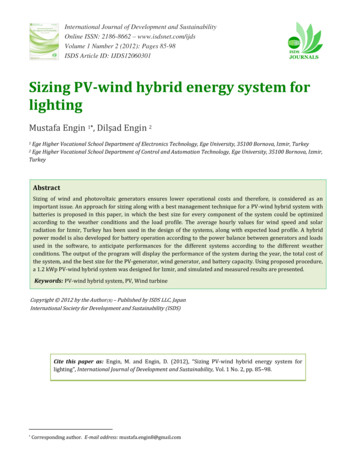
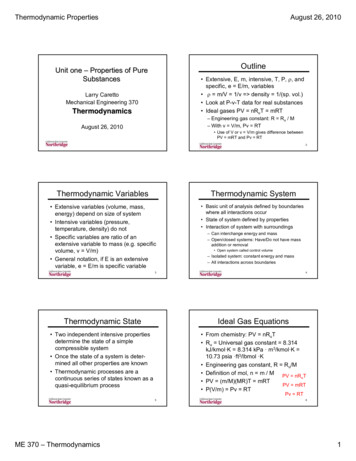
Thermodynamic PropertiesAugust 26, 2010Thought Experiment IIThought Experiment III Repeat experiment with difference invariables Hold temperature constant Add heat and measure pressure, P, andspecific volume v Have same liquid-vapor transition States 2 to 4 are liquid vapor transition– P is constant if T is constant– Liquid and vapor properties constant intransition only relative proportions change– Liquid and vapor have same properties (P,vf 1/ f, vg 1/ g, and T) during transition;only relative proportions changeFigures 3-6 to 3-10 from Çengel, Thermodynamics AnEngineering Approach, 20081314P-v Diagram for WaterThought Experiment Results1.E 08 A constant temperature line on P-vT 50 C1.E 07Pressure (Pascals)– Looks like a hyperbola in the gas region– Has constant pressure during the transitionfrom liquid to gas– Is nearly vertical in the liquid region The points where the transition betweenliquid and gas take place for differenttemperatures: saturation curve Results of “experiment” on next slideT 100 CT 200 C1.E 06T 300 CTcrit1.E 05GasLiquidT 500 CT 1000CSat1.E 04Mixed1.E 030.0001 0.001150.010.11101001000Specific Volume (cubic meters per kilogram)Critical P-v Diagram for WaterSuperheat P-v Diagram for Water1.E 0850,00045,000T 200 CT 300 C1.E 07TcritT 500 CT 1000CPressure (Pascals)Pressure (Pascals)Sat40,000Sat35,000T 50 C30,000T 100 CT 200 C25,000T 300 C20,000Tcrit15,000T 500 C10,000T 1000C5,0001.E 060.0010.010.1Specific Volume (cubic meters per kilogram)10050100150200Specific Volume (cubic meters per kilogram)ME 370 – Thermodynamics3
Thermodynamic PropertiesAugust 26, 2010What We Have to DoFinding Properties Find all intensive thermodynamicproperties when we are given only twointensive properties When we have a mixture of liquid andgas T and P are not independent For a single phase (liquid or gas) T andP are independent (can specify state) In the mixed region we use vapor massfraction, called quality, xmgv vfv v f v and v are foundfg x from either T or Pmg m f v g v fv fg– Two independent, intensive propertiesdefine state Here we will discuss only four intensiveproperties, P, v, T, and fraction of vaporin mixed region called the quality, x Approach used here will be applied tofinding other properties: internal energy,enthalpy, and entropy1920Saturation PropertiesQuality Derived Mixed region volume is sum of liquidand vapor volumes mfmgm mgV mg vg vf vg vfm mmmmPV mg v g m f v f Use quality: x mg/(mg mf) mg/mv SatT Tsat(P)P Psat(T)Saturated liquid (f) andsaturated vapor (g)properties can be foundif P or T are knownm mgV mg vg v f xvg (1 x)v f v f x v g v f m mmUse quality,x, in mixedregion Will apply this later to other propertiesvfvx vgv vfvg v fv v f x v g v f 2122Saturation Tables See steam tables, pp 914–923 Saturation tables– Table A-4 has T as lookup variable– Table A-5 has P as lookup variable– Same results in each table Other variables besides specific volumehave saturated liquid (f) and gas (g) Example: what are P and v if T 220oCand x 0.25?23ME 370 – Thermodynamics Use Table A-4, Page 915, T 220oC Find P 2319.6 kPa, vf 0.001190m3/kg and vg 0.086094 m3/kg244
Thermodynamic PropertiesAugust 26, 2010What is v for x 0.25?What if P and T are Given? Found from Table A-4 with lookup T If these are independent properties thenthey define a state The “superheat” (gas) tables for water(Table A-6, pp 918 – 921) have a set oftables for P with rows of data for v Data are also given for other properties Basic question: Given T and P, how dowe know if we have a liquid or a gas?– P Psat(T 220oC) 2319.6 kPa– vf(T 220oC) 0.001190 m3/kg– vg(T 220oC) 0.086094 m3/kgx v vfvg v f v v f x(vg v f ) (1 x)v f xvgv (1 x)v f xvg (1 0.25)0.001190 m30.086094 m3 (0.25)kgkgv 0.022416 m 3kg2526Finding State with Given T and PSatT T1 T2T T2 T1Psat(T1)Psat(T2)PLiquid whenT Tsat(P) orP Psat(T)Gas whenT Tsat(P) orP Psat(T)vf27vvg28General Rules When we are given T and P we have asingle phase. Is it gas or liquid?– It is a gas if T Tsat(P) or P Psat(T)– It is a liquid if T Tsat(P) or P Psat(T)– “Superheat” tables have Tsat by P– Can guess superheat and check Example: R134a at 0oC and P 100 kPa, 400 kPa Guess superheat and find at 100 kPa and 0oC, v 0.21630 m3/kg; at 400 kPa there is no 0oC entry Data from page 92929ME 370 – Thermodynamics305
Thermodynamic PropertiesAugust 26, 2010ResultsGeneral Rules Continued v(0oC, 100 kPa) 0.21630 m3/kg What is v(0oC, 100 kPa)? Page 929 The example did not find a 0oC entry at400 kPa because this is a liquid– The header 0.4 MPa (Tsat 8.91oC confirmsthat T 0oC Tsat 8.91oC Approximation for compressed liquid:v(T,P) vf(T) Note it’s vf(T) Why are there no data at T 400 MPa ( 0.4 MPa)?0oCand P– To get answer for 400 kPa and 0oC look atsaturation table for T 0oC, A-11, page 926– v(0oC,400 kPa) vf(0oC) 0.0007723 m3/kg31Two More ProblemsReview Last Problem What is the specific volume for refrigerant134a (R-134a) when the pressure is 90psia and the temperature is 240oF– R-134a tables in english units: pp. 976-979– Guess that this is gas and look in“superheated” tables on page 979– v 0.77796 ft3/lbm at given T and P What is P when T 0.77796 ft3/lbm?240oFand v 90 psiaSatT Tsat(P)P Psat(T)vf34Given T-v(or P-v); Find P(or T) Determine state: find vf and vg fromsaturation tables for given T (or P)vg35ME 370 – Thermodynamics Use general rule that gas occurs when P Psat(T) or T Tsat(P) For this problem T 240oF Tsat(90 psia) 72.83oF Also P 90 psia Psat(240oF) 138.79 psia For liquid to use v vf(T) we must begiven v-P: find T for which vf(T) vgiven Compressed liquid tables for waterGasv– R-134a tables in english units: pp. 978-81– What if we could not guess that this is gas ormade a wrong guess?– If v vg it is a gas; use superheat table– If v vf it is a liquid; see below– If vf v vg it is in mixed region. Can find xPFind vf and vg from T or PLiquid if v vfGas if v vgOtherwise mixedMixed What is the specific volume for refrigerant134a (R-134a) when the pressure is 90psia and the temperature is 240oF33Find State Given v and (T or P)Liquid32366
Thermodynamic PropertiesAugust 26, 2010InterpolationInterpolation II Can use interpolation function on yourcalculator if you have one Basic idea is that you have a table withdata pairs (x1, y1) and (x2, y2) You want to find a value of y for somevalue of x between x1 and x2 Simplest idea is to assume a straightline between x1 and x2y2Interpolated yyy1xInterpolation IIIxWant y for this xy2 y1 y y1 x2 x1 x x1y y1 y2 y1 x x1 x2 x138Example Problem Equation for a straight line betweendata pairs (x1, y1) and (x2, y2) isy2 y1 x x1 orx2 x1x2x137y y1 For a straightline any twopoints on the linecan give slopey For H2O at P 2 MPa, what is T whenv(m3/kg) (a) 0.00115, (b) 0.01, (c)0.2? Table A-5, p 917 At 2000 kPa, vf 0.001177 m3/kg, vg 0.099587 m3/kgy y1 y2 y1 x x1 x2 x1– Thus (a) is liquid, (b) is mixed, (c) is gas Second form is easier to remember For compressed liquid state (a), correctT is one for which vf(T) 0.00115 m3/kg– It says that the slope between any point(x,y) and the point (x1, y1) is the same asthe slope between (x1, y1) and (x2, y2)– Extract from Table A-4, next slide, showsthat this vf is between T 195oC and T 200oC First form used for computations39Data and InterpolationExample: (b) Mixed, (c) Gas (b) for mixed region, T Tsat(2 Mpa) 212.38oC; can find quality We want to find T for v 0.00115 m3/kg– Between 195oC and200oCv vf For this interpolation x1 0.001149 m3/kg, x2 0.001157 m3/kg, y1 195oC and y2 200oC200 o C 195o C .00115 m 3 .001149 m 3 195.6o CT 195 C 33kgkg .001149 m.001157 mkgkgo41ME 370 – Thermodynamics40.01 m3kg x v g v f .099587 m3 .001177 mkg3kg .001177 m 0.0896 8.96%3kg (c) v .2 m3/kg at P 2 MPa found on p.921 between T 600oC and 700oCT 600 o C 700o C 600 o C .2 m3 .19962 m3 601.6o C33kgkg .19962 m.22326 mkgkg427
Thermodynamic PropertiesAugust 26, 2010Compressed Liquid TableMore on Compressed Liquid Not a common table, use here to checkapproximation that v(P,T) vf(T) Table A-7, page 922, gives v(50 MPa,100oC) 0.0010201 m3/kg Table A-4, page 914, gives vf(100oC) 0.001043 m3/kg Error is about 2% even for a pressuredifference of 49.9 MPa between theactual pressure and saturation pressure Check approximation that v(P,T) vf(T)for previous problem: v 0.00115 m3/kgand P 2 MPa Do not have data for compressed liquidat 2 MPa in table on page 9224344– First entry is at 5 MPa Have to use double interpolation andinterpolation with saturation points– Interpolate between Psat and 5 MPaInterpolationsTable2 MPa We are looking for v 0.00115 m3/kgwhich is between 180oC and 200oC incompressed liquid table at 5 MPa We have to find data at thesetemperatures and 2 MPaCompressed liquid datashown hereLooking for v 0.00115m3/kg at P 2 MPaNo data for P 5 M PaUse saturated liquid datafor lower pressureAt 180oC, vf 0.001127m3/kg at P 1.0021 MPaAt 200oC, vf 0.001157m3/kg at P 1.5538 MPaInterpolate to get v at 2MPa at 180oC, 200oC46– Because 5 MPa is the first table entry weuse saturation as the lower data pointvt(T) v(T, Psat)v(T , 2 MPa) v f (T ) v(T ,5 MPa) v f (T )5 MPa Psat (T ) 2 MPa Psat (T ) 45Interpolations IIInterpolations III Apply formula for T 180oC and 200oC3v(180 C , 2 MPa) .001127 mo3.001125 mkg 3 .001127 mkgkg 2 MPa 1.0021 MPa .001126501 m5 MPa 1.0021 MPakg3v( 200 C , 2 MPa) .001157 mo3kg Now interpolate between results for twodifferent T’s to find T at desired v3 347ME 370 – Thermodynamics200o C 180o C.00115648 m 3 .001126501 m3 kgkg .00115 m3 .001126501 m 3 195.7 o C kgkg .001157 m3kgkg 2 MPa 1.5538 MPa .00115648 mkg5 MPa 1.5538 MPa.001153 mT 180o C Previous result using v(T,P) vf(T) was195.6oC488
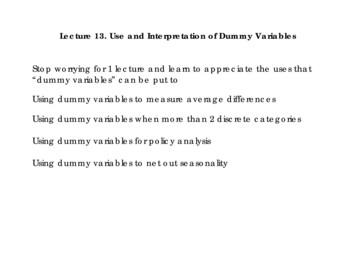
Sat Liquid Mixed Gas Critical P-v Diagram for Water 1.E 06 1.E 07 1.E 08 0.001 0.01 0.1 1 Specific Volume (cubic meters per kilogram) Pressure (Pascals) Sat T 200 C T 300 C Tcrit T 500 C T 1000 C Superheat P-v Diagram for Water 0 5,000 10,000 15,000 20,000 25,000 30,000 35,000 40,000 45,000 50,000 0 50 100 150 200 Specific Volume (cubic .