Transcription
Fourth Quarter and Full Year 2020 Financial ResultsEcho Global Logistics, Inc.February 3, 2021
Forward-Looking StatementsAll statements made in this presentation, other than statements of historical fact, are or may be deemed tobe forward-looking statements. These statements are forward-looking statements under the federal securitieslaws. We can give no assurance that any future results discussed in these statements will be achieved.These statements are based on current plans and expectations of Echo Global Logistics and involve risks,uncertainties and other factors that may cause our actual results, performance or achievements to bedifferent from any future results, performance or achievements expressed or implied by these statements.Information concerning these risks, uncertainties and other factors is contained under the headings "RiskFactors" and "Forward-Looking Statements" and elsewhere in our Annual Report on Form 10-K for the yearended December 31, 2019; our Quarterly Reports on Form 10-Q for the quarters ended March 31, 2020,June 30, 2020, and September 30, 2020; and other filings with the Securities and Exchange Commission(the "SEC").22
2020 Financial ReviewThree Months EndedDecember 31,dollars in millions except per share data%Change41.9 %Year EndedDecember 31,20202019 2,511.5 2,185.0%Change14.9 %Revenue20202019 754.3 531.7Adjusted gross profit (1) 114.8 89.728.0 % 393.2 386.01.9 %Net incomeEBITDA (2)Adjusted EBITDA (2) 11.0 25.3 27.3 1.414.617.5664.2 %72.9 %55.5 % 15.8 68.0 78.9 14.872.984.16.7 %(6.7)%(6.2)%Fully diluted EPSNon-GAAP fully diluted EPS (2) 0.41 0.56 0.050.26664.5 %114.4 % 0.60 1.33 0.551.458.5 %(8.2)%(unaudited)(1)Adjusted gross profit (formerly "net revenue") is a non-GAAP financial measure calculated as revenue less transportation costs.For a reconciliation of this non-GAAP financial measure to the nearest comparable GAAP financial measure, please refer to theAppendix included in this presentation.(2)For a description and reconciliation of these non-GAAP financial measures to the nearest comparable GAAP financial measures,please refer to the Appendix included in this presentation.Key Takeaways The increase in fourth quarter 2020 revenue was primarily the result of an increase in revenue pershipment as well as an increase in volume for both truckload ("TL") and less than truckload ("LTL"). The increase in fourth quarter 2020 Adjusted EBITDA was the result of record adjusted gross profit.33
Revenue by Modedollars in millions(unaudited)Truckload ("TL") revenue Less Than Truckload ("LTL") revenueOther revenueRevenue Three Months Ended December 31,2020549.4 184.420.5754.3 2019Year Ended December 31,% Change352.1159.020.5531.756.0 %16.0 %(0.2)%41.9 % 202020191,757.5 659.494.72,511.5 1,437.6646.6100.82,185.0% Change22.3 %2.0 %(6.1)%14.9 %Note: Amounts may not foot due to rounding.Key Takeaways Fourth quarter 2020 TL (includes Partial TL) revenue increase was driven by a 30.5% increase in revenueper shipment and a 19.6% increase in volume. Fourth quarter 2020 LTL revenue increase was driven by a 12.8% increase in volume and a 2.8% increasein revenue per shipment.44
Revenue by Client Typedollars in millionsThree Months Ended December 31,20202019% Change(unaudited)Transactional revenue Managed Transportation revenueRevenue 577.7 411.240.5 %176.6120.546.6 %754.3 531.741.9 %Year Ended December 31,20202019% Change 1,936.7 574.8 2,511.5 1,684.914.9 %500.114.9 %2,185.014.9 %Note: Amounts may not foot due to rounding.Key Takeaways Fourth quarter 2020 Transactional revenue increase was driven primarily by increases in both TL(includes Partial TL) and LTL revenue per shipment of 32.0% and 6.1%, respectively, and a 15.7%increase in TL volume. Fourth quarter 2020 Managed Transportation revenue increase was driven primarily by a 19.8%increase in TL (includes Partial TL) revenue per shipment and increases in both TL and LTL volumeof 49.5% and 21.8%, respectively.55
Adjusted Gross Profit & Revenue Analysisdollars in millions(unaudited)Adjusted gross profit(1)Adjusted gross profit margin(1)Three Months Ended December 31,Year Ended December 31,20202019Change20202019Change 114.8 89.728.0 % 393.2 386.01.9 %15.2 %16.9 %(165) bps15.7 %17.7 %(201) bpsTL revenue mix72.8 %66.2 %657bps70.0 %65.8 %418bpsLTL revenue mix29.9 %3.9 %(551)(106)bpsbps26.3 %3.8 %29.6 %4.6 %(334)(84)bpsOther revenue mix24.4 %2.8 %Transactional revenue mix76.6 %77.3 %(75)bps77.1 %77.1 %—bpsManaged Transportation revenue mix23.4 %22.7 %75bps22.9 %22.9 %—bpsbps(1)Adjusted gross profit (formerly "net revenue") is a non-GAAP financial measure calculated as revenue less transportation costs.For a reconciliation of this non-GAAP financial measure to the nearest comparable GAAP financial measure, please refer to theAppendix included in this presentation.Key Takeaways The fourth quarter 2020 decrease in adjusted gross profit margin resulted from lower TL and LTL margins,as well as a shift in mode mix towards TL. The fourth quarter 2020 increase in TL revenue mix was driven by an increase in both TL revenue pershipment and volume.66
Expense Summarydollars in millionsThree Months Ended December 31,2020(unaudited)2019Year Ended December 31,Change20202019ChangeRevenue 754.3 531.741.9 % 2,511.5 2,185.0Adjusted gross profit (1) 114.8 89.728.0 % 393.2 386.01.9 %Commission expense 34.6 26.829.0 % 118.2 117.01.1 %Percent of adjusted gross profitChange in contingent consideration30.1 % Percent of adjusted gross profitStock compensation expense(0.1)2.1 52.9Percent of adjusted gross profit46.1 %Selling, general and administrative expense 89.5Percent of adjusted gross profit78.0 %Percent of adjusted gross profitDepreciation 2.7 0.8Percent of adjusted gross profitNon-GAAP tax rate2.4 45.3 75.1—(67)(85)(442) 6.7(2.7)%7.5 %(180) 2.8(3.8)% 1.3 1.63.1 %(78)1.4 %(72)— %1.8 %27.5 %(176)11.4 196.1 325.2 10.2 184.9 313.12.6 %47.9 %82.7 % 27.581.1 % 7.0 % 11.0 4.3 1.7bps26.66.9 % 11.8 5.3 7.32.8 %bps1.10.3 %49.9 %bpsbps 2.9 %bps(100.0)%25.6 % bps(37.7)%(0.4)30.3 %(0.1) %bps19.3 %(571)30.1 %bps16.8 %83.7 %0.7 % bps(11.9)%50.5 % 22(124.1)%2.7 %2.3 %Percent of adjusted gross profitNon-cash interest expense 5.7 %Percent of adjusted gross profitCash interest expense6.60.50.6 %1.9 %Percent of adjusted gross profitAmortization (0.1) % Other selling, general and administrative29.9 %3.1 %1.1 %1.4 %0.4 %1.9 %25.2 %25.4 %14.9 %(24)bps(142.6)%(39)bps11.5 %25bps6.0 %197bps3.9 %159bps3.5 te: Amounts may not foot due to rounding.(1)For a description and reconciliation of this non-GAAP financial measure to the nearest comparable GAAP financial measure, please refer to the Appendix includedin this presentation.Key Takeaways Fourth quarter 2020 commission expense increased due to higher adjusted gross profit. Other selling, general and administrative expense for the fourth quarter 2020 increased due to increasesin non-sales headcount and incentive compensation.77
Cash Flow and Balance Sheet DataSelected Cash Flow DataThree Months Ended December 31,20202019% Change(unaudited)dollars in millionsCash generated from operations (34.9)%10.4 16.0Capital expenditures27.1 %(6.4)(5.1)(1)Free cash flow 4.0 10.9(63.7)%Year Ended December 31,20202019% Change(unaudited)(24.6)% 63.8 84.5(9.8)%(21.6)(23.9) 42.2 60.6(30.4)%(1)For a description of this non-GAAP financial measure to the nearest comparable GAAP financial measure, please refer to theAppendix of this presentation.Selected Balance Sheet DataAs of December 31,20202019(unaudited)dollars in millionsCash and cash equivalents 41.3 34.6Accounts receivable, net of allowance for doubtful accounts439.4287.0Current assets493.5336.2Current liabilities377.1230.4Long-term debt, net133.9——156.3399.4 383.3Convertible notes, net of unamortized discount/issuance costsStockholders' equity Key Takeaways During the fourth quarter 2020, the decrease in free cash flow is a result of lower cash generated fromworking capital and higher capital expenditures. The increase in accounts receivable and current liabilities is a result of higher volume and revenue inQ4 2020.88
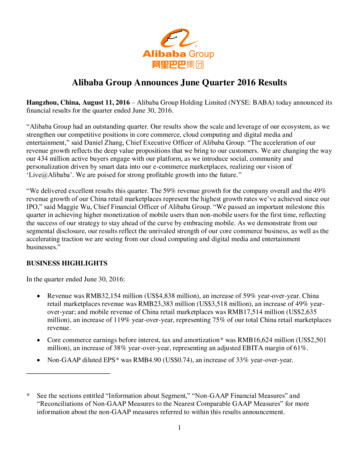
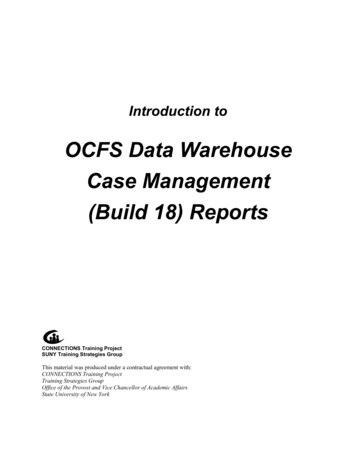
Liquidity SummaryKey Takeaways Liquidity Metrics at December 31, 2020Available Liquidity - December 31, 2020400371.2329.9(135.0)371.2Cash Balance: 41.3MOutstanding ABL Balance: 135M300236.2Excess ABL Availability: 194.9MTotal Available Liquidity: 236.2M200 Summary of ABL Credit Facility (1) Maximum loan amount: 350M10041.3 Collateral: 85% advance rate on eligible AR AR availability at December 31, 2020: 329.9M0Cash Balance Interest Rate: LIBOR 150 bps or LIBOR 125bps if borrowing less than 50% of availabilityABLAvailabilityABL DebtBalanceTotal Liquidity Maturity date: October 23, 2023Net balance of 194.9M representsthe total excess ABL availability. Fixed Charge Coverage Ratio of at least 1.0(1)For a copy of the full credit agreement, please reference: al-information/sec-filings99
GuidanceQ1 2021 Revenue:Commission:G&A Costs:Depreciation:Cash Interest:Share Count:Non-GAAP Tax Rate:FY 2021 690M - 730M29.75% - 30.25% 52.5M - 55.5M 6.9M 0.9M26.8M24.5% - 25.5%Excluded for Non-GAAP: Amortization:Stock Compensation: Revenue:Commission:G&A Costs:Depreciation:Cash Interest:Share Count:Non-GAAP Tax Rate:Capital Expenditures:Excluded for Non-GAAP: 2.7M 5.0M Amortization:Stock Compensation:First Quarter 2021 Trends(1) January per business day revenue up 37%January per business day TL shipments up 15%January adjusted gross profit margin approximately 15.9%(1) 2.725B - 2.925B29.75% - 30.25% 220M - 230M 28.5M 3.5M26.9M24.5% - 25.5% 25M - 27MJanuary trends are representative of the first 20 business days in the month.1010 10.5M 12.3M
Appendix:Non-GAAP Financial MeasuresThis presentation includes the following financial measures defined as "Non-GAAP financial measures" by the SEC:Adjusted gross profit (formerly "net revenue"), adjusted gross profit margin (formerly "net revenue margin"), EBITDA,Adjusted EBITDA, Non-GAAP fully diluted EPS and Free cash flow. Adjusted gross profit is calculated as revenue lesstransportation costs (excludes internal use software depreciation). Adjusted gross profit margin is calculated as adjustedgross profit (as previously defined) divided by revenue. EBITDA is defined as net income excluding the effects ofdepreciation, amortization, cash and non-cash interest expense and income taxes. Adjusted EBITDA is defined as EBITDA(as previously defined) excluding changes in contingent consideration and stock compensation expense. Non-GAAP fullydiluted EPS is defined as fully diluted EPS excluding changes in contingent consideration, amortization, non-cash interestexpense, stock compensation expense and the tax effect of these adjustments. Free cash flow is defined as net cashprovided by operating activities reduced by capital expenditures. A reconciliation of Adjusted gross profit, EBITDA,Adjusted EBITDA and Non-GAAP fully diluted EPS to the most comparable GAAP measure is included on the next slide. Areconciliation of Free cash flow to the most comparable GAAP measure is included on Slide 8. We believe such measuresprovide useful information to investors because they provide information about the financial performance of the Company'songoing business.Adjusted gross profit, adjusted gross profit margin, EBITDA, Adjusted EBITDA, Non-GAAP fully diluted EPS and Free cashflow are used by management in its financial and operational decision-making and evaluation of overall operatingperformance. These measures may be different from similar measures used by other companies. The presentation of thisfinancial information, which is not prepared under any comprehensive set of accounting rules or principles, is not intendedto be considered in isolation or as a substitute for the financial information prepared and presented in accordance withgenerally accepted accounting principles. Please refer to Slide 8 and the slides that follow this slide for a reconciliation ofeach non-GAAP financial measure to the nearest comparable GAAP financial measure.1111
AppendixReconciliation of Non-GAAP Financial MeasuresThree Months Ended December 31,20202019% changedollars in millions except per share data(unaudited)Revenue 754.3 531.741.9 %2,511.5 2,185.014.9 %639.5442.044.7 %2,118.31,798.917.8 %4.44.7(4.8)%19.117.96.7 %110.4 85.029.8 %368.11.6 %4.44.7(4.8)%17.96.7 % 114.8 89.728.0 % 386.01.9 % 11.0 Transportation costsInternal use software depreciationGross profit Add: Internal use software depreciationAdjusted gross profit(1)Net incomeYear Ended December 31,20202019% change 374.1 19.1393.2 1.4664.2 %15.8 14.86.7 %Depreciation6.66.7(2.7)%27.526.63.5 0)%1.77.3(76.7)%0.81.3(37.7)%4.35.3(19.2)%Non-cash interest expenseCash interest expenseIncome tax expenseEBITDA (1)4.2 Change in contingent considerationStock compensation expense0.8437.5 %14.672.9 %(0.1)0.5(124.1)%2.12.4(11.9)%17.555.5 % 78.9 25.3 Adjusted EBITDA (1) 27.3 Fully diluted EPS 0.41 0.05664.5 %—0.02(124.1)%0.100.11Change in contingent considerationAmortizationNon-cash interest expenseStock compensation expenseTax effect of adjustmentsNon-GAAP fully diluted EPS (1) 7.7 7.09.2 %72.9(6.7)%(0.4)1.1(142.6)%11.410.211.5 %84.1(6.2)%68.0 0.558.5 %(0.02)0.60 .0)%0.060.270.080.09(11.9)%0.430.3813.5 %(0.03)(0.07)(52.9)%(0.16)(0.23)(30.3)%0.26114.4 %1.45(8.2)%0.56 1.33 Note: Amounts may not foot due to rounding.(1)For a description of these non-GAAP financial measures, please refer to the first page of the Appendix to this presentation.1212
Historical Financial Performancedollars in millions, except per share data(unaudited)Q1 2019 Q2 2019 Q3 2019 Q4 2019 FY 2019 Q1 2020 Q2 2020 Q3 2020 Q4 2020 FY 2020Transactional revenue 412.1 428.2 433.3 411.2 1,684.9 428.4 396.8 533.9 577.7 1,936.7Managed transportation 426.7591.0639.52,118.3118.2Transportation costs(1)(excludes internal use software depreciation)Commission expense30.031.129.126.8117.027.226.629.834.6Change in contingent )Stock compensation expense2.82.42.52.410.24.62.32.32.111.4Other selling, general and 9196.1Selling, general and administrative ation3.23.02.82.811.82.82.82.72.711.0Depreciation and amortization9.59.89.69.538.49.89.89.79.238.5Income from operations9.110.79.75.134.50.52.810.316.029.5Cash interest expense1.41.31.31.35.31.31.21.00.84.3Non-cash interest expense2.02.21.61.67.31.50.2——1.7Interest expense, net3.43.62.82.812.62.81.41.00.86.0Income before provision for income (2.0)(0.8)(7.0)(0.6)(0.4)(2.4)(4.2)7.7Income tax expenseNet incomeFully diluted earnings per shareDiluted shares(2) 3.5 5.1 4.8 1.4 14.8 (2.9) 1.0 6.8 11.0 15.8 0.13 0.19 0.18 0.05 0.55 (0.11) 0.04 0.26 0.41 0.6027.526.826.526.626.826.226.526.626.426.0Note: Amounts may not foot due to rounding.(1)Transportation costs exclude internal use software depreciation of 4.1 million in Q1 2019, 4.5 million in Q2 2019, 4.6 million in Q3 2019, 4.7 million in Q4 2019, 17.9 million in FY 2019, 4.7 million in Q1 2020, 5.0 million in Q2 2020, 5.0 million in Q3 2020, 4.4 million in Q4 2020, and 19.1 million in FY 2020. Internal usesoftware depreciation is included in depreciation expense.(2)For the three months ended March 31, 2020, 181,830 incremental shares related to stock-based awards were not included in the computation of diluted loss percommon share because of the net loss during the period. Diluted shares used in the reconciliation of non-GAAP fully diluted EPS was 26,188,474.1313
(includes Partial TL) and LTL revenue per shipment of 32.0% and 6.1%, respectively, and a 15.7% increase in TL volume. Fourth quarter 2020 Managed Transportation revenue increase was driven primarily by a 19.8% increase in TL (includes Partial TL) revenue per shipment and increases in both TL and LTL volume of 49.5% and 21.8%, respectively.