Transcription
DesignWhat you need to know beforedesigning a panelFor Research Use Only. Not for use in diagnostic or therapeutic procedures.Alexa Fluor is a registered trademark of Life Technologies Corporation.Cy is a trademark of GE Healthcare. Cy dyes are subject to proprietary rights ofGE Healthcare and Carnegie Mellon University and are made and sold under licensefrom GE Healthcare only for research and in vitro diagnostic use. Any other use requiresa commercial sublicense from GE Healthcare, 800 Centennial Avenue, Piscataway,NJ 08855-1327, USA.Trademarks are the property of their respective owners. 2016BD, the BDLogo andall otherTheBDBD.HorizonGlobalTour 1 trademarks are property of Becton, Dickinsonand Company.
Elements of multicolor flow cytometryConsiderations in designing panels:Fluorochromecharacteristics andavailabilityThe BD Horizon Global Tour 2Biologycell type, antigencharacteristicsInstrumentQC and setup;spillover
FluorochromesExpanding the range of choices to revealbiological contextThe BD Horizon Global Tour 3
Fluorochromes reveal biologyPE-CF594BV421Alexa Fluor 647PerCP-Cy 5.5Alexa Fluor 700V450FITCCD3PECD197 (CCR7) The proper choice of fluorochrome helps us understand moreabout the biology of the experiment. Bright dyes are important when looking at dim antigens.The BD Horizon Global Tour 4
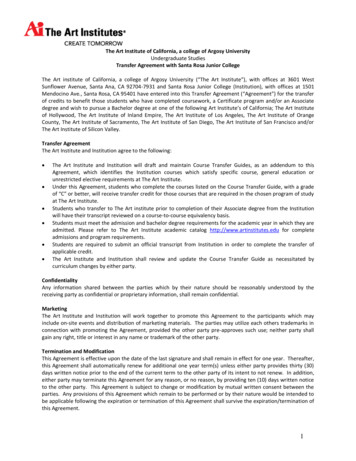
380 CD markers25 Intracellular proteins20––––CytokinesCell signalingTranscription factorsPhosphoproteins The availability offluorochromeshas driven major advancesin flow cytometry.1510Number of colorsEvolution of fluorochromes5SirigenpolymersQdots ear1980CD Nomenclature 2015: Human Leukocyte Differentiation Antigen Workshops as a Driving Force inImmunology. Engel P, Boumsell L, Balderas R, et al. J Immunol. 2015 Nov 15;195(10):4555-4563.The BD Horizon Global Tour 520002020
Sirigen polymer technology– High-sensitivity fluorescenceh h h h h Direct reporters -conjugated polymersTandem reportersIntense dye emission Bright fluorescent materials Large collective opticalresponse Efficient energy donors Amplified dye emission Reproducible syntheticframework
BD Horizon Brilliant Violet dyes Seven dyes excited bythe violet laser– Base polymers: BV421,BV510 and BV480new– Tandems: BV605, BV650,BV711 and BV786BV421The BD Horizon Global Tour 7BV480BV510 Bright dyes Limited cross laserexcitation Compatible with surfaceand intracellular targetsBV605BV650BV711BV786
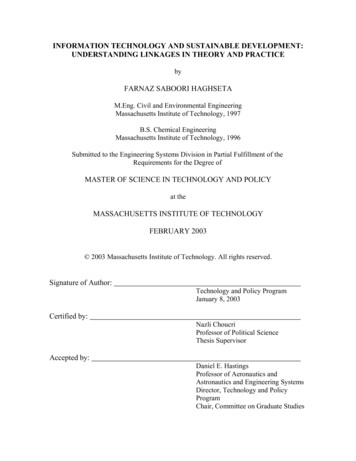
CD4 resolution comparisonStain indexFITC: 61PE: 211BV421:703BV510:125BV605: 118BV650: 284BV711: 315BV786: 333The BD Horizon Global Tour 8
BD Horizon Brilliant Ultraviolet dyes Six fluorochromes excited Designed for reducedby the 355-nm UV laserspillover into violetchannels– Base polymer: BUV395– Tandems: BUV496, Bring phenotyping to theBUV563, BUV661, BUV737,UV-laser lineBUV805BUV395The BD Horizon Global Tour 9BUV496BUV563BUV661BUV737BUV805
CD4 resolution comparisonStain indexFITC: 61PE:211BUV395: 63BUV737: 196BUV496: 59BUV805: 44The BD Horizon Global Tour 10BUV661: 321
Many fluorochrome choicesEmissionUltraviolet(355 nm)VioletLaser(405 nm)Blue(488 nm)Yellow/Green(561 nm)Red(640 605BV650BV711BV786PEPE-CF594PE-Cy 5PerCPPE-Cy y7BV480BV510V500BB515FITCAlexa Fluor 488APCAlexa Fluor 647PerCP-Cy5.5Alexa Fluor 700Choice of fluorochromes depends on the available instrument configurationand the total number of markers being used in an experiment.
Understand instrument configuration The fluorochrome choice must becompatible with the instrumentbeing used. Reconfiguration might benecessary to take full advantageof the BD Horizon Brilliant Violetand Ultraviolet portfolio. Reconfiguration allows forexpansion of the instruments’capability.The BD Horizon Global Tour 12
Choose fluorochromes based on configurationBD FACSVerseBD FACSVerseBD LSRFortessaBD LSRFortessaBD FACSCanto IIBD FACSCanto IIBD LSRFortessa X-20BD LSRFortessa C-Cy7APCAPC-H7/APC-Cy7BD Accuri C6Blue(488 nm)Red(640 nm)VioletBV421/V450BV510/V500(405 reen(561 nm)Ultra-violet(355 nm)# Lasers# ColorsBB515/FITCPerCP-Cy5.524The BD Horizon Global Tour V661BUV737BUV805418518
BD FACSCelesta configurations Enabling new bright fluorochrome choices for assay design
Fluorochrome resolution rankingFluorochromeVery brightUltraviolet(355 nm)ModerateDimBD Horizon BUV661BD Horizon BUV737BD Horizon BUV563BD Horizon BUV395BD Horizon BUV496BD Horizon BUV805VioletBD Horizon BV421BD Horizon BV650BD Horizon BV711BD Horizon BV480BD Horizon BV605BD Horizon BV786BD Horizon BV510BD Horizon V450BD Horizon V500BlueBD Horizon BB515BD Horizon PE-CF594PE-Cy5PEPE-Cy7FITCAlexa Fluor 488PerCP-Cy5.5PerCP(405 nm)LaserBright(488 nm)Yellow/Green(561 nm)Red(640 nm)PEBD Horizon PE-CF594PE-Cy5PE-Cy7APCAlexa Fluor 647BD Horizon APC-R700Alexa Fluor 700APC-H7APC-Cy7 Rankings were determined by comparing the resolution of LWB cells stained onseveral clones run on a variety of flow cytometers. Many factors can influence the relative fluorochrome/reagent performance on agiven instrument, including laser power, PMT voltage, optical filters, antibodyclone, biological sample and staining methodology.
Know your biologyAntigen density and co-expressioninfluence panel designThe BD Horizon Global Tour 16
Elements of multicolor flow cytometryConsiderations in designing panels:Fluorochromecharacteristics andavailabilityThe BD Horizon Global Tour 17Biologycell type, antigencharacteristicsInstrumentQC and setup;spillover
Classification of antigensLeucocyte antigens can be categorized based upon theirpatterns of expression: Primary: Well characterized, easily classified aspositive or negative, typically define broad subsetsor lineages– Examples: CD3, CD4, CD19 Secondary: Well characterized, typically expressedat a higher density, often over a continuumCD4CD45RA– Examples: CD27, CD28, CD45RA, CD45RO Tertiary: Expressed at low levels, variable uponactivation unknown, critical– Examples: CD25, STAT5, FoxP3Mahnke YD, Roederer M. Optimizing a multicolor immunophenotyping assay. Clin Lab Med. 2007;27:469-485.CD25
Grouping antigen density: T-cells When evaluating antigen density, it can be useful togroup antigens based on their relative levels ofexpression.Average number of molecules on T cells100,000High 15,000Low 1,000Relative 01,000400100BD LSRFortessa BD FACSVerse Sample19
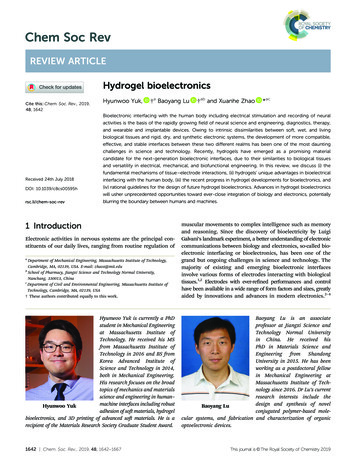
Different subpopulations can express thesame antigen at different densitiesCD45RACD3 CD8 T cellsCCR7CD45RO Antigen density should be evaluated at the level of the subpopulations ofinterest.– Example: for all T-cells, CD45RO has an average density of 15,000. Expression on individual subpopulations can vary 300-fold. For novel populations, you might need to do test analyses to assessantigen density on your specific population.–Densities can be expressed as ratios of the median fluorescence intensity (MFI) ofa known antigen vs the test antigen using the same fluorochrome.
BD antigen expression projectProviding the scientific communityinformation on antigen density andco-expressionThe BD Horizon Global Tour 21
Antigen density project Antigen density analyses were performed on blood cellsfrom 12 individuals, covering a range of ages andgenders (3 male/3 female each from young/old groups). Each antigen of interest was measured using aPE-conjugated antibody.Antibodies in panelPanel 1(B/T)CD3, CD4, CD8,CD25, CD127,CD45RA, CCR7,CD19, IgD, CD27CD61, CD45, CD3,CD19, CD14, CD16,Panel 2CD56,(non‐B/T)HLA-DR CD123,CD11cThe BD Horizon Global Tour 22Cell populations identified Naïve, EM, CM and TEMRApopulations(defined by CD45RA andCCR7) from CD8 and Th cellsubsets CD45RA Tregs CD45RA Tregs PlateletsNeutrophilsBasophilsEosinophilsMonocytes (subsets based onCD14 and CD16) Naïve B-cells Non-class-switchedmemory B-cells Class-switched memoryB-cells CD56dimCD16 NK-cellsCD56bright NK-cellsNKT-cells (CD3 CD56 )mDCspDCs
Antigen density: B-cell and T-cell panelFluorochromeThe BD Horizon Global Tour 23MarkerBD Horizon V450CD45RABD Horizon V500CD3FITCCD4 IgDPerCP-Cy 5.5CD19PEDrop-inPE-Cy 5CD25PE-Cy 7CD127Alexa Fluor 647CCR7Alexa Fluor 700CD27APC-H7CD8
Antigen density: B-cell and T-cell panelLymphocytesB-cellsSSCCCR7The BD Horizon Global Tour 24CD8CD45RACD3FITCCD4 IgDPerCP-Cy 5.5CD19CD19CD25Th cellsPE-Cy 7CD127Alexa Fluor 647CCR7Alexa Fluor 700CD45RACD4IgDDrop-inPE-Cy 5CD8 T-cellsAPC-H7CD25CD27BD Horizon V500PECD4 T-cellsCD127BD Horizon V450MarkerCCR7CD3FSCFluorochromeCD3 lymphocytesCD27TregsCCR7SingletsCD8CD45RACD45RA
Antigen density: B-cell and T-cell panelTh cellsCD45RACD45RACD45ROPEFMOPEIgDAPE (FMO or CD45RO)The BD Horizon Global Tour 25TregsCCR7CCR7CCR7CD8 T-cellsCD27B-cellsCD45RACD45RA
Summary: antigen density study0100 400 cell surface markers analyzed% Positive Complements the information provided by the BD BiosciencesHuman CD Marker Chart (additional specificities from othervendors to increase specificities to 350). Provides information on antigen expression in commonlymphocyte cell subpopulations. Enables optimal panel design by guiding the selection ofantigen-fluorochrome combinations.
Antigen expressionDefining the biology of your assayThe BD Horizon Global Tour 27
Antigen expression Conjugated antibodies used to define specific celltypes should be selected with spectrally distinctfluorochrome labels. Basic concept of panel design:– “for low expressed antigens use brightest availablefluorochrome”. What does this mean for the possible markers for aT-cell panel?– CD3, CD4, CD8, CD45RA, CD27, CCR7, CD25, CD127The BD Horizon Global Tour 28
Defining the biology of your assay Define a populationtree based on thegoals of the assay. Identify the criticalpopulations. Determine whichantigens areco-expressed andat what levels.CD3 CD4 CD25 CD127 AgCD3CD4CD8CD45RACD127CD25CCR7TregsCD45RA CCR7 CD8 CD45RACCR7-CD4 naïve CD4 memoryT cellsT cellsCD45RA CCR7 CD45RACCR7-CD8 naïveT cellsCD8 memoryT cells
Review antigen expression levels Assign antigenexpression levels foreach subpopulationusing data from:– Antigen density study– Technical Data Sheet(TDS)– Literature– ColleaguesCD3 CD4 CD25 CD127 CD45RA CCR7 CD8 CD45RACCR7-CD45RA CCR7 CD45RACCR7-CD8 naïveT-cellsCD8 memoryT-cellsXX– Pre-testingAgTregsCD4 naïve CD4 memoryT-cellsT-cellsCD3CD4CD8Hi expressionXXCD45RAMed expressionLo expressionNo applicable inpanelXCD127CD25XCCR7XXXX
Antigen/fluorochrome combinationsLowHighMediumFluorochromeVery BrightUltraviolet(355 nm)BD Horizon BV421BD Horizon BV650(405 nm)BD Horizon BV711BD Horizon BB515BD Horizon PEBlueCF594(488 nm)PE-Cy5PEBD Horizon PEYellow/GreenCF594(561 nm)PE-Cy5PE-Cy7LaserVioletRed(640 nm)BrightModerateDimBD Horizon BUV661BD Horizon BUV737BD Horizon BUV563BD Horizon BUV395BD Horizon BUV496BD HorizonBUV805BD Horizon BV480BD Horizon BV605BD Horizon BV786BD Horizon BV510BD Horizon V450BD Horizon V500PEPE-Cy7FITCAlexa Fluor 488PerCP-Cy5.5PerCPAPCAlexa Fluor 647BD Horizon APC-R700Alexa Fluor 700APC-H7APC-Cy7
Elements of multicolor flow cytometryConsiderations in designing panels:Fluorochromecharacteristics andavailabilityThe BD Horizon Global Tour 32Biologycell type, antigencharacteristicsInstrumentQC and setup;spillover
InstrumentSetting up your instrument to maximizeresolution and consistencyThe BD Horizon Global Tour 33
Resolution vs background Resolution: The degree to which a flow cytometer candistinguish dimly stained cells from unstained cells. This can be challenging in a polychromatic scenario.“Negative” DimNegative population has lowbackground; populations wellresolved.Negative population has highbackground; populations notresolved.Negative population has lowbackground but high rSD(spread); populations notresolved.BrightThe abilityto resolvepopulationsis a functionof bothbackgroundand spreadof thenegativepopulation.
Fluorescence spilloverThe BD Horizon Global Tour 35
Factors impacting resolutionThe BD Horizon Global Tour 36
Why do we care about fluorescencespillover? Resolution of populations in multicolor panels– Fluorescence spillover is an important factor in creating apanel design with good resolution of populations ofinterest. Visualization of multicolor data– Incorrect or poor calculation of spillover values (SOVs)negatively impacts the quality of data obtained from anassay.The BD Horizon Global Tour 37
Fluorescence spillover introduces background andspread into other detectorsPE-Cy7rSDFluorochromes spill over into otherdetectors; for example, PerCP-Cy5.5spills into the PE-Cy7 detector.This fluorescence spillover contributes to:This “background” is subtracted in theprocess called compensation. Increased background (MFI) Spread (measured as y5.5rSD3,098 291
Fluorescence spillover introduces background andspread into other detectorsPE-Cy7PE-Cy7rSDFluorochromes spill over into otherdetectors; for example, PerCP-Cy5.5spills into the PE-Cy7 detector.This fluorescence spillover contributes to:This “background” is subtracted in theprocess called compensation. Increased background (MFI) Spread (measures as ,098 2913PerCP-Cy5.5PerCP-Cy5.5289A sample is correctly compensated when, inthe spillover detector (PE-Cy7), the MFI ofthe positive population is equivalent to thatof the negative population.However, the spread introduced by thespillover is not removed by thecompensation and reduces the resolution(SI) of any double-positive cells.
What are some sources of spillover?AdjacentdetectorsResidual basefluorescenceSimilaremission spectra(cross-laser)The BD Horizon Global Tour 40FITC and PEBV786 and BV421BUV737 and BV711
A guide to spilloverBD Biosciences fluorochromesUltraviolet(355 nm)Violet(405 nm)Blue(488 nm)Yellow/Green(561 nm) 380 480BUV395BUV496BV421V450 530 575 610 660 685 (640 nm)APCAPC-R700 740 780BUV737BUV805BV786PE-Cy7PE-Cy7APC-H7APC-Cy7 Fluorochromes with similar emission spectra will have the greatestpotential for cross-laser spillovers. Residual spillover between tandems and their base Spillover into adjacent detectors
A guide to spilloverBD Biosciences fluorochromesUltraviolet(355 nm)Violet(405 nm)Blue(488 nm)Yellow/Green(561 nm) 380 480BUV395BUV496BV421V450 530 575 610 660 685 (640 nm)APCAPC-R700 740 780BUV737BUV805BV786PE-Cy7PE-Cy7APC-H7APC-Cy7 Fluorochromes with similar emission spectra will have the greatestpotential for cross-laser spillovers. Residual spillover between tandems and their base Spillover into adjacent detectors
ConclusionConsiderations in designing panels:Fluorochromecharacteristics andavailabilityThe BD Horizon Global Tour 43Biology:cell type, antigencharacteristicsInstrumentQC and setup;spillover
BD Accuri C6 BD FACSVerse BD FACSCanto II BD FACSVerse BD FACSCanto II BD LSRFortessa BD LSRFortessaX-20 BD LSRFortessa BD LSRFortessa X-20 Blue (488 nm) BB515/FITC PE PerCP-Cy5.5 BB515/FITC PE PerCP-Cy5.5 PE-Cy7 BB515/FITC PE PerCP-Cy5.5 PE-Cy7 BB515/FITC PE PE-CF594 PerCP-Cy5.5 PE-Cy7 BB515/FITC PerCP-Cy5.5 Red (640 nm) APC APC APC-H7/APC-Cy7 .