Transcription
Transportation Research Part A 59 (2014) 222–238Contents lists available at ScienceDirectTransportation Research Part Ajournal homepage: www.elsevier.com/locate/traLogistics agglomeration in the USLiliana Rivera a, , Yossi Sheffi a, Roy Welsch babCenter for Transportation and Logistics, Massachusetts Institute of Technology, USASloan School of Management, Massachusetts Institute of Technology, USAa r t i c l ei n f oArticle history:Received 15 September 2012Received in revised form 18 August 2013Accepted 13 November 2013Keywords:LogisticsSupply chainAgglomerationClusterConcentrationa b s t r a c tGovernments around the world are investing significant resources in the development oflogistics clusters. This paper develops a methodology for identifying them and applies itto answer several lingering questions in the context of the US. It contributes to a more general debate in the general industrial clusters literature: while many authors see industrialclusters growing, others see them dispersing. To answer this and related questions in thecontext of logistics clusters the paper first analyzes the prevalence of such clusters usinga two-index methodology to identify clusters in the US. Evidence of increasing concentration of the logistics industry in clusters in the US over time is tested and documented. Inaddition, some evidence that logistics activities in counties inside clusters show highergrowth than counties outside clusters is found.Ó 2013 Elsevier Ltd. All rights reserved.1. IntroductionGovernments around the world are investing significant resources in the development of new and the expansion of existing logistics clusters, all of whom are central nodes of the global freight transportation network. They are motivated, in largeparts by a job creation agenda. For instance the Government of Aragón in Spain invested over 680 Million to develop Plataforma Logística – Zaragoza (PLAZA), the largest logistics park in Europe and the core of the Aragon logistics cluster. Panama isin the process of developing significant logistics clusters at both ends of the canal as part of the strategy to position the country as the center for trade and logistics for the Americas (Council of the Americas, 2011; Government of Panama, 2010).While new logistics hubs are being developed, existing clusters are expanding in scale and scope. These include major onessuch as Singapore, Rotterdam, Duisburg (Germany), Dubai, Santos (Brazil), and multiple US locations such as New York, Miami, Chicago, Dallas/Ft Worth, Memphis, Louisville and Los Angeles.Logistics can be broadly defined as the group of functions associated with production, design, and marketing, which include ‘‘. . .transportation, warehousing and facilities planning, and location’’ (Kasilingman, 1998). These activities add valueto companies’ supply chain and increase competitiveness.The logistical need to move material, parts, and products into manufacturing, distribution and retail locations creates the(derived) demand for freight transportation. To this end, efficient transportation operations are crucial for efficient logisticssince transportation costs are a relevant part of the retail price (Xu and Hancock, 2004). Also, the pressure to time-compresslogistical operations and provide high level of service gives transportation a central role in logistics (Groothedde, 2005; Stankand Goldsby, 2000). Furthermore, as stated by Rodrigue and Hesse (2006) ‘‘. . .the role of transportation is considered more thana mere support to the mobility of freight within global commodity chains, but an integral part of the value generation process.’’Dozens of interviews all around the world suggest that logistics clusters are growing. This finding is in line with the manyauthors who document and explain the advantage of industry agglomeration, or clustering. They cite tacit knowledge ex Corresponding author. Address: Center for Transportation and Logistics, Massachusetts Institute of Technology, 1 Amherst Street, E40-222, Cambridge,MA 02142, USA. Tel.: 1 617 253 5316.E-mail addresses: MLRivera@mit.edu (L. Rivera), Sheffi@mit.edu (Y. Sheffi), RWelsch@mit.edu (R. Welsch).0965-8564/ - see front matter Ó 2013 Elsevier Ltd. All rights 09
L. Rivera et al. / Transportation Research Part A 59 (2014) 222–238223change, the development of a local supply base, and the availability of a specialized labor pool (Marshall, 1890; Feser, 2008;Ellison et al., 2010). Other authors point out that the regions where these clusters reside enjoy high economic growth and ahigher rate of innovation and capital formation than regions that do not include clusters (Porter 2000, 2003; Delgado et al.,2010; Benneworth and Henry, 2004). Other researchers, however, claim that negative externalities of clusters, the development of information technologies and the efficiency of global supply chains diminish the advantages of geographical proximity, leading to dispersion of like-businesses (Cairncross, 1997; Polenske 2001, 2003; Henderson and Shalizi, 2001). Also,Feitelson and Salomon (2000) point out to the increasing congestion in transportation networks that could lead to dispersionof logistics activities.Although large investments in logistics clusters seem to suggest that policy makers believe in their positive effects, andthough there are some studies that account for their benefits (see for instance Kasarda, 2008; De Langen, 2002, 2004a; Wuet al., 2006), the prevalence of logistics clusters has not been studied yet. This article defines logistics clusters, explains theiradvantages and tests this prevalence. It then uses a two-factor metric to identify logistics clusters in the US, validating theresults through several approaches. Using data from 1998 and 2008 it provides evidence that logistics activities seem to be,in fact, agglomerating rather than dispersing over time.Section 2 reviews the state of the art in clusters research, with an emphasis on logistics, and provides some context for theanalysis. Section 3 presents findings from exploratory research used to develop the thesis of the paper. Section 4 reviews themethodologies used to identify clusters, while Section 5 depicts the model and the data used in analysis of the US. Sections 6and 7 present the results, including a statistical analysis. Finally Section 8 concludes with final observations.2. Industrial and logistics clustersThe literature concerning industrial clusters dates back to Marshall (1890), who discusses agglomeration economies andenumerates the externalities-based advantages for firms to co-locate. Economists distinguish among several types ofagglomerations. Marshall (1890), and Weber and Friedrich (1929) discussed external economies of scale, resulting from multiple firms agglomerating geographically, as opposed to internal economics of scale, where a single firm expands its production (see, for example Isard and Schooler, 1959). Hoover (1937) defined two types of external economies of scale:urbanization and localization. Urbanization economies arise when many firms from different industries concentrate inthe same region; localization economies arise when firms from a particular sector locate in the same region. This paper isfocused on external economies of scale and localization economies of logistics firms and operations.Porter (1998) summarized the main benefits of industrial clustering as follows: ‘‘A cluster allows each member to benefitas if it had greater scale or as if it had joined with others formally, without requiring it to sacrifice its flexibility.’’ A relatedbranch of literature argues that clustered firms enjoy not only the benefits of agglomeration economies (Feser, 2008; Ellisonet al., 2010), but also higher collective learning and tacit knowledge exchange (Keeble and Wilkinson, 2000; Maskell, 2001;Cohen and Fields, 1999; Leamer and Storper, 2001). Intra-cluster competition drives firms to succeed by increasing their productivity, supercharging innovation, and by stimulating new business formation (Porter, 2000; Delgado et al., 2010). Thisalso results is high economic growth (Baptista, 1998), reinforcing the importance of geographical concentration and supporting a continuing clustering trend.However, several authors argued that the efficiency of supply chains, and advanced communications technologies represent the ‘‘end of geography’’ (O’Brien, 1992) and the ‘‘death of distance’’ (Cairncross, 1997). Others point to the negativeexternalities of clusters such as congestion and higher prices of land and labor, creating incentives for firms to leave clusters(Henderson and Shalizi, 2001; Glasmeier and Kibler, 1996; Teubal et al., 1991), as a result of ‘‘Dispersion Economies’’ (Polenske, 2003).This paper explores the role of clusters in logistics and transportation. A logistics cluster is defined as the geographicalconcentration of firms providing logistics services, such as third-party-logistics (3PL-s), transportation carriers, warehousingproviders and forwarders. Naturally, logistics clusters also include suppliers for such activities, such as packaging manufacturers and transportation maintenance depots.The academic literature includes only a few articles about logistics clusters with little mention of their prevalence. Vanden Heuvel et al. (2011)studied the logistics industry within three Provinces in the Netherlands, concluding that the concentration of relative and absolute employment in logistics firms there has increased in recent years.The emergence of a logistics cluster depends on the quality of transportation service available in a region (Hong, 2007).Bok (2009) highlighted accessibility and general infrastructure quality as the main factors affecting the location preference offirms. Better accessibility typically drives logistics operations to locate relatively close to each other (Berechman, 1994), as itreduces costs for firms (Rietveld, 1994). Hong (2007) asserted that transportation accessibility is one of the important determinants of location decisions of foreign logistics firms.Most of the literature related to logistics clusters is specific to ports or airports and not to the logistics sector in general.Haezendonck (2001), Klink and De Langen (2001) and De Langen (2002, 2004a, 2004b) investigated maritime clusters, arguing that, based on their findings, the concentration of maritime activities in clusters is likely to increase. This is not surprisingas one considers the, more familiar, increased concentration of airlines in ‘‘hub fortresses.’’ The economics of hubs for maritime and air freight are similar.Martin and Román (2003) document the agglomeration of airfreight carriers in hub airports while Lindsay and Kasadra(2011) developed the concept of ‘‘Aerotropolis’’ – a full urban development around an airport. Interestingly, despite the
224L. Rivera et al. / Transportation Research Part A 59 (2014) 222–238attraction of airport and port clusters some observations suggest that their growth is sometimes constrained by lack of landand environmental regulations. The focus of this paper, in any case, is on logistics clusters in general, many of which are notfocused on either a port or an airport.Finally, Wu et al. (2006) argue that China’s economic advantage goes beyond labor costs, and can be explained, in largemeasure, by the presence of ‘‘supply clusters.’’ These clusters provide all the logistics services needed for the management ofglobal supply chains. They add: ‘‘the large number of supply clusters formed in China in recent years has contributed significantly to the nation’s manufacturing competitiveness.’’3. Exploratory researchDuring 2010 and 2011 the authors conducted 135 interviews as part of an exploratory research with actors in and aroundlogistics clusters, resulting in three main findings relevant to the work reported in this paper. First, these interviews suggestthat logistics companies are clustering and those clusters are growing. Second, Governments play a key and necessary role inlogistics clusters’ development. And third, logistics clusters attract transportation carriers who build their networks aroundsuch clusters.A description of the methodology of data collection through interviews and the analysis of this qualitative data is beyondthe scope of this paper and is the subject of an upcoming paper. In summary, the first stage was exploratory and consequently open interviews were used to collect data. In the second stage more data was gathered through semi structuredinterviews to confirm the initial findings (Babbie, 2009). The interviews were conducted in existing logistics clusters in Singapore, the Netherlands (Amsterdam and Rotterdam), Germany (Duisburg and Frankfurt), Spain (Zaragoza), Panama (Panama City and Colon), Dubai, Brazil (Campinas and Santos – both in the State of Sao Paulo), Cartagena (Colombia), and theUS (New York, Miami, Chicago, Dallas/Ft Worth, Memphis, Louisville and Los Angeles). The data was analyzed usinggrounded theory tools (Glaser and Strauss, 1967; Glaser, 1978), and following Charmaz (2006). The process included codingand clustering analysis to organize the data, as well as an evolving revision of the categories and results.The interview data suggest a consensus on the advantages of logistics clusters for companies and regional economies. Asmany researchers point out, lower cost may not be the only reason why a firm selects a particular location (see, for example,Castells 1996; DiPasquale and Wheaton 1996; Porter 2001; Polenske 2003). Just as important, if not more, are high-level oftransportation services.Sheffi (2010) summarizes the transportation cost and service advantages of logistics clusters, including economies ofscope, scale, and density; better service, and liquidity. Economies of scope arise due to the presence of many shippers, helping the balance of movements in and out of the cluster, minimizing equipment idle time and empty repositioning moves.Economies of scale result in from lower costs while the concentration of logistics operations in the cluster produce higherfreight volumes, allowing carriers to use larger conveyances and enjoy higher utilization. Economies of density arise becausethe larger the number of companies in the cluster, the more efficient pickup and delivery operations get. Better level of service result from the higher freight volume leading to higher frequency of services as well as more direct services in and out ofthe logistics cluster. Finally, liquidity or price stability is the result of many shippers located in the same geography, servedby many transportation carriers, thus minimizing situations of short-term mismatch between demand and equipmentavailability.These advantages create a positive feedback loop rooted mainly in the economics of transportation: as more firms join thecluster, transportation costs go down and service improves, which in turn attracts more firms to the cluster, further reducingcosts and improving transportation services.In addition, the interviews suggest that companies in logistics clusters share equipment, lease space to each other forshort-term surges and lulls in activity; and work effectively together when a logistics contract is moved from one providerto another. Cluster companies also have more weight in lobbying the local government, which in the case of logistics clustersthe focus is typically on improved infrastructure and regulatory relief.While many authors studying other industrial clusters (mainly high technology ones) argue that the role of governmentin their development and growth is minimal (OECD, 2001; Wadhwa, 2010), government is a major player in logistics clusters. This is due not only to the significant transportation infrastructure requirements of such clusters, but also due to theneed for a favorable regulatory, tax, and trade policy environment. The interviews suggest that government interest in logistics clusters is, not surprisingly, primarily driven by the potential benefits for the local economy with an emphasis on jobs.Interestingly, they are also viewed – mainly in the US – as a vehicle for ‘‘economic justice’’ based on ‘‘professional mobility’’:providing starting jobs that pay better than the hotel or the agricultural industries to employees without high level education, and allowing them to be promoted from within as this industry values ‘‘on the floor experience’’ in its executives.The interview data suggest that the major investments that are going into new and existing logistics clusters will go on,and that these clusters are growing (not dispersing); this is the basic hypothesis explored statistically in this paper.4. Identifying logistics clustersBefore tackling the question whether US logistics operations are clustering or dispersing, one needs to identify the location of concentrations of logistics activities. Even by itself such identification can be of value; it can help firms identify sites
L. Rivera et al. / Transportation Research Part A 59 (2014) 222–238225to set up distribution activities. Governments using this information can identify competing regions which can then be usedto benchmark effective policies (infrastructure, regulation, and administrative efficiency, among others) for success of logistics clusters.Several of the most common indices employed to measure industry geographical concentration include the Location Quotient (LQ), Horizontal Clustering Location Quotient (HCLQ), Locational Gini Coefficient (LGC), Herfindahl–Hirschman Index(HHI), and the Ellison–Glaeser Index (EGGCI). Appendix A contains the formal definition of these indices.Location Quotient (LQ) has widely been used in economic geography and regional economics since the 1940s (Miller et al.,1991). In fact, it was used by De Langen (2004a) in his analysis of maritime clusters. This technique has remained popular inlarge part because it requires relatively little data (Isserman, 1977). LQ is the ratio of employment share of the industry ofinterest in the area of interest and the employment share of that industry in a reference area (which is typically the country).Some of the studies that have used this technique include Paige and Nenide (2008) in their analysis of the agglomerationtrends in the Central San Joaquin Valley in California; Braunerhjelm and Carlsson (1999) who set to identify cluster activityand its evolution in Ohio and Sweden; Held (1996), who addressed the question about the State’s participation in generatingeconomic development through a cluster approach in the Hudson Valley of New York; and others (Zook, 2000; Malmbergand Maskell, 2002).A value of the LQ greater than one suggests a higher than average share of employment in an industry of interest in agiven area. Although this index provides information about the relative weight of a particular industry’s employment in ageographical area (relative to a reference area), it does not provide information regarding the absolute size of the industry(Feser et al., 2002).To correct this issue, Fingleton et al. (2004) proposed the Horizontal Cluster Location Quotient (HCLQ), which weighs LQvalues with an indicator of magnitude, such as the local area share of nationwide jobs in a given industry. It thus takes intoaccount both the relative and absolute local importance of the industry under study. HCLQ is the number of jobs in the localindustry that exceeds the number that would produce LQ 1 (Ratanawaraha and Polenske, 2007). An example is found inEcheverri-Carroll and Ayala (2010). They analyze wage differentials caused by the agglomeration of high-tech companiesin certain cities of the United States. Using the HCLQ they suggest that clustering is the key factor behind innovation flows,knowledge spillovers and other cooperative linkages among firms.Two additional measures of industry clusters include the Locational Gini Coefficient (LCG) and the Herfindahl–HirschmanIndex (HHI). The former was proposed by Krugman (1991) to examine regional income disparities, based on the Gini coefficient used widely in studies of income inequality and poverty (see for example, Chakravarty, 1990; Lambert, 1990; Atkinson and Bourguignon, 2000). The LGC is a number that captures the distribution of employment in an industry acrossgeographic areas, relative to the distribution of total employment. It signals the relative concentration pattern of employment in a certain economic sector in a given area in relation to other sectors in the same area.The HHI is defined as the aggregation of the industrial shares of all areas in a region, usually the country (Kim et al., 2000).It measures the extent to which a given industry is distributed throughout a large number of sub-areas (say, counties orother geographical sub-units).Neither the LCG nor the HHI are aimed at identifying logistics (or any other) clusters. They measure industry concentration in a country (or other reference area), but do not provide information on where the concentration is located within thatreference area. As such these indices are not considered further in this paper (they are defined, though in Appendix A).The main criticism of the LQ and HCLQ indices (and also of the LGC and HHI) is that, being based on employment, they donot account for the difference between a single large firm in a region and a set of multiple firms, that is, ‘‘they do not distinguish whether the concentration of an activity is due to internal or external economies of scale’’ (Ratanawaraha and Polenske, 2007).One of the most sophisticated methods to measure the degree of spatial concentration of firms is the Ellison–Glaeser Index (EGGCI), which ‘‘eliminates the effect of the random distribution of establishments on firms’ locations by comparing theestimated spatial HHI for a given industry to the expected value of HHI’’ (Li, 2006). However, the application of this measureis limited due to the extensive data requirements and its sensitivity to the geographic units used. Additional limitationsare rooted in the difficulty of comparing the value of the index at the international level, because of the different sizesamong regions and countries (Ratanawaraha and Polenske, 2007). Consequently this index is also omitted from furtherdiscussion.5. ModelA desirable indicator for identifying and defining logistics clusters should: (i) identify the concentration of activities, (ii)indicate where that concentration is located (iii) give a sense of the size of the concentration in the geographic area, (iv) guarantee that the concentration is due to the presence of external economies of scale, (v) work with the available data, and (vi)be replicable.To tackle this challenge, this approach described here combines two indicators: the Horizontal Clustering Location Quotient (HCLQ) and a newly defined Logistics Establishments Participation (LEP) index. HCLQ identifies both the location andmagnitude of the concentration of logistics activities. The LEP guarantees that the concentration is due to the presence ofexternal economies. Both indices require a minimum amount of available data (employment and establishment data), which
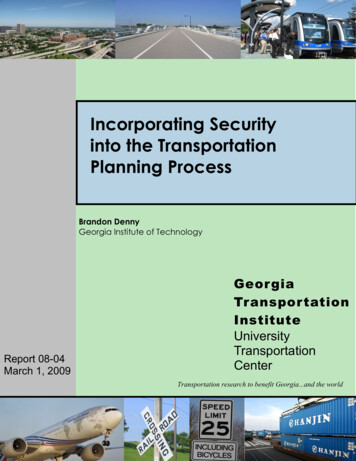
226L. Rivera et al. / Transportation Research Part A 59 (2014) 222–238in the US is available at the county level, from government statistics, thus allowing for replication. A cluster in this study isdefined as a county with concentration of logistics activities or several adjacent counties with such concentration.HCLQ is defined as:EJHCLQ j ¼ Ej bE J expected number of logistics employees inwhere Ej number of employees in the logistics industry in county j, and bcounty j, which is calculated as the number of logistics jobs in the county that would produce a Location Quotient equalto one. HCLQj 0 implies that county j has a higher concentration of employment in the logistics industry than the countryas a whole. The magnitude of the concentration is indicated by the absolute value (extra number of logistics employees in thecounty).Since objective here is to identify logistics clusters, there is a need to have not only concentration of logistics employment,but also external economies of scale. This is particularly important since, as Henderson (2003) reports, activity at small andmedium firms contributes significantly to external economies of scale. Thus, this paper introduces a Logistics Establishments’ Participation (LEP) index, representing the share of the countrywide logistics establishments that a county has. Itis defined as follows:LEPj ¼esjESwhere esj number of logistics establishments in county j, and, ES number of logistics establishments in the country.The larger the LEP of a given county, the larger is the number of logistics establishments located in the county. A cutoffvalue of 0.1% was chosen. It implies that to be considered a cluster, a region has to have at least 0.001 of the logistics establishments of the nation (in addition to HCLQ 0). This cutoff value was chosen using the known group validity method(Babbie, 2009) shown below. The rationale for and the effects of the choice of the LEP cutoff value are shown in Section 1.The process leading to the particular value of 0.1% can be summarized as follows:1. Known clusters – Data from reports and interviews with experts in the logistics industry from the MIT Center forTransportation and Logistics, the Harvard Institute for Strategy and Competitiveness and the Indiana BusinessResearch Center were used to draw a list of seven known logistics clusters in the US today. This list included LosAngeles, Chicago, Memphis, Louisville, Miami, Houston and New York/New Jersey.2. Minimize Type I error – Starting from a LEP cutoff value of 1, the cutoff was decreased until all seven known clustersshowed up in the list of identified clusters. This happened at a cutoff value of 0.2%. At this point 31 additional clusters were identified, all of which were recognized by the experts as actual logistics clusters, thus minimizing type Ierror (H0: The identified cluster is a logistics clusters indeed).3. The identification was further verified using information from City data. City data is a social and economic databasefor counties and cities in the US and Canada (http://www.city-data.com/). This database was used as a secondarysource, rather than a primary source, because it is private and lack of bias could not be ascertained. Also, the citydata base covers only the US and Canada and not available elsewhere else in the world. Lastly, the structure of thisdata base is such that to identify a cluster directly from city data one needs to examine whether each county hasconcentration of logistics activities, a manual task that prohibits detailed multiple analyses.4. Minimize false positives – In order to capture additional logistics clusters, the LEP cutoff value was increased continuously until, at 0.1%, false positives started showing up. False positives were also checked as ‘‘clusters’’ that did notappear in the city database and were not recognized by our experts as actual logistics clusters. The number of falsepositives increased when the cutoff value was reduced further. Therefore 0.1% became the LEP value that minimizestype II error, resulting in 61 identified logistics clusters. The process is depicted graphically in Fig. 1.5.1. DataThe data consisted of employment and establishments at the county level for 3095 US counties (excluding those of Hawaii, Alaska and Puerto Rico), based on the North American Industry Classification System (NAICS). Six-digit classificationwas used, based on the County Business Patterns (CBP) and Statistics of U.S. Businesses (SUSB) from the U.S. Census Bureau.The logistics sector definition includes the subsectors depicted in Table B1 in Appendix B. Even a casual inspection of the datasource reveals the heavy weight of transportation activities in the database.6. Results: cluster identificationWith the data at hand, the sensitivity of the number of clusters identified to the LEP critical value was examined, sinceunlike LQ, LEP does not have a ‘‘natural’’ cutoff value and the process described in the last section was of our own making.Fig. 2 depicts the number of logistics clusters (defined as a group of one or more adjacent counties with HCLQ 0) as a function of different levels of Logistics Establishments’ Participation cutoff value (horizontal axis). When choosing a small criticalvalue, the number of potential clusters explodes. When choosing a high critical value, the restriction on establishments
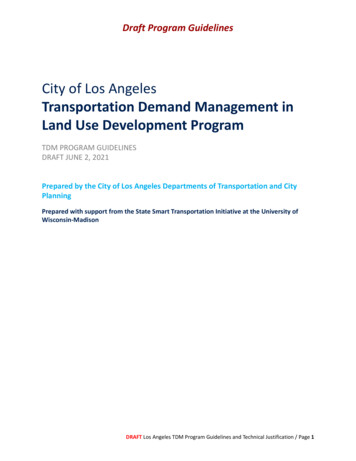
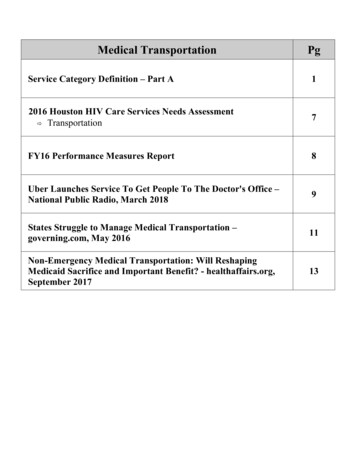
L. Rivera et al. / Transportation Research Part A 59 (2014) 222–238227Fig. 1. Determination of LEP cutoff value.(absolute concentration) increases and the number of logistics clusters identified goes to zero. A critical value of 0.1% leads tothe inclusion of just over half (51%) of the logistics establishments in the US (and 76% of the employment), while identifying61 clusters (comprising 97 counties).Fig. 3 depicts the identified logistics clusters (HCLQ 0 and LEP 0.001) in the US. The pattern depicted in the legend ofthe figure represents the size of the cluster as measured by number of employees. Those with the highest index value include(in order of size): Los Angeles, Chicago, New York/New Jersey, Atlanta, San Francisco, Dallas, Miami, Denver, Columbus, Jacksonville, Indianapolis, Houston, Orlando, Chattanooga, Memphis, Detroit and Laredo. A brief description of the seven largestlogistics clusters is presented in Appendix C.
228L. Rivera et al. / Transportation Research Part A 59 (2014) 222–238Although the methodology has some data limitations, results were intuitive. All the 61 identified clusters are indeedagglomerations of logistics activities. This was verified empirically, first by using face validity by personal knowledge ofresearchers at the MIT Center for Transportation and Logistics; and second, by using convergent and construct validity. Convergent validity determines whether the scores of different indicators of a concept
a Center for Transportation and Logistics, Massachusetts Institute of Technology, USA bSloan School of Management, Massachusetts Institute of Technology, USA article info Article history: Received 15 September 2012 Received in revised form 18 August 2013 Accepted 13 November 2013 Keywords: Logistics Supply chain Agglomeration Cluster .