Transcription
Marzluff, J. M., et al. 2001. Pp 332-363 in Avian ecology and conservation in anurbanizing world (J. M. Marzluff, R. Bowman, and R. Donelly, eds.). KluwerAcademic Press, Norwell, MA.Chapter 16Causes and consequences of expanding AmericanCrow populationsJohn M. Marzluff1, Kevin J. McGowan2, Roarke Donnelly1, and Richard L.Knight31College of Forest Resources, University of Washington, Box 352100, Seattle, WA 98195 USA,email: corvid@u.washington.edu2Department of Ecology and Evolutionary Biology, Cornell University, Corson Hall, Ithaca, NY14853 USA3Department of Fishery and Wildlife Biology, Colorado State University, FortCollins, CO 80523 USAKey words:American crow, diet, dispersal, metapopulation, nest predation, populationgrowth, source-sponge, population dynamics, urban footprint, urban sprawl,urbanizationAbstract:Corvid populations are increasing worldwide in response to urbanization. Weinvestigated the response of American Crows (Corvus brachyrhynchos) tourbanization by (1) comparing rates of winter population change betweenurban and nonurban locations (using standard Christmas Bird Counts); (2)quantifying population size along a gradient of urbanization in westernWashington; and (3) pooling studies from eastern (New York), midwestern(Wisconsin), and western North America (Washington and California) relatingsurvivorship, reproduction, and space use to urbanization. American Crowpopulations tend to be densest and increasing most rapidly in urban areas ofNorth America. This appears to be facilitated by small space needs of crowsin urban relative to suburban, rural, and exurban areas. Crow survivorship ishigh across the urban gradient, but reproduction and hence population growth,peaks in suburban and rural settings. Local demographic considerationsappear unable to account for changing winter crow populations. Rather, wehypothesize that urban crow populations may be increasing primarily as331
332Chapter 16surplus crows from suburban and rural areas disperse into the city whereanthropogenic food sources are easily located, rich, and concentrated. Thishypothesis likely is affected by local crow sociality. In the western UnitedStates, where pre-breeders often form flocks able to exploit urban riches, ourdispersal hypothesis may be accurate. But, in midwestern and eastern areas,where crows migrate south for winter or remain on territories to help ratherthan float as pre-breeders, dispersal may not be adequate to fuel urbanpopulation growth. Refuse, invertebrates, and small vertebrates appeared to bemore common food items than the nest contents of other birds. This, and thetypically diverse suite of nest predators in any area, may explain why the rateof predation on artificial nests we placed throughout the urban gradient wasnot highly correlated with the abundance of crows. We encourage researchersto study how urbanization affects important mechanisms (like nest predatorsand predation) so environmental policy will benefit from a detailed, scientificunderstanding of how avian communities are structured.1.INTRODUCTIONAs a rule, bird community diversity in urban landscapes is markedlylower than in comparable rural/exurban communities (Marzluff 2001).Diversity is reduced because (1) some species' habitat requirements are nolonger met and (2) other species able to exploit humans (‘humancommensals’) increase in abundance and dominate resources such as foodand nesting space, or reduce the productivity of other species by preying ontheir nest contents. Many magpies, jays, and crows are human commensalsthat have increased in urban areas worldwide (Konstantinov et al. 1982,Eden 1985, Fraissinet 1989, Konstantinov 1996, Hogrefe et al. 1998; Jerzak2001). Their abilities to exploit anthropogenic food resources and their habitof preying on other species’ eggs and young suggest that their success maybe partly responsible for many other species’ failure to thrive in urban areas.American Crows (Corvus brachyrhynchos) are human commensalsthroughout the coterminous United States. Standardized surveys andhistorical records suggest that American Crows increased in response toEuropean colonization of North America by spreading from east to west asthe American frontier was opened and developed (Marzluff et al. 1994).Crows were uncommon throughout the Great Basin and Pacific Coastthrough the early 1900s, except along riparian areas (Monson 1946, Richards1971). Populations increased substantially in Oregon, Washington, and thecentral valleys and northern portions of California from the late 1800s to mid1900s (Brooks 1925, Robertson 1931, Emlen 1940). As agriculture andurbanization continued to spread, so did crows (Pitelka 1942, Richards1971). Accounts from localities such as Las Vegas Hot Springs, NewMexico (where crows were rare in 1882, but one of the commonest speciesin 1959; Rickard 1959) are typical of the crow population explosion. The
16. Expanding American Crow populations333explosion has continued throughout the latter half of the 20th century,especially in areas of urban growth and sprawl (Marzluff et al. 1994,Hogrefe et al. 1998).Although many researchers have documented the increase in crowpopulation size and speculated on its effects, there are no published data onthe attributes of crow populations that may explain the increase. Therefore,we pooled data from eastern, mid-western, and western crow populations todetermine: (1) the relationship between the degree of urbanization and crowabundance, area use, and foraging behavior; (2) if crow demography variedwith degree of urbanization; and (3) if a positive relationship existedbetween the rate of predation on other songbird nests and abundance ofcrows. We use this information to develop a general model of crowpopulation dynamics that is amenable to empirical testing.2.METHODS2.1Study Areas and Research ApproachesWe studied crows in six locations (Table 16.1) along a gradient (definedby Marzluff et al. 2001) from urban (Seattle, WA; Los Angeles, CA;portions of Madison, WI) through suburban (Madison; Ithaca, NY; outlyingareas near Seattle), exurban (Cascade and Olympic Mountains, WA), andrural (Tompkins County, NY) areas to wildland (Olympic Peninsula, WA).We monitored nests and individually marked birds in neighborhoods,campgrounds, golf courses, parks, cemeteries, campuses, and wildlandreserves (Caffrey 1992, 1999, 2000; McGowan 2001).2.1.1Western WashingtonThe western Washington study areas span the entire gradient ofurbanization from downtown Seattle to the heart of Olympic National Park(47o,40' N; 122o,20' W; Fig. 16.1). Our sites were predominantly coniferousforests (Douglas-fir [Pseudotsuga menziesii], western hemlock [Tsugaheterophylla], and western redcedar [Thuja plicata]) with 5 – 50% deciduousoverstory (big leaf maple [Acer macrophyllum], and red alder [Alnusrubra]). Overstory trees ranged from 50 to 200 years old. Canopy coverwas 50 – 90%. Understories were well developed and ranged from nativeshrubs (mainly Gaultheria shallon, Vaccinium parvifolium, Sambucusracemosa, Oemleria cerasiformis, Rubus spectabilis, Acer circinatum,Mahonia nervosa, Rubus parviflorus, and Symphoricarpos albus) in exurbanand wildland sites, to complex mixes of native and exotic shrubs in urban
334Chapter 16and suburban sites. Timber harvest and recreation were the dominant landuses in the wildland and exurban sites. There, landscapes ranged fromcontiguous mature forest to highly fragmented, managed timberlands (Fig.16.1). Suburban sites usually contained 50% greenspace in the form ofscattered parks and riparian corridors. Urban sites had 20% greenspace,predominantly in the form of parks that ranged in size from 1 – 600 ha.The focus of our study in western Washington was to understand thepopulation structure and dynamics of crows in relation to urbanization and torelate crow populations to the avian community structure and theproductivity of other sympatric songbirds. To accomplish this we capturedand tagged adult crows, located and monitored nests, banded and observedTable 16.1. Attributes of study areas and aspects of crow biology recorded.LocationYears1990 human Points studied on gradientAspects ofstudiedpopulationbiology studiedFecundityMadison1982 –191, 000Urban neighborhoods,WI1985Suburban neighborhoods,woodlots, golf courses, parks,university campus, cemeteryIthacaNY1989 –199929, 000Suburban neighborhoods,woodlots, golf courses, parks,university campus, cemeteryTompkinsCountyNY1989 –199967,000rural deciduous woodlots,agricultureLos AngelesCA1985 –199011 millionUrban golf courseSeattle andCascadeMountains,WA1998 20003 millionUrban and suburbanneighborhoods, parks anduniversity campus, exurbanwoodlandsOlympicPeninsula,WA1995 –20000 – 2,500Suburban and exurbanneighborhoods, wildlandcampgrounds and reservesFecundity,survivorship,space use, socialbehaviorFecundity,survivorship,space use, socialbehaviorFecundity,survivorship,space use, socialbehaviorFecundity,survivorship,space use,foraging, nestpredationFecundity,survivorship,space use,foraging, nestpredation
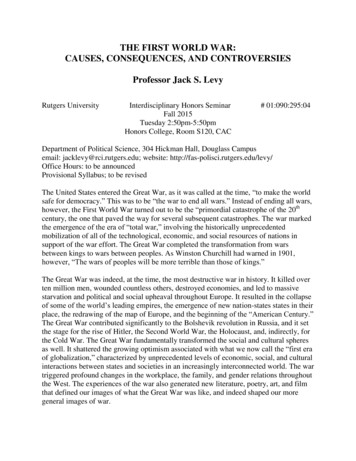
16. Expanding American Crow populations335young, and radio-tagged a sample of birds each year to determinesurvivorship, foraging behavior, and patterns of space use (Table 16.1). Wetypically banded 100 adults, monitored 30 nests, banded 90 nestlings, andradio-tagged 30 crows each year. In addition, we monitored the reproductivesuccess and abundance of other songbirds in our crow study areas.Figure 16.1. Land-cover on western Washington study areas with inset orthophotos. TheOlympic Peninsula forms the left side of the figure and the Cascade Mountains form the rightside. Seattle is the highly developed area in the center of the classified image.
3362.1.2Chapter 16Los AngelesCrows were studied on two contiguous golf courses that were part of theSepulveda Dam Recreation Area (34o,30' N; 118o,30' W; elevation 2100m; Fig. 16.2a). In this area, tree cover was approximately 15-20% andunderstory was lacking. The park itself had little development and a mostlycontinuous ground cover of exotic, mowed grasses. It included ball fields,picnic areas and the golf courses. It was surrounded by dense housing (1405dwellings per mile2), a large human population (3300 per mile2 ), andassociated services of Encino, California.The primary goal of the Los Angeles study was to understand socialorganization and the correlates of breeding success in this cooperativelybreeding population (Caffrey 1992, 1999, 2000).2.1.3MadisonCrows were studied in a variety of settings (neighborhoods of various age,parks, woodlots, cemeteries, and university campuses) in the town ofMadison, Wisconsin. Madison (43o,05' N; 89o,22' W; elevation 270 m; Fig.16.2b) is built on an isthmus between two lakes, and includes 21 golf coursesand the most restaurants per capita of any U.S. city. The population ofMadison at the time of this study (1980) was 170,616 and housing andpopulation densities around all study sites varied from urban to suburban.The study sites varied from largely concrete and exotic plant species(business district) to largely native vegetation and native species (woodlots).The sites were ranked in order of increasing domination by humans aswoodlots, parks, cemeteries, university campus, neighborhoods, andbusiness district. Impervious surfaces covered approximately 80% of thebusiness district, but less than 1% of the woodlots. Understory vegetationwas non-existent in the business district, but covered about 50% of thewoodlots.The goals of the Madison study were to understand crow demographyand population dynamics in a variety of suburban settings.
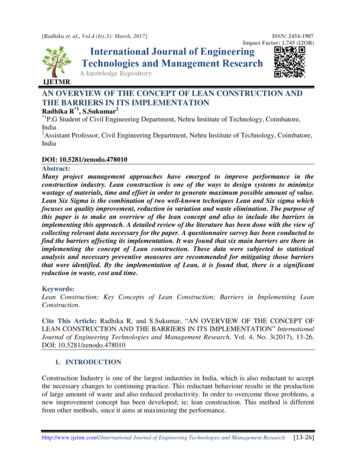
16. Expanding American Crow populations337ABFigure 16.2. Study sites (A) in Encino, California near Los Angeles and (B) in Madison,Wisconsin. The focal golf course in Los Angeles is indicated by an arrow. The Los Angelesimage is an orthophoto taken in 1998 covering 16,000 ha. The Madison image is a Landsatimage taken in 1999 covering 7,000 ha.
3382.1.4Chapter 16Ithaca and Tompkins CountyCrows throughout Ithaca, New York and surrounding Tompkins Countryhave been studied extensively by McGowan. The study areas, methods, andgoals of this research are detailed in McGowan (2001, Fig. 17.1).2.2Abundance2.2.1Christmas Bird CountsTo determine if the recent growth of crow populations across the U.S.was related to the degree of urbanization, we selected 70 Christmas BirdCount (CBC; Audubon Society 2000) locations that could be classified asurban ( 20% of the circle was developed in 1970) or exurban/rural ( 5% ofthe circle was developed in 1970 and the 1996 human population size was 10,000). We used only sites that had at least 20 years of count data from1960 – 1996 (Appendix 16.1). No single state was represented by more thantwo urban or two exurban/rural sites. We did not use Breeding Bird Surveysbecause few are conducted in urban areas (Droege 1990).We related the number of crows (standardized per party hour) to yearusing standard linear regression. All crow species and subspecies werelumped (Fish Crows were rare in our sample; 0.07% of the total). We usedthe slope of the regression as an index of crow population growth in eachcircle. Slopes were compared between urban and exurban/rural sites with aMann-Whitney U-test.2.2.2Surveys in Western WashingtonWe conducted fixed area (50m radius) point counts in all study sites inwestern Washington to determine if crow abundance (1995-2000) differedalong the gradient of urbanization. We surveyed crows during the breedingseason (April - August) using from 1 – 20 points spaced 250 m apart in eachof our forested stands. At each point we recorded all crows heard and seenwithin 50 m during a 10-min count. At exurban and wildland sites we usedcrow calls at 2 points per stand to increase the chance that rare birds weredetected. We censused each stand 2 – 5 times per season and used themaximum count (standardized as crows per point) per season to characterizeabundance in the stand. Details of our survey procedure are in Luginbuhl etal. (in press).
16. Expanding American Crow populations2.3339Monitoring Crows in the WildWe captured and marked crows in all our study sites as nestlings andadults using mist nets, noose carpets, walk-in traps, net guns, and legholdtraps. We weighed each individual and measured its culmen length andwing chord. All individuals were uniquely banded with colored leg bands(Washington, Wisconsin) or patagial tags (California, New York). Fieldmethods for New York and California are detailed elsewhere (Caffrey 1992,1999, 2000; McGowan 2001).A sample of individuals in the Washington study areas was instrumentedwith backpack-mounted radio transmitters. Transmitter harnesses weremade from Teflon ribbon following Buehler et al. (1995). We attempted toobserve each radio-tagged bird at least once per week to confirm theirsurvivorship. Tagging may influence demography, but without radiotagging, survival could not be estimated across our large, remote study area.Any biases are likely to be slight (Vekasy et al. 1996, Withey et al. in press)and should be equal across treatments so that relative comparisons ofdemography between areas are unaffected.In Washington, radio-tagged birds were the subjects of 1-2 hr focalobservations approximately once each week throughout the spring, summer,and fall to quantify their foraging behavior and patterns of space use. Werecorded the type of food, how it was obtained (grab, pick, probe, hawk,kleptoparastize, glean, etc.), and where it was obtained (tree species, heightand DBH; habitat cover classes defined on habitat map and structuralcomplexity used to define our stands; substrate branch, ground, variousmanmade structures, etc.; microsite moss, lawn, asphalt, etc; distance toforest edge). We quantified the rate and success of foraging, when possible,by counting the total prey capture attempts and the percentage that weresuccessful (indicated most reliably by swallowing) per unit time.Locations of radio-tagged crows were plotted on maps/photos of theWashington study sites (a global positioning system was used in remoteareas) and used to calculate home range statistics with a computer program,Ranges V (Kenward and Hodder 1995). During each 1-2 hr focalobservation period, we plotted the entire area used by a bird, then recorded 2- 3 locations (extreme and mid points of area used) for subsequent definitionof the home range. We occasionally recorded single locations of animals attheir roosts and during our travels throughout the study area. We purposelyrecorded few locations per day on each animal to minimize dependenceamong relocations. We computed maximum use areas (100% convexpolygons) and core areas within them (cluster techniques; Kenward 1987).We computed minimum convex polygon home ranges to facilitatecomparison with other studies and to avoid assumptions about the statistical
340Chapter 16distribution of animal locations. We defined an animal as being ‘adequatelysampled’ if 20 locations were obtained. Investigating the increase in rangesize with sampling effort (incremental analysis) suggests that an average of60-75% of the entire range is defined by 20-25 locations; 95% confidenceintervals around these means include 100% definition of the area used. Ourdefinition of adequate sampling is supported by the lack of a strong positivecorrelation between the number of location estimates and the home rangesize of adequately sampled animals (the correlation was in fact negative; r -0.30, n 37, P 0.07). In the Los Angeles and Ithaca study areas, coreareas and defended territories were determined by spot mapping locations ofcolor-marked individuals (e.g., McGowan 2001).2.4Calculation of λWe pooled our demographic data across study areas to estimate agespecific fecundity and survivorship in urban, suburban, rural, and wildlandsettings. We assumed females in all areas first bred when four years old(modal age of reproduction in Ithaca; McGowan, unpublished data) and thatproductivity was constant until death. We calculated the annual productionof fledglings separately for each area using data from (1) urban greenspacesin Wisconsin, Los Angeles, and Seattle, (2) suburban developments andparks in Wisconsin, Seattle, and Ithaca, (3) rural Tompkins County, NewYork, and (4) wildland forests on the Olympic Peninsula. We assumed allcrows died by age 21 years. We assumed survivorship of 1-year old crowswas equal across the urbanization gradient at 48% (McGowan 2001), whileannual survivorship of 2- and 3-year-olds was 72% (all estimates based onresults from Ithaca; McGowan, unpubl. Data and 2001). We calculated theannual survivorship of breeders separately for each area using data from (1)urban greenspaces in Los Angeles and Seattle, (2) suburban developmentsand parks in Seattle and Ithaca, (3) rural Tompkins County, New York, and(4) wildland forests on the Olympic Peninsula. Survivorship was calculatedusing color-marked birds in Los Angeles (Caffrey 1999), Ithaca, andTompkins County (McGowan 2001) and radio-tagged birds in Washington.We used these data to create a transition matrix for each degree ofurbanization and solved the matrix for λ by finding the largest positiveeigenvalue using RAMAS (Akcakaya1999). Variation in λ resulting fromdemographic stochasticity also was estimated using RAMAS. To do this,we assumed the following standard deviations for demographic parametersfor all populations (Fecundity: 1-year-old 0.02, 2-year-old 0.04, 3-yearold 0.13, 3-year-old 0.17; Survivorship: fledglings 0.25, 1-year-old 0.19, 2-year-old 0.19, 2-year-old 0.04).
16. Expanding American Crow populations2.5341Artificial Nest ExperimentsWe used a variety of artificial nests to quantify the risk of nest predation.In urban and suburban Seattle we placed handmade nests in (1) nativeground cover (typically sword fern, Polystichum munitum) to simulate thoseof ground nesters such as Song Sparrows (Melospiza melodia), SpottedTowhees (Pipilo maculatus), and Wilson’s Warblers (Wilsonia pusilla), and(2) in shrubs to simulate those of American Robins (Turdus migratorius) andSwainson's Thrushes (Catharus guttatus). Both types of nests were filledwith two, small (12x18 mm), blue plastic, wax-coated eggs. The waxcoating allowed us to infer the type of predator from the marks on the egg(identification was calibrated using cameras to record predators at anindependent subset of nests). Details of these experiments can be found inDonnelly and Marzluff (in press). On the Olympic Peninsula, we simulatednest sites of Marbled Murrelets (Brachyramphus marmota) by placing anartificial egg or taxidermy-mounted chicken chick in a typical murreletcanopy nesting location. Details of these experiments can be found inMarzluff et al. (2000). Ground and shrub nests remained in place untilpreyed on or until 27 days had elapsed. Canopy nests remained in placeuntil preyed on or for 30 days. We determined the rate of predation within astudy plot by averaging the time until predation (all nests were checkedevery three days) for all nests within a given stratum.3.RESULTS3.1Crow Abundance and UrbanizationIn western Washington, the relative abundance of crows increased withincreasing degree of urbanization. Crows were rarely found during surveysin wildlands far from campgrounds (Fig. 16.3). Exurban areas also had fewcrows in contrast to suburban and urban areas. Crow abundance in urbanareas was approximately 30 times greater than in wildlands (Fig. 16.3).Across the U.S., crow populations tended to increase in urban areas from1960 – 1996, but they remained relatively constant in exurban and wildareas. The annual rate of increase in crow populations was marginallygreater in urban areas (mean 27.2%, SE 13.5% , n 35) than in exurban,rural, and wildland areas (mean -5.1%, SE 22.5%, n 35). However,because locations varied tremendously in the rate at which crow populationschanged (Appendix 16.1), this difference was only marginally significant (U 516, P(1-tailed) 0.13). Only one rural area had a substantial increase in thecrow population (Rupert, ID; 372% annual increase). In contrast, five urban
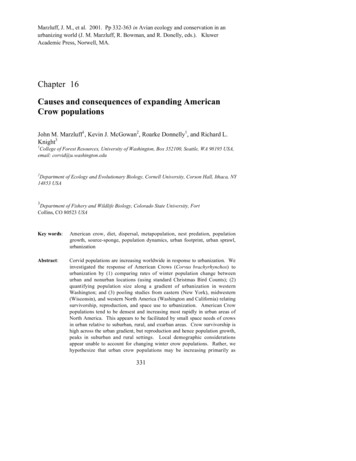
342Chapter 16areas had substantial increases (Albuquerque, NM: 425%; Hartford, CN:187%; Sacramento, CA: 122%; Seattle, WA: 57%; and Portland, OR: 51%).3.2Use of Space and Foraging BehaviorBreeding adult crows occupied areas during the spring and summer thatvaried from slightly over 1 ha to over 3500 ha. Across areas, this variationwas positively correlated with the degree of urbanization (Fig. 16.4). In theextremely dense breeding population of Los Angeles, core area size was lessthan 2 ha, but where crows were rare (remote portions of the OlympicPeninsula) home range size averaged 2100 ha.Certainly, part of this difference is due to our use of (1) a variety ofmeasures of area use (defended territories in New York, core use areas inLos Angeles, and entire traveled areas in Washington) and (2) a variety oftechniques (visual observations Los Angeles and New York, radio-telemetryin Washington). However, when we examine these patterns within two ofFigure 16.3. Variation in average ( SE) numbers of crows counted during the summer atvarious points along a gradient of urbanization in western Washington. Urban, suburban, andexurban woodlots are in the Seattle and Cascade Mountain study areas. Exurbancampgrounds and wildland sites are on the Olympic Peninsula. Numbers above bars aresample sizes of independent study sites.
16. Expanding American Crow populations343the study areas we still detect similar increases in area use as humansettlement decreases. In upstate New York, breeding crows in the town ofIthaca used areas approximately four times smaller (mean 8.7 ha, n 18)than crows breeding in adjacent, rural Tompkins County (mean 37.3 ha, n 59; McGowan 2001; Fig. 16.4). In western Washington, crows breedingon the Olympic Peninsula had home ranges 7 times larger than those innearby urban Seattle and suburban Snohomish (Fig. 16.4). Furthermore, onthe Olympic Peninsula home range size was three times smaller for crowsnesting in areas with human presence (rural and exurban developments andrecreation areas; mean 308 ha, n 22, SE 61.8) relative to crows nesting 5 km from such areas (mean 2124 ha, n 8, SE 706; F 1,29 18.2, P 0.001). Variation in space use within areas of similar human settlementmay be related to regional differences in social organization (crows in LosAngeles were colonial, but crows in our other urban study areas wereterritorial during the breeding season), breeding success (crows increasedFigure 16.4. Average ( SE) space use by breeding crows in the United States. Crows inSeattle, Snohomish, and all sites on the Olympic Peninsula were monitored with telemetryusing similar methodology. Likewise, crow in Ithaca and Tompkins County, New York weremonitored as part of a single study with consistent methodology.
344Chapter 16their range size in Seattle when their nests failed despite where they occurredon the urban gradient), and other aspects of locally important resources.Our observations in western Washington suggest that differences in spaceuse by crows along the urban gradient may be due to differences in diet.Crow diets varied from urban to wildland settings in Washington (Fig. 16.5).Human refuse (prepared meats, bread products, and vegetables) was thedominant food item eaten by crows in Seattle (65% of observed foodconsumption; Fig. 16.5A). Road-killed mammals, live rodents and reptiles,and invertebrates composed 25% of Seattle crow diets. In contrast, crowson the Olympic Peninsula consumed roughly equal proportions ofinvertebrates (38%) and human refuse (35%) regardless of their proximity tosmall settlements and recreation areas (Fig. 16.4B). Wildland crows oftenflew tens of kilometers to utilize anthropogenic food sources (Marzluff andNeatherlin, unpubl. data).We followed radio-tagged crows in Washington to obtain unbiasedestimates of their reliance on nest contents for food. We rarely saw crowsprey on other species of songbirds' nests (n 2 times) during the five yearsof intensive observation ( 1500 hrs yr-1) of 54 radio-tagged birds on theOlympic Peninsula. Nest predation was not observed during two years ofobservation ( 800 hrs yr-1) of 14 radio-tagged crows in Seattle. However,we were occasionally (n 8 times) attracted to songbirds mobbingmarauding crows. The consciousness of this mobbing may lead to inflatedestimates of nest predation by casual observers of crows.3.3Demography and Population DynamicsPairs breeding in urban areas produced fewer fledglings each year than pairsbreeding in suburban, rural, or wildland areas (Table 16.2). Urban breedersaveraged only 60% of the number of fledglings per pair (mean 1.1, SE 0.17, n 3 studies) that were produced by suburban (mean 1.90, SE 0.15, 3 studies) breeders. Rural (1.6, n 1 study), and wildland breeders(1.5, n 1 study) produced intermediate numbers of fledglings. Lowerproductivity by urban crows resulted primarily from an overall decrease innest success, rather than a decrease in the number of fledglings persuccessful nest (Table 16.2). However, in Ithaca suburban crows hadsignificantly higher overall nest success but fledged significantly fewernestlings per successful nest than did rural crows (McGowan 2001).Suburban crows consistently averaged around 60% nest success.Annual survivorship of breeding crows was high in all study areas. Itappeared to be lowest in our wildland and Seattle urban study areas (Table16.3). There, nearly 20% of crows died each year, but sample sizes aresmall. All observed mortality in our wildland study areas occurred on crows
16. Expanding American Crow populations345Figure 16.5. Diets of breeding crows during the spring and summer in western Washington.Numbers of each prey type that we observed crows eating are plotted separately for 12 crowsin urban and suburban Seattle/Snohomish (A) and 37 exurban and wildland crows on theOlympic Peninsula (B).
346Chapter 16nesting 5km from human settlement or recreation sites (3 of 9 such crowsdied). Wildland crows that bred adjacent to small settlements and recreationsites appeared long-lived (only 1 of 20 died during five years ofobservation).Using the variation in annual breeder survivorship and reproduction inconjunction with our assumptions about age of first breeding, pre-breedersurvival, and longevity (see Methods), we estimated λ (geometric rate ofincrease) for urban, suburban, rural, and wildland crow populations. Thisdemographic analysis suggested that urban populations had the capacity forslight growth (λ 1.008), suburban populations should grow 15.8% per year(λ 1.158), rural populations should grow by 7.3% per year (λ 1.073), andwildland populations should grow 3.9% per year (λ 1.039). Incorporatingobserved annual variation in reproduction and survival into a model ofpopulation growth (as environmental variability) and incorporatingdemographic stochasticity (Akcakaya 1991) reveals that, at best, urban crowpopulations should only increase 6.3% per year. Growth of all crowpopulations was most sensitive to adult survivorship (elasticities: urban adultsurvival 0.54; suburban 0.36; rural 0.47; wildland 0.44). Thepredicted change in a crow population of 50 individuals living in each ofthese environments for 100 years is striking; suburban populations areTable 16.2.urbanization.SiteAnnual reproductive success of American Crows in areas of varyingUrbanSeattle parks, campus,neighborhoodsLos Angeles golf courseMadison parks, campus,neighborhoods, golf courseSuburbanSnohomish, WAMadison, WIIthaca, NYRuralTompkins County, NYWildlandOlympic PeninsulaNo.breedingattemptsYears ofstudy%successMean no.fledgedsuccessfulnest-1 yr-1Mean no.fledglingspair-1yr-1801998 - 200053.32.01.11471231985-19901982 - 198543.044.71.933.10.831.419562021998-20001982-198
population size and speculated on its effects, there are no published data on the attributes of crow populations that may explain the increase. Therefore, we pooled data from eastern, mid-western, and western crow populations to determine: (1) the relationship between the degree of urbanization and crow