Transcription
Field study of filmspreading on a sea surfacedoi:10.5697/oc.56-3.461OCEANOLOGIA, 56 (3), 2014.pp. 461 – 475.C Copyright byPolish Academy of Sciences,Institute of Oceanology,2014.KEYWORDSOil slickFilm spreadingSea surface pollutionField studyAleksandr E. Korinenko1, Vladimir V. Malinovsky1,21Marine Hydrophysical Institute of the NAS of Ukraine,Kapitanskaya 2, Sevastopol 299011, Ukraine;e-mail: korinenko.alex@gmail.com corresponding author2Small Enterprise DVS LTD,Kapitanskaya 4, Sevastopol 299011, UkraineReceived 20 December 2012, revised 14 March 2014, accepted 31 March 2014.AbstractThe results of a field study of surface film spreading on the sea surface are presented.The experiments were carried out in the coastal zone of the Black Sea in a widerange of wind speeds and wave conditions. Vegetable oil was used for preparing thesurfactants. It was found that at moderate and strong wind speeds the slicks takeon a shape similar to an ellipse and are orientated in the direction of the air flow.An increase in the speed of the spreading slick along its major axis with strongwind was discovered.1. IntroductionAn important aspect of the research problem of slicks on a sea surfaceis the study of their temporal dynamics. One of the significant parametersof surface films (SF) of different origin is their characteristic dimensions.Generally accepted theoretical models discriminate the process of spotThe complete text of the paper is available at http://www.iopan.gda.pl/oceanologia/
462A. E. Korinenko, V. V. Malinovskyspreading into typical temporal spreading stages: one or another physicalmechanism prevails at each stage.Fay (1969) identified three consecutive basic stages in the spread ofan initially concentrated volume of oil with constant properties, notably,gravity-inertial (balance between gravitational force and inertial force),gravity-viscous (balance between gravitational force and frictional force),and the surface tension regime, when the surface tension force and frictionalforce are in balance.These three stages are all characterised by power laws governing the sizeof the slick as a function of time α tβ but with different coefficients α and βfor each stage. Fay’s classification was a powerful incentive for the phasedstudying of these processes.A great many research papers are dedicated to theoretical models andlaboratory measurements of film spreading (e.g. Hoult 1972, Foda & Cox1980, Camp & Berg 1987, Dussaud & Troian 1998, Svitova et al. 1999,Boniewicz-Szmyt & Pogorzelski 2008 and references therein).In particular, Hoult (1972) and Buckmaster (1973) give theoreticalanalyses for the spread of oil slicks on a quiescent body of water. Thedependence of the film border on time, thickness and velocity distributionsalong a spreading film were analysed in detail by Foda & Cox (1980) andPhillips (1997) for both plane and axisymmetric slicks. Laboratory resultsof surface film dynamic of various pure oils and their liquid solutions (Camp& Berg 1987) are in good agreement with the model calculations presentedby Foda & Cox (1980).Boniewicz-Szmyt & Pogorzelski (2008) used video-enhanced microscopyand dynamic tensiometry methods to study the spreading of differentliquid hydrocarbons in laboratory conditions. According to the experimentalobservations of these authors, the lens expansion rates are one orderof magnitude lower than those predicted by classical tension-gradientdriven spreading theory. These authors proposed a surfactant rate-limitedadsorption mechanism to explain the results they obtained.The investigations mentioned above address the idealised case of a circular film spreading on a ‘calm sea’. However, the results of such studies donot describe the asymmetric spreading of surface spots in wind, wave andcurrent fields.In environmental conditions a surface film elongates and tends towardsa shape close to an ellipse (e.g. Lehr et al. 1984a, Elliot 1986). Lehret al. (1984b) linked the changing size of an oil spill with wind action.These authors proposed an empirical formula to describe the extension ofthe oil slick in the wind direction as a term that increases in magnitudewith time in proportion to the wind speed. Lateral spreading of the oil spill
Field study of film spreading on a sea surface463was described by the formula for the gravity-viscous stage. The importantconclusion of the results obtained by Lehr et al. (1984b) is that the spreadingrate along the major axis (the derivative of axis length with respect to time)has to increase as the wind strengthens. However, this empirical approachdoes not explain the physical causes of the asymmetrical spreading of surfacepollution.Elliot (1986) developed the concept of shear spreading caused by thenatural dispersion and subsequent resurfacing of oil droplets. In this modelthe slick size was calculated using the velocity shear for wind and waveconditions observed during the experiment (Elliot 1986). The model predictsthat the elongation of a slick will increase with increasing wind speed andwave height.The validation of oil spill models is complicated owing to the lack ofobservations in natural conditions, including the simultaneous recordingof wind/wave parameters and oil spill dynamics. Field investigations canbe resources for estimating the actual impact of wind and waves on SFspreading.The aim of the present study is to compare film spreading characteristicswith wind and sea wave parameters obtained during field experiments.2. Experimental2.1. Measurement methods of oil film spreadingThe results presented in this paper are based on the field data collectedduring controlled releases of film slicks in 2005–2007. An investigation ofoil spreading was carried out in the vicinity of an oceanographic platform(off the southern coast of Crimea, 44 23′ 35′′ N, 33 59′ 4′′ E), located about450 m from the shore; the sea depth there is 30 m.Vegetable oil (VO) was used for the preparation of surfactants. 94–96%of vegetable oil consists of mixtures of insoluble fatty acids; the remainderresembles fats and free fatty components. Vegetable oil forms a film on thewater surface and remains uniform at wind speeds up to 10–12 m s 1 . Thisallows film spreading to be investigated in a wide range of meteorologicalconditions.Volumes of vegetable oil (170 10 6 m3 in 2004 and 340 10 6 m3 in2005–2007) were poured into the water from a motor boat at a distance of1000–1500 m from the shore; at these distances the water depth exceeds60 m.The sea surface area covered with the VO film was registered usinga digital camera. Image resolution was 2288 1712 pixels. The camera wasplaced on a rock at a height of 150 m above the sea level. The distance to
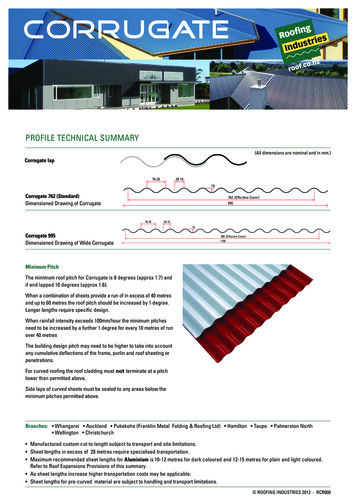
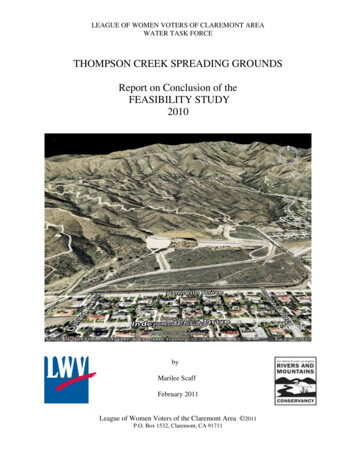
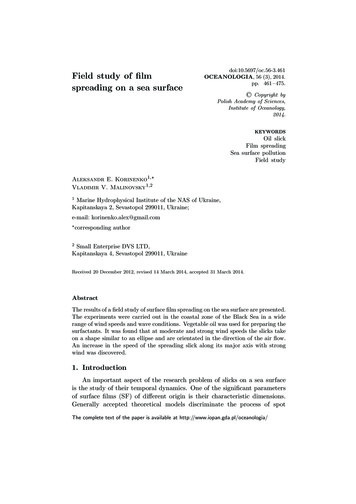
464A. E. Korinenko, V. V. Malinovskythe platform was 1290 m. Each experiment was accompanied by consecutivephotography at intervals of 3–4 min from the release of the slicks until itsdestruction. The photography was done at different camera field of viewangles, varying from 6 4.2 to 49.1 36.7 .The scheme of the experiment is presented in Figure 1, where theoceanographic platform, the camera’s position on the rock and the boat’sposition (conditional) are marked by the symbols P, C and B respectively.Cm. Koshkalatitude N44.40oBP44.39o33.98o33.99olongitude EFigure 1. Scheme of the experiment. The symbols P, C and B respectively designate the platform, the camera’s position on Mount Koshka and the boat’s positionThe known geometry of the proving ground enabled the photographsof the sea surface to be converted into a rectangular system of horizontalcoordinates. The origins of the coordinates of the converted photographscorrespond to the intersection point of the optical axis of the camera’sobjective with the sea surface.An example of the vegetable oil film evolution during the measurementscarried out on 9 August 2005 (run No. 1) is demonstrated in Figure 2, whichshows a series of six converted photos. The images were made at fixed timeperiods of 240 s, 420 s, 840 s, 1200 s, 1860 s and 1920 s from the beginningof the spillage. The wind direction with the speed of 7.9 m s 1 is shown bythe arrows in Figure 2.The slick contour on the sea surface was reconstructed according tothe converted images. Then all the coordinate systems of the convertedimages were converted into the Cartesian coordinate system. This allowed
465distance [m]distance [m]Field study of film spreading on a sea surfacedistance [m]distance [m]distance [m]Figure 2. An example of vegetable oil film evolution. The images were taken atfixed times of 240 s, 420 s, 840 s, 1200 s, 1860 s and 1920 s from the start of thespillage. The arrows indicate the direction of the windthe spatial orientation of the surface slicks to be compared with the windspeed direction.The sea surface photography was accompanied by hydro-meteorologicalmeasurements.The system for measuring the wind speed U and its direction ϕU , watertemperature Tw and air temperature Ta was placed on the oceanographicplatform. The wind speed and direction at a horizon of 23 m weremeasured by meteorological vane anemometer. The instrumental errors of allthermometers were less than 0.05 ; those of the anemometer were less than 0.2 m s 1 . Recalculation of the wind speed at a standard meteorologicalhorizon of 10 m was carried out by the method proposed by Large & Pond(1981).The characteristics of surface waves were determined by a resistant wavestaff that recorded sea surface elevations in the frequency range f 1 Hz.The distance from the wave staff to the platform was 9 m.In accordance with the wave data the significant wave heights Hs 4σς (where σς – standard mean deviation of the surface elevation) werecalculated. The frequency spectra of sea surface elevations S(f ) were plottedusing a standardised technique (Bendat & Piersol 1999).Table 1 summarises the environmental conditions during the experiments. The date, serial number of the measurement and the mean valuesof U , ϕU , Ta , Tw , HS are given.As follows from Table 1 the measurements were carried out in a widerange of wind speeds at neutral atmosphere stratification.
466A. E. Korinenko, V. V. MalinovskyTable 1. Experimental conditionsDateNo. ser.U[m s 1 ]ϕU[deg]Ta[C ]Tw[C .08.07113.32.78510226.429.323.526.20.290.152.2. Surface tension coefficient measurementThe time interval determining the dynamics of surface films at eachof the spreading stages depends on both the properties and the amountof spilled substance (Fay 1969). The inertial stage is the quickest one. Forinstance, if the amount of poured material is at least 10 m3 , the enlargementof the SF radius will last several minutes according to the law R(t) t1/2 .During the next few hours the slick axis length will grow under the influenceof gravitational and viscous forces as t1/4 . The final stage of spot spreadingis the surface tension stage. It is thought that if the amount of pouredmaterial is less than 1 m3 , the surface tension stage actually occurs fromthe very beginning of spot spreading. In our experiments the volume ofspilled material was no more than 340 10 6 m3 . Thus we can assume thatin fact from the release of the slick the VO film spreads under the forces ofsurface tension and viscosity.Spreading at this stage depends on the spreading coefficient (SC),defined asS σwa (σf a σf w ) ,where σwa , σf w , σf a are the coefficients of the interfacial tensions of waterair, water-film and film-air respectively. For spreading to proceed, thecondition S 0 must be satisfied.
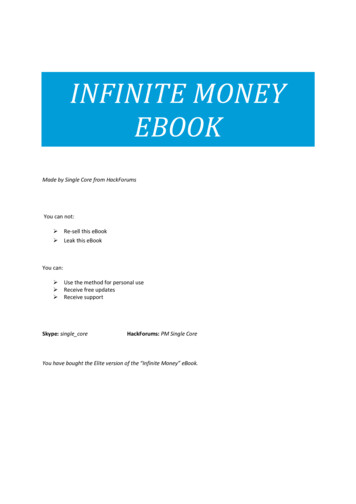
Field study of film spreading on a sea surface467The values of the coefficients σwa and water covered with oil film (σf a σf w ) were estimated under laboratory conditions.Standing waves were generated by a mechanical oscillator; theyhad sinusoidal horizontal oscillations of frequency f in a vessel of size10 cm 10 cm 2 cm equipped with etalon length markers.A pattern of bright and dark bands corresponding to the provisionsof the crests and troughs of the standing waves in the cell was recordedwith a digital camera. The camera was directed vertically downwards. Thesize of the images was 3888 2592 pixels. The crests of standing wavesare parallel along the short side of the picture. Fast Fourier transformwas used to calculate the spectrum of brightness for each image row. Thenthe whole brightness spectrum was averaged and the wave number of thestanding waves kw , corresponding to the maximum value of the spectrum,was determined.The value of kw with a known wave frequency allows us to calculate thesurface tension coefficient from the dispersion relationship as follows:σ ρω 2 gk,k3where ω 2πf – angular frequency of oscillations, k km /2 – wavenumberof surface wave, ρ – water density, g – acceleration due to gravity.According to the laboratory measurement results, the spreading coefficient for a saturated monolayer of vegetable oil was S (32 4) 10 3 N m 1 .The measurement error of SC was no less than 10%.3. Results and discussionDuring the experiment 16 series of film spreading measurements wereobtained under different wave and wind conditions. The wind speed rangewas from 1.6 to 11.7 m s 1 . Significant wave heights varied from 0.15 to1.03 m.Slicks have an elongate shape under moderate and strong winds. Thesemi-major axis and semi-minor axis of the slick are denoted by L and lrespectively.The direction of the semi-major axis of SF with the wind direction iscompared in Figure 3. The figure shows that the surface films are stretched inthe direction of the air flow. The data obtained are in qualitative agreementwith the results of the previous field studies by Lehr et al. (1984a) and Elliot(1986).An example of the dependence of L in the downwind speed direction andfilm area S on time is presented in Figure 4. Data obtained at various windspeeds are shown in this figure by the symbols ( ) – 1.6 m s 1 3.3 m s 1 ,
468A. E. Korinenko, V. V. Malinovsky200160ϕL [deg]1208040004080120160200ϕU [deg]Figure 3. Comparison of the direction the semi-major axis of surface film withthe wind direction16012000ab12080S [m2]L [m]800040004000010002000time [sec]3000010002000time [sec]3000Figure 4. Dependences of surface film sizes on time: a) – radius L, b) – square S.Values measured under different wind speed are marked with ( ) – U from 1.6 to3.6 m s 1 , ( ) – U 7.8 m s 1 , ( ) – U 11.7 m s 1 . The solid line in Figure 4corresponds to model (1)( ) – 7.8 m s 1 , ( ) – 11.7 m s 1 . The origin of the coordinates in Figure 4corresponds to the moment when the vegetable oil was first spilt. As followsfrom Figure 4 the values of L at a fixed time point grow when the wind speed
Field study of film spreading on a sea surface469increases. The same tendency is observed for areas of SF (Figure 4 b). Wedid not find an explicit dependence of the film slick axis l on wind speed.The values of the ratio L/l describing slick elongation at various times inthe wind speed range from 9 to 11.7 m s 1 , from 6 to 9 m s 1 and 3.3 m s 1are shown in Figure 5 by the symbols ( ), ( ) and ( ) respectively. The solidline shows the value of L/l 1 .2016L/ l128400100020003000time [sec]Figure 5. Dependence of the ratio of the large film axis to the small axis on time.Values measured for a wind speed range from 9 to 11.7 m s 1 – ( ), from 6 to9 m s 1 – ( ) and 3.3 m s 1 – ( ). The solid line corresponds to L/l 1As can be seen from Figure 5 at U 3.6 m s 1 the values of L/lchange from 0.9 to 1.1. Thus under calm wind conditions SF is circularin shape. Film slick elongation increases with a strengthening wind and atU 12 m s 1 values of L/l are 18.Let us define the rate of semi-major axis growth in the downwind andupupwind directions as udsp Ld / t and uupsp L / t respectively.Wind speed dependences of spreading rates in the downwind and upwinddirection are presented in Figure 6 and denoted by the symbols ( ) and ( )daccordingly. Values of uupsp and usp were calculated using all the data ofeach measurement and thus represent average values. Spreading rates atweak wind speeds varied from 0.01 to 0.02 m s 1 . There is an increase ofvalues of usp for moderate and strong winds. According to the results of theexperiments, the observed spreading rate of the semi-major axis of the film
470A. E. Korinenko, V. V. Malinovskyat U 12 m s 1 is 4 times higher than the value typical of U 1.6 m s 1– 3.6 m s 1 (see Figure 6).0.20-1udsp, uupsp [m s ]0.160.120.080.04004812U [m s-1]Figure 6. Dependences of mean film spreading rate on wind speed: ( ) – alongthe wind speed direction; ( ) – against the wind speed direction. The solid line isthe theoretical value estimated using model (2)Now we consider the growth of the surface film size under various waveconditions. The dependence of udsp on Hs is presented in Figure 7, wherethe symbols correspond to measurements at various inverse wave ages α U/Cp (Cp – wave phase velocity of the spectral peak): ( ) – α 0.9–1.3;( ) – α 2–3. The case denoted by ( ) relates to calm wind conditions andto the presence of a swell. As follows from Figure 7, no explicit dependenceof the SF spreading rate on Hs for the whole set of points is observed. Incontrast, the tendency of udsp to increase with increasing wave height for theobtained data set is visible when α 0.9–1.3 and α 2–3. At the sametime spreading rates for the case denoted by ( ) measured at Hs 0.62 mand U 1.6 m s 1 almost coincide with the values of udsp measured atHs 0.15–0.3 m.As noted above, one can expect that from the beginning of spotspreading, the surface tension regime is operative. The change of the film sizewith time in the absence of wind is determined by the balance of viscosityand surface tension.
Field study of film spreading on a sea surface4710.20usp, [m s-1]0.160.120.080.04000.20.40.60.81.01.2Hs [m]Figure 7. Dependence of the spreading rate on the significant wave height. Thesymbols correspond to the inverse wave ages: ( ) – α 0.9 1.3, ( ) – α 2 3,( ) – calm wind conditions with the presence of swellThe leading edge position and the spreading rate of SF as a functionof time t are written as (Fay 1969, Hoult 1972, Foda & Cox 1980, Phillips1997)R(t) Ku0sp (t) S 1/2 3/4t ,(µρ)1/4 R3S 1/2 1/4 Kt, t4 (µρ)1/4(1)(2)where µ – kinematic viscosity of water, K – experimental constant that canrange in magnitude from 0.665 to 1.52 (Dussaud & Troian 1998).It was shown by Camp & Berg (1987), Dussaud & Troian (1998) andFoda & Cox (1980) that expression (1) gives a good description of the SFspreading of various substances under laboratory conditions. The valuesof usp shown in Figures 6 and 7 were averaged over the duration of eachmeasurement. To compare our data with model (2) the value of u0sp wascalculated in the temporal interval from 200 sec to 3600 sec.Let us now consider the spreading of a vegetable oil film on the seasurface at a weak wind speed. As can be seen from Figure 4, the spreadingof slicks at weak wind speeds (symbols ( ) in Figure 4) in fact obeys
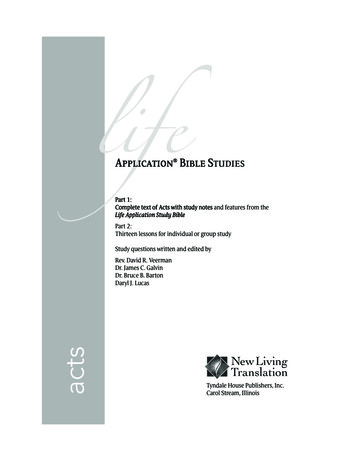
472A. E. Korinenko, V. V. Malinovskythe law R(t) t3/4 and S(t) t3/2 over a significant time interval. Theessential difference between the model and experimental data is observedafter sufficiently long times. As indicated in Boniewicz-Szmyt & Pogorzelski(2008) surfactant adsorption at the air-water and oil-water interfaces couldbe a possible mechanism for the difference between lens expansion rates ofthe field data and the classical tension-gradient-driven spreading theory.Under calm winds the ratio L/l is close to unity (see Figure 5), i.e. theslick is practically round for the duration of the measurement. Thus thedynamics of SF in natural conditions at weak wind speeds is practicallycompletely defined by the spreading coefficient.At present the problem of the influence of waves and wind on thespreading of surface films is insufficiently studied.Below we will analyse one specific case observed in the experiment inmore detail in order to obtain accurate information about the impact ofswell on surface film dynamics.This case, dated 7 July 2005, was characterised by a stable moderatewind (9 m s 1 ) blowing until 11:00 hrs, as shown in Figure 8a. Between11:00 and 11:40 hrs the wind abated to 1.6 m s 1 . Surface film spreadingwas recorded from 11:50 to 12:20 hrs. The observation interval is shown bythe arrows in Figure 8a.1.010ab0.1S(f) [m2 s]U [m s-1]8640.010.00120.0001081012daytime [hrs]14160.11.0f [Hz]Figure 8. Hydrometeorological parameters from 7 July 2005: a) – wind speed;b) – wind wave frequency spectrum measured during the experiment setupThe wave spectra S(f ) measured from 10:00 to 11:00 hrs and from 11:50to 12:20 hrs are shown in Figure 8b by solid and dashed lines respectively.It can be seen from Figure 8b that the levels of both spectra lie within thefrequency range shown. The significant wave heights before and during theexperiment were 0.64 and 0.62 m respectively.
Field study of film spreading on a sea surface473distance [m]Thus, the measured value of the SF spreading rate shown in Figure 7with symbol ( ) was obtained practically in the absence of any wind butin the presence of swell. However, the values of both L/l 0.9 and udsp 0.017 m s 1 are typical of calm conditions. Moreover, in this case udsp isclose to the model value of u0sp 0.025 m s 1 , when the spreading rateis defined only by the spreading coefficients. The fact that the slick shapeis nearly circular during the above measurement is confirmed by Figure 9.This shows a photograph of the sea surface, converted into the horizontalCartesian coordinate system, obtained 2100 sec after the spill. The locationof the slick in Figure 9 is indicated by the arrow.distance [m]Figure 9. The photographs of the sea surface from 7 July 2005 converted into thehorizontal Cartesian coordinate system. The arrow indicates the film slick 2100 safter the spillageWe estimated the wind wave action on SF spreading using frequencyspectra at f 1 Hz. The calculation of S(f ) at f 1 Hz is not correctowing to the distortion associated with short-wave advection in the fieldof long-wave orbital velocities. The influence of the high-frequency part ofS(f ) on SF spreading will require further study.4. ConclusionThe investigations of the dynamics of a vegetable oil film on thesea surface were carried out in the vicinity of the Marine HydrophysicalInstitute’s research platform (off the southern coast of Crimea, 44 23′ 35′′ N,33 59′ 4′′ E) under a wide range of wind speeds and wave conditions. Slicksizes were estimated from photographic images of the sea surface coveredby the surface film.
474A. E. Korinenko, V. V. MalinovskyAnalysis of the experimental results showed that the behaviour of thesurface film varies, depending on the wind conditions. Film spots tendedto become elongate in the direction of the wind flow, taking the form ofan ellipse. The rate of semi-major axis growth increases from 0.039 to0.145 m s 1 when U increases from 6.3 to 11.7 m s 1 . In the experimentscarried out at wind speeds less than 4 m s 1 and a significant timeinterval, the law L t3/4 was obeyed. According to Fay’s classificationthis corresponds to the spreading mode of the dominant forces of surfacetension.The experimental results show the absence of an explicit dependence ofsignificant wave height from 0.15 to 1.03 m on film spreading rate.The values of the spreading rates obtained at a weak wind of 1.6 m s 1but different values of the significant wave heights (Hs 0.62 and Hs 0.15 m) are practically the same.AcknowledgementsThe research leading to these results received funding from the European Community’s Seventh Framework Programme (FP7/2007-2013) underGrant Agreement No. 287844 for the project ‘Towards Coast to CoastNETworks of marine protected areas (from the shore to the high and deepsea), coupled with sea-based wind energy potential (CoCoNET)’. Financialsupport was also re-ceived from IFREMER (Contracts Nos. 2011 2 20712376and 2012 2 20712805 between IFREMER and Small enterprise DVS LTD).ReferencesBendat J. S., Piersol A. G., 1999, Random data analysis and measurementprocedures, Wiley, New York, 594 pp.Boniewicz-Szmyt K., Pogorzelski S. J., 2008, Crude oil derivatives on sea water:signatures of spreading dynamics, J. Marine Syst., 74 (Supp.), 41–51, ckmaster J., 1973, Viscous-gravity spreading of an oil slick, J. Fluid Mech.,59 (3), 481–491, http://dx.doi.org/10.1017/S0022112073001667.Camp D. W., Berg J. C., 1987, The spreading of oil on the water in the surface-tension regime, J. Fluid Mech., 184, 445–462, d A. D., Troian S. M., 1998, Dynamics of spontaneous spreading withevaporation on a deep fluid layer, Phys. Fluids, 10 (1), 23–38, http://dx.doi.org/10.1063/1.869546.Elliott A. J., 1986, Shear diffusion and the spread of oil in the surface layers of theNorth Sea, Ocean Dynam., 39 (3), 113–137.
Field study of film spreading on a sea surface475Fay J. A., 1969, The spread of oil slicks on a calm sea, [in:] Oil on the sea, D. Hoult(ed.), Plenum, New York, 114 pp.Foda M., Cox R. G., 1980, The spreading of thin liquid films on a waterair interface, J. Fluid Mech., 101, 33–51, http://dx.doi.org/10.1017/S0022112080001516.Hoult D., 1972, Oil spreading on the sea, Annu. Rev. Fluid Mech., 4, 010172.002013.Large W. G., Pond S., 1981, Open ocean momentum flux measurements in moderateto strong winds, J. Phys. Oceanogr., 11 (3), 324–336, http://dx.doi.org/10.1175/1520-0485(1981)011 0324:OOMFMI 2.0.CO;2.Lehr W. J., Cekirge H. M., Fraga R. J., Belen M. S., 1984a, Empirical studies of thespreading of oil spills, Oil Petrochem. Pollut., 2 (1), 7–12, hr W. J., Fraga R. J., Belen M. S., Cekirge H. M., 1984b, A new techniqueto estimate initial spill size using a modified Fay-type spreading formula,Mar. Pollut. Bull., 15 (9), 326–329, llips W. R. C., 1997, On the spreading radius of surface tension driven oilon deep water, Appl. Sci. Res., 57 (1), 67–80, http://dx.doi.org/10.1007/BF02528764.Svitova T. F., Hill R. M., Radke C. J., 1999, Spreading of aqueous dimethyldidodecylammonium bromide surfactant droplets over liquid hydrocarbon substrates, Langmuir, 15 (21), 7392–7402, http://dx.doi.org/10.1021/la981683n.
AleksandrE.Korinenko1, VladimirV.Malinovsky1,2 1 Marine Hydrophysical Institute of the NAS of Ukraine, Kapitanskaya 2, Sevastopol 299011, Ukraine; e-mail: korinenko.alex@gmail.com corresponding author 2 Small Enterprise DVS LTD, Kapitanskaya 4, Sevastopol 299011, Ukraine 31March2014. Abstract