Transcription
Endorsed byUniversity of Cambridge International ExaminationsEconomicsRobert DransfieldTerry CookJane KingforIGCSESamplepagesSample
IntroductionNelson Thornes are proud to present you with a sample section of our new title, Economicsfor IGCSE. Economics for IGCSE has been endorsed by University of Cambridge InternationalExaminations.This completely new text follows on from our Cambridge endorsed Business Studies for IGCSEand the Science series, using all of the best features while catering for the specific requirementsof international schools following the Cambridge 0455 Economics syllabus. Having been plannedand reviewed by Cambridge IGCSE Principal and Senior Examiners, the content is presented in aclear, concise visual manner.Key features of Nelson Thornes Economics for IGCSEDouble-page spread featuresǦ Learning outcomes are clearly stated at the start of each spread.Ǧ Exam Tips – notes written by Cambridge IGCSE Principal and Senior Examiners to help studentsovercome common errors and misconceptions.Ǧ Did you know? – features that use contexts relevant to international school students.Ǧ Practical Activities allow students to take an active approach to the study of Economics.Ǧ Case Studies – accompanied by questions, these short contextualised scenarios are directly linked totopics in the text to improve understanding. Additional, longer case studies are also provided at the endof the book.Ǧ Summary questions – test and consolidate students’ learning.Ǧ Key points at the end of the spread relate directly to the learning objectives and highlight the keyinformation students need to understand.Ǧ Content is supplemented by tables and diagrams that present information in a visual manner.Additional book featuresǦ End-of-unit question spreads – Each chapter concludes with a double page spread of questions,consisting of a balance exam-style questions from each paper. These have been written by CambridgeIGCSE Principal and Senior Examiners.Ǧ Glossary of command terms to help students familiarise themselves with terms they will meet in theexams.Ǧ Glossary of terms provides clear definitions for students.Ǧ Fully indexed to help navigate the textAuthor credentialsRob Dransfield has taught Business Studies in schools, further education colleges anduniversities. He currently works at Nottingham Trent University where his role involves teachertraining. He has written many Business Studies books and has contributed to both conferencesand journals in areas related to business education.Terry Cook has been an examiner with the University of Cambridge since 1979 and is currentlya Principal Examiner in IGCSE Economics Papers 2 & 3. He has been involved in the IGCSEqualification since its introduction in 1988. Terry has run training courses for Cambridge in IGCSE,O Level and A Level Economics all over the world as well as remotely through the internet. He hasrecently assumed responsibility for the coordination of the CIE Economics Discussion Forum.Jane King has over 16 years’ experience as a teacher of Business Studies and Economics and iscurrently head of Business Studies and Economics at an independent girls’ school. She is a SeniorExaminer with extensive experience on both the Cambridge IGCSE and A Level Business Studiespapers. Jane has travelled worldwide undertaking consultancy work for Cambridge. Experiences incountries as diverse as Zambia, Pakistan and the Maldives, have contributed to the materials forBusiness Studies for IGCSE.i
ContentsHow to use the practice exam questions ivUnit 1 The basic economic problem:choice and the allocationof resourcesUnit introduction1.1 The economic problem1.2 Factors of production1.3 Opportunity cost1.4 Opportunity cost in actionPractice exam questionsUnit 2 Allocating resources: the marketat work and market failureUnit introduction2.1 Allocating resources in an economy2.2 Demand2.3 Supply2.4 Equilibrium price2.5 Causes of changes in demand andthe effect on the market2.6 Causes of changes in supply andthe effect on the market2.7 Price elasticity of demand2.8 Price elasticity of supply2.9 Usefulness of price elasticityof demand2.10 Merits of the market system2.11 Market failure2.12 Private and social costs and benefits2.13 Conflict between private and socialinterestsPractice exam questionsUnit 3 The individual as producer,consumer and borrowerUnit introduction3.1 The functions of money3.2 Commercial banks3.3 Central banks3.4 Stock exchanges3.5 Choice of occupation3.6 Changes in earnings over time foran individual3.7 Differences in earnings betweenoccupations 1Differences in earnings betweenoccupations 23.8 Trade unions3.9 84043444648505254565860623.10 Motives for spending, saving andborrowing3.11 Income and expenditure patternsPractice exam questionsUnit 4 The private firmUnit introduction4.1 Sole proprietors and partnerships4.2 Private companies4.3 Public companies4.4 Multinationals4.5 Cooperatives4.6 Public corporations4.7 Effects of changes on businessgrowth4.8 The demand for factorsof production4.9 Fixed and variable costs4.10 Total and average costs4.11 Output and costs4.12 Total and average revenue4.13 Profit maximisation4.14 Price and output in perfectcompetition4.15 Pricing and output policiesin monopoly4.16 Different sizes of firms4.17 Different forms of integration4.18 Economies and diseconomies of scale4.19 Advantages and disadvantagesof monopolyPractice exam questionsUnit 5 The role of government in aneconomyUnit introduction5.1 The government as a producerand employer5.2 Government policy: full employment5.3 Government policy: price stability5.4 Government policy: economic growth5.5 Government policy: redistributionof income5.6 Government policy: balance ofpayments stability5.7 Conflicts between government aims5.8 Types of taxation5.9 Government influence on privateproducers: 02104106108110113114116118120122124126128130
Contents5.10 Government influence on privateproducers: subsidy5.11 Government influence on privateproducers: taxesPractice exam questionsUnit 6 Economic indicatorsUnit introduction6.1 The Retail Price Index6.2 Causes of inflation6.3 Consequences of inflation6.4 Patterns and levels of employment6.5 Causes of unemployment6.6 Consequences of unemployment6.7 Gross Domestic Product6.8 Comparing living standardsPractice exam questionsUnit 7 Developed and developingeconomiesUnit introduction7.1 What is development?7.2 Policies to reduce poverty7.3 Factors that affect populationgrowth7.4 Reasons for different rates ofpopulation growth7.5 Problems of population 61681701721747.6 The effect of changing size ofpopulation on an economy1767.7 Changes in population structure and itseffect on an economy1787.8 Living standards 1: differenceswithin countries180Living standards 2: differencesbetween countries182Practice exam questions184Unit 8 International aspectsUnit introduction8.1 Benefits and disadvantages ofspecialisation8.2 The current account of thebalance of payments8.3 Exchange rates8.4 Causes of exchange ratefluctuations8.5 Consequences of exchangerate fluctuations8.6 Methods of protection8.7 The merits of free trade8.8 The merits of protectionPractice exam Index210iii
6 Economic indicatorsUnit 6 explains how economic indicators provide good measures ofmajor changes taking place in economies, showing how quickly aneconomy is growing and indicating possible problems, such as risingprices and unemployment.The unit explains how indicators such as the Retail Price Index areused to decide policies, such as setting the rate of interest, andpoints out that businesses and trade unions use these as a basis forsetting wage increases. Reference is made to charts that show howgovernments use indicators, such as numbers employed, as a basisfor devising policies that will attempt to create jobs.The material in Unit 6 also shows how some indicators, such as GrossDomestic Product and the Human Development Index, move in thesame direction as the economy, while others, such as unemployment,move in the opposite direction to the economy.LEARNING OUTCOMESWith regard to prices, candidates should be able to: describe how the Retail Price Index is calculated discuss causes and consequences of inflation.With regard to employment, candidates should be able to: describe changing patterns and levels of employment discuss causes and consequences of unemployment.With regard to output, candidates should be able to: define Gross Domestic Product (GDP) describe simple measures and indicators of comparativeliving standards, such as GDP per head, and the HumanDevelopment Index (HDI).139
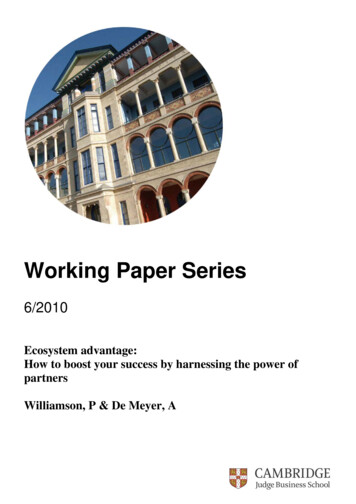
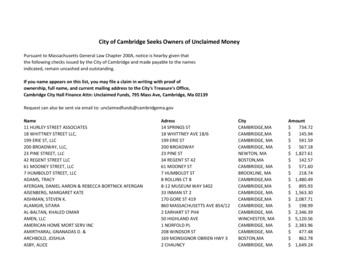
6.1LEARNING OUTCOMESWith regard to prices,candidates should be able to: describe how the Retail PriceIndex is calculated.The Retail Price IndexAverage prices are measured by governments using the RetailPrice Index (RPI) or the Consumer Price Index (CPI). This indexmeasures changes in average prices over a year. Measurements aremade by recording prices of goods and services that most peoplewill be expected to buy, or put in an imaginary shopping basket.Government statisticians decide what goods to include in thisbasket. This list should be updated to take account of changingspending patterns.Most governments measure prices in similar ways. This unit usesthe example of Kenya. The examples show some of the difficultiesinvolved in accurately measuring average price changes.A basket of goodsThe imaginary shopping basket for a typical family in Kenya contains,for example, milk, bottled water, sugar, tea, meat, cooking fuel,school books and mobile phone charges. The contents included inthe basket are fixed in the short term, but the prices of individualgoods change.Shopping in a supermarket in Kenya. TheConsumer Price Index (CPI) measures generalincreases in the prices of a basket of goods.Changes in food prices are particularlyimportant in Kenya as this is the largest itemof household expenditure (and how theseprices change over time).DID YOU KNOW?Food prices (especially forrice, maize, flour and coffee)have a prominent weightingin the price index in Kenya.When they rise, this will havea major impact on inflation asmeasured by the price index.140Figure 6.1.1A helpful way of thinking about the price index is to imagine thecontents of a shopping basket bought by a typical household
A price index uses a single number to indicate changes in prices of anumber of different goods. This is calculated by comparing the price ofbuying the basket of goods with a starting period, called the base year.The base year is given a figure of 100. So if the average price of goods inthe basket today is 10 per cent higher than the base year, the price indexwill be 110. Changes in average prices (the cost of the basket of goods)can be measured on a monthly, quarterly or annual basis.InflationInflation is a persistent or sustained rise in the general level of pricesover a period of time. So not every price will rise, but average priceswill. The effect of this rise on ordinary people will vary, depending onwhat they buy.Price inflation in Kenya is measured by the Kenya National Bureau ofStatistics (KNBS). One of its responsibilities is to decide on the 221 goodsand services to be included in the price index, or ‘basket’. The selectionis made after carrying out a survey of spending patterns – that is, whatmost people in Kenya are buying. From time to time the items in thebasket will change: in 2010 the basket was ‘widened’ to include internetcharges, computers and primary and secondary school transport fees.Statistics covering the prices of all items in the CPI are gathered eachmonth in 10 areas of the capital, Nairobi, and 15 other price collectionzones across Kenya selected for their high expenditure levels.WeightingThe weighting is a figure given to a category of goods according tothe percentage of a typical household’s income that is spent on it.Statisticians have found that typical families in Kenya spend 40 percent of their income on food, so this is given a weighting of 40 percent in the price index.CASE STUDYEXAM TIPThe examination mayrequire you to defineinflation, so make sureyou are able to givea full and accuratedefinition.DID YOU KNOW?The ‘average annual’ rate ofinflation is computed as apercentage change of a twelvemonth average of the CPI. The‘year-on-year’ inflation rateis calculated as a percentagechange of the CPI between thecurrent month (e.g. April 2011)and the same month a yearago (e.g. April 2010).Rising inflation in KenyaIn 2008, inflation rose sharply in Kenya, largely as a result of risingfood prices. The overall annual average inflation was 26.2 per cent,compared to 9.8 per cent in 2007. The main causes of this were: an increase in average food prices of 37.5 per cent an increase in average oil prices of 18 per cent.Questions1 What effect do you think that a rate of inflation of 26.2 percent is likely to have on people in Kenya?2 Why do you think that changes in food prices are soimportant to people living in Kenya?3 Are some Kenyans likely to have been more affected thanothers by the high inflation figure? Explain how.4 Suggest a way of measuring inflation in Kenya.DID YOU KNOW?From time to time, weightingof items in the basket needsto be adjusted. For example,more frequent use of mobilephones in Kenya between1993–4 and 2005–6 meantthat the weight attached tospending on mobile phone usewas increased from 5.75 to12.7 per cent.141
Calculating average price changesCalculating average price changes will give the rate of inflation. Thecalculation involves two sets of data: The price data (collected each month). The weights (representing patterns of spending, updated eachyear).CategoryPercentage eholdgoods30310010TotalThe weighting for food is twice that forclothing because typical households spendtwice as much on food as on clothesWith this data it is possible to construct a weighted price index.A consumer spending survey has been carried out that shows thepercentage spend of typical households in an imaginary country. Thetable on the left shows how the percentage spend forms the basis ofthe weighting given to the categories.The next stage is to identify price changes in each of these productcategories. Let us suppose that surveys carried out in supermarkets,shops and other retail outlets across the country show the followingchanges since the base year: Food prices have increased by 20 per cent. Clothing has increased by 10 per cent. Transport has fallen by 10 per cent. Other household goods have increased by 30 per cent.To find out the average change in price we need to take accountof each of these price changes in terms of how much consumersspend on that item (the weight). For example, the increase in foodprices of 20 per cent will have a major impact on average pricesbecause 40 per cent of household income is spent on food. Incontrast, even though transport prices have fallen by 10 per cent, thiswill have a smaller impact on average prices because consumers onlyspend a tenth of their income on transport.EXAM TIPMake sure youunderstand thisdifference: the priceindex shows how muchthe price of that itemhas risen by comparedwith a base year of 100;the weighted price indexshows the price indextimes the weight attachedto the product category.To create a weighted price index we need to multiply the weightfor each item by the price index for that item. This is shown in thetable below.Product categoryWeight price indexWeighted price indexFood4 120 480Clothing2 110 220Transport1 90 Other goods3 130 390Total901180Finally, divide the weighted price index by the total number ofweights:1180 11810This shows that prices have risen on average by 18 per cent (i.e. fromthe base year figure of 100 to 118 in the new year).142
Problems involved in using a price indexThe price index is designed to show general increases in prices andhow they affect consumers. There can be some problems, however,with its use as an indicator: The index does not necessarily show how price changes affecttypical consumers. For example, in Kenya the weighting attachedto food in the index was reduced from 50 per cent to 40 per cent.However, food purchases for a poor person in Kenya may make up80 per cent or more of their spending. The index makes comparisons with a base year. However, if priceswere low at the base year, the comparison may exaggerate theprice rise. If prices were high at the base year, the index comparisonmay suggest that subsequent price changes have been low(especially if the base year is at the top or bottom of the trade cyclefluctuation). Some items, for example fuel and food, are subject to quite a lot ofvariation.DID YOU KNOW?In Kenya separate indexes arecalculated for low-incomehouseholds and medium- tohigh-income households inrecognition of the way thatthey purchase different basketsof goods each week.For indicators to provide useful information, it is essential that thestatistics gathered are accurate.ACTIVITYKEY POINTSWorking in a group, find out the monthly inflation rate of yourcountry, or a large country in your part of the world. You shouldfind this information published each month by your nationalstatistical office. With your teacher’s help, try to find the rateon the internet or in a national newspaper. Plot the current rateon a large chart and display this in your classroom to monitorongoing changes. Then try to find the inflation rate of anothercountry and compare it with your own.1 Inflation is a persistent orsustained rise in the generallevel of prices over a periodof time.SUMMARY QUESTIONS1 What items are likely to be included in a basket of goodsbought by a typical consumer in your country? Whichcategories of items should be given the greatest weights?2 What two sets of data are required to calculate a CPI?3 Why is it necessary periodically to alter the list of itemsincluded in a country’s ‘shopping basket’ of items included inthe CPI?2 A price index can be used tomeasure price increases byreducing prices to a singlenumber starting at 100 in abase year.3 The price index measureschanges in an averagebasket of goods bought by atypical consumer or family.4 Weighting items in thebasket makes it possible totake account of the relativeimportance of spendingon different items whenmeasuring average pricechanges.143
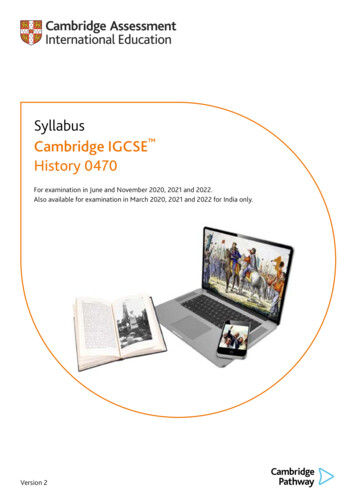
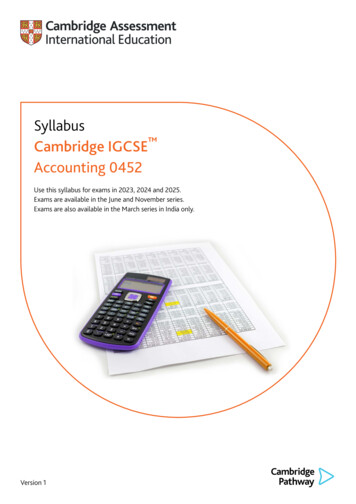
6.2Causes of inflationLEARNING OUTCOMESCauses of inflationWith regard to prices,candidates should be able to:A cause is a factor that has an effect on something else. For example,a cause of inflation might be that people increase the amount ofmoney they spend. The effect might be an increase in prices. discuss causes of inflation.Inflation is usually the result of a number of causes. It may occurwhen a number of prices rise at the same time, say for oil, food andhousing or rented accommodation.In examining inflation, economists distinguish between cost-pushand demand-pull factors. These are explained below.Cost-push factorsCost-push refers to the costs that a business has to meet, such as wagesand raw materials. As costs rise, the business will often pass these on toconsumers by increasing the prices for the product they are selling.Food costsRising oil and energy costs are a major causeof cost-push inflation that affects manybusinesses across an economyIn the previous Unit we saw that 40 per cent of the weighting inKenya’s Consumer Price Index (CPI) is allocated to food. In the years2000–10 the food supply in Kenya has been badly affected bydroughts in the north of the country.At the same time, the price of basic foodstuffs, including the priceof cereal crops on global markets, has been increasing. There isincreased competition for cereal crops as a result of the growth ofhuge economies like China and India, and also as a result of cerealsbeing used as alternative biofuels. Whatever the cause, high foodprices lead to higher costs for other businesses.Raw material costsDespite the world recession in 2008 and 2009, the costs of rawmaterials such as steel, copper, oil and gas have risen. These rawmaterials are at the centre of modern economies, so as their pricesrise, there is an effect on many other prices.EXAM TIPIn the examination,you need to show thatyou understand thatinflation can be theresult of more than onecause.Wage costsWage costs are another major cause of cost-push inflation. Iffood and fuel prices rise for workers in Kenya, they will press theiremployers for higher wages. If, however, the wage increase is notmatched by higher labour productivity, in other words, if the workersdo not produce more goods to sell, production costs will rise.Land costsLand prices in many countries have risen as land is used moreintensively. For example, the Ethiopian government has granted144
long-term leases to overseas companies to use land for largescale agricultural production of grain and other crops. Land isalso increasingly being used for housing as the world populationincreases. This leads to land price inflation.Exchange rate costsChanges in the exchange rate between currencies can have a majorimpact on business costs. For example, if the Kenyan Shilling (KES)loses value against the South African Rand (ZAR), people will have topay more for imported goods, oil and food from South Africa.Demand-pull inflationDemand-pull inflation occurs when rising demand pushes up theprice of goods. This happens when people have more to spend.This is most likely when an economy is near to full employment.Businesses compete for resources and this will lead to a rise in prices.CASE STUDYMonetary inflationMonetary inflation provides a good explanation of demand-pullinflation. It illustrates clearly the impact of economic indicatorson the economy.The idea of monetary inflation is not new. One of the bestexplanations was provided by the American economist MiltonFriedman in the book he wrote with Anna Schwartz, A MonetaryHistory of the United States, 1867–1960, published in 1971.Friedman and Schwartz argued that if governments increase thequantity of money, there is more to spend on new goods. If,however, there are not enough goods being produced for thepeople who want to buy them, manufacturers will be able toput up prices. The authors concluded that price levels are linkedto the quantity of money available. In their words, ‘inflation isalways and everywhere a monetary phenomenon.’This work was published in 1971 and became a model of goodpractice in using detailed statistical analysis over a long period(in this case in the US) to make the link between prices and thequantity of money.Questions1 What connection did Friedman and Schwartz identify betweenthe quantity of money and the level of prices?2 What statistics did the authors study and use to make theirclaim?3 How can monetary inflation also be described as demand-pullinflation?4 With what economic indicators was Milton Friedman primarilyconcerned?KEY POINTS1 Causes of inflation can besplit into cost-push anddemand-pull factors.2 Rising costs includeagricultural prices, rawmaterial costs, labour costsand weakening exchangerates.3 Demand-pull occurs whendemand increases and isusually associated withmonetary inflation.SUMMARY QUESTIONS1 Define cost-push inflation,explaining one type of costpush inflation.2 How is an increase in thequantity of money in theeconomy likely to affect pricelevels?3 When the exchange valueof a country’s currency falls,how is this likely to impacton import prices?145
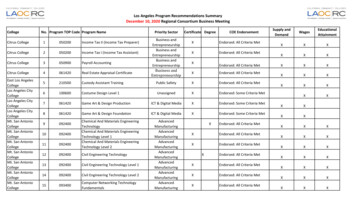
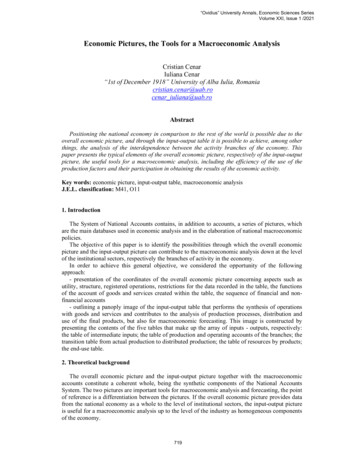
6.3LEARNING OUTCOMESWith regard to prices,candidates should be able to: discuss consequences ofinflation.Consequencesof inflationInflation is a sustained rise in the general level of prices. Mildinflation of one or two per cent is not particularly harmful because itencourages producers to supply more to the market. When inflationrises more quickly it can disrupt economic decision-making becauseit becomes difficult for businesses, governments and even ordinarypeople to make plans. Inflation results in a loss of value of units ofcurrency. The reverse of inflation is deflation, when prices start tofall. Deflation (negative inflation) discourages businesses, who mayrestrict supply to markets.There are many historical examples of rapid inflation. When pricesrise rapidly governments are often tempted to print more money.Where the quantity of money increases, people lose confidence init and businesses push up prices because they see money as beingless valuable. The government is forced to print more money, butit becomes worthless. In the first decade of the 21st century, thegovernment of Zimbabwe printed so much money that citizensstarted exchanging goods and services rather than use money tomake payments.The table below shows how inflation affects people in differentcircumstances.Maize grain is a major staple food in manycountries. An increase in the price of maizeand other food staples can have a majorimpact on the livelihoods of the poorermembers of societyIncome levelEffect of inflationLow incomeThey can afford fewer goods, including basicnecessities. People resort to buying the lowestpriced products available.Fixed income There is a fall in real income (what can be affordedwith money coming in). Because money loses value,people on fixed incomes save less and spend more.High incomeDID YOU KNOW?Deflation can be as harmfulas rapidly rising prices. Whenprices are falling businessincome from sales falls.Businesses become reluctantto invest and they reduce thenumbers of employees.146There is less income to spend on some luxury items.People may, therefore, switch to cheaper alternativesand cut back on some extravagant purchases. Theymay save less and spend more.Who loses out in a period of inflation?The poorPoor people are the first to suffer in times of inflation. For example,in Kenya, an important part of people’s diet is maize grain. In recentyears there have been several droughts, reducing the supply, and soraising the price of maize. Drought has hit Kenya every two or threeyears and this has forced the country to buy expensive imports tomeet its people’s needs. This has pushed up inflation.
People on fixed incomesPeople on fixed incomes are those whose incomes remain the same, ornearly the same, during periods of inflation. They may be poorly paidworkers who are not in a trade union, or pensioners. Workers who areunskilled and so have less bargaining power, such as office cleanersand car park attendants, also suffer in times of inflation. Skilled workersin well-paid jobs may be able to bargain with their employers to receivewage increases. This is often the case for people who work for thegovernment: civil servants, teachers, the police and armed forces.SaversMany people like to save some money each month for future needs.Their savings may be deposited in a bank or kept in a safe place.However, during a period of inflation savings lose their value. Whenthe money comes to be spent it is not worth as much as when it wasfirst saved. Similarly, money saved in a pension scheme can lose valueby the time the saver becomes old enough to draw on it.BusinessesA lot of business activity involves supplying goods on credit, perhapsto other businesses. Payment may be required one month, threemonths or six months later. When money starts to lose value quickly,businesses become reluctant to supply on credit. Therefore, inflationis very harmful to business activity.In contrast, people who borrow money in a period of inflationare likely to gain. When they come to pay back the sum they haveborrowed, the value of their repayment will have fallen.Mild inflationAs mentioned above, a small level of inflation is not necessarily abad thing. Gently rising prices encourage businesses to supply moreto the market and help to increase profits. In fact Milton Friedmanargued that the government should increase the quantity of money.However, this should be done in a planned way that anticipatesgrowth in production in the economy.DeflationDeflation refers to a general fall in the level of prices. Typically, thiswill occur when there is a general fall in demand for goods – forexample, if people are spending less through uncertainties overrising unemployment. This is likely to be harmful to the economy asbusinesses will start to lay off workers and reduce levels of production.ACTIVITYArgentina and Turkey have both experienced rapid inflation.Carry out some internet research to find out when these periodsof inflation occurred and how the governments in the twocountries managed to stabilise prices. Try to find out whatcaused the inflation in these countries.EXAM TIPMake it clear in theexamination thatyou understand thatinflation can havevarying effects ondifferent groups of peoplein an economy.KEY POINTS1 In a period of inflation theeconomy becomes lessstable. Groups such as thepoor and those on fixedincomes suffer most.2 Rapidly rising prices canquickly destroy businessconfidence and thewillingness of businesspeople to supply goods oncredit.3 A mild level of inflation canhave a positive effect onbusiness confidence.SUMMARY QUESTIONS1 Which two of the followinggroups would suffer least ina period of high inflation?Savers, pensioners, poorhouseholds, employeeswhose skills are in greatdemand, borrowers, or thegovernment? Explain youranswers.2 Explain why a period of verymild inflation may not beharmful for an economy.3 Explain why high inflationcan be damaging for longterm business planning.147
6.4Patterns and levelsof employmentLEARNING OUTCOMESEmploymentWith regard to employment,candidates should be able to:Employment is the work that people do in an economy. Over time,patterns of employment change: some industries go into decline andjobs disappear while new types of industries and jobs develop. describe changing
iii Contents 5.10 Government infl uence on private producers: subsidy 132 5.11 Government infl uence on private producers: taxes 134 Practice exam questions 136 Unit 6 Economic indicators Unit introduction 139 6.1 The Retail Price Index 140 6.2 Causes of infl ation 144 6.3 Consequences of infl ation 146 6.4 Patterns and levels of employment 148 6.5 Causes of unemployment 152