Transcription
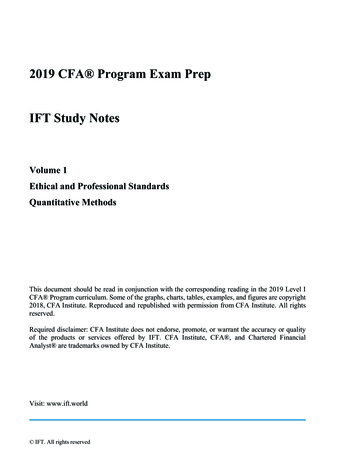
2020Criticalconceptsfor theCFA EXAMCFA EXAM REVIEWWiley’s CFAProgram Level ISmartsheets Fundamentals For CFA Exam SuccessWCID184
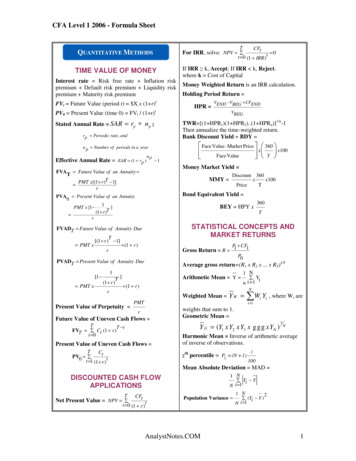
ExpectedReturnoutcome is1/6. on a PortfolioWiley’s CFA Program Exam Review The Time Value of moneyThe Time Value of moneyThe Time Value of moneyEffective Annual RatesEffective Annual RatesQMThe TimeTime ValueValue ofof MoneyMoneyTheQMEAR (1 Periodic interest rate) N 1EAR (1 Periodic interest rate) N 1The Time Value of MoneyThe Continuous Uniform DistributionThe Continuous NUniform DistributionE(R ) wi E(R i ) w1E(R1 ) w 2 E(R 2 ) w N E(R N )A continuousp uniformdistribution is described by a lower limit, a, and an upper limit, b.i 1Acontinuousuniformdistributionis ofdescribedby a lowerlimit,a, and anlimit, b.Theselimits serveas theparametersthe distribution.Theprobabilityofupperany outcomeTheselimitsserveastheparametersof theisdistribution.The probabilityof any outcomeor range of outcomes outsidethis interval0. Being a continuousdistribution,individualwhere:orrange ofalsooutcomesthis ofinterval0. Being a continuousdistribution,individualoutcomeshave a outsideprobability0. Theisdistributionis often denotedas U(a,b).Market value of investment ioutcomesalso haveWeight of asseti a probability of 0. The distribution is often denoted as U(a,b).value of portfolioThe probability thatMarketthe randomvariable will take a value that falls between x1 and x2, thatThethatrange,the randomwill take ofa valuethatareafallstakenbetweenx1 theandrange,x2, thatbothprobabilitylie within thea to b, variableis the proportionthe totalup byboththe range, a to b, is the proportion of the total area taken up by the range, pRobabiliTx1 to liex2.withinPortfolioVarianceQUANTITATIVE METHODSx1 to x2.The Future Value of a Single Cash FlowThe Future Value of a Single Cash FlowN NEffective Annual Rates– x1 ,R )ExpectedVar(RReturn on a Portfoliowxw2 Cov(RN ijP (x1 p )X xreturn ExpectedonFVN PV (1 r) N2 ) ix j –x a portfolioFVNPVvalue(1 r)of the middle item of a data set once it has been sorted into anP (x1 XN i x1 2j )1 2b-a 1The medianis theNEAR (1 Periodic interest rate) 1b-aThePresentValueof a The advantageof using the median is that, unlike the mean,E(R p ) wi E(R i ) w1E(R1 ) w2 E(R 2 ) w N E(R N )ThePresentof a SingleFlowVariance of a 2 AssetPortfolioit is not sensitive to extreme values. However, the median does not use all the informationi 1 3 x) is the same as P(X x) or this distribution because it is aRemember that P(XFVof a Single Cash FlowThe Future ValueFVmagnitudePV andabout thePVsizeoftheobservationsand only focuses on their relativeRememberpositions. thatis the same x)zero.or this distribution because it is aP(X 3 x)wherecontinuousdistributionP(X asx)P(XequalsN (1 r) N2 22where: r)(1 r) N(Rw2B σ (R Bequals) 2w zero.continuousdistributionwherex)p ) wofA σaA ) P(XA w B Cov(R A ,R B )FV (1PV Var(RVariance2-assetportfolioETHICAL ANDQUANTITATIVE METHODSPROFESSIONAL STANDARDS Time Value of MoneyEthics in the Investment Profession Presentvalue (PV) and future value (FV) of a single cashNThe mode of a data set is simply its most frequently occurring value. A data set THODSvalue of investment iThe Presentand Future Value of an Ordinary AnnuityflowWeight ThePresentandValueCashof anOrdinaryAnnuityone modeis Valuesaid Futuretoofbea unimodal,whileone thathas two modes is said to be bimodal.It of asset iDistributionThe BinomialThePresentSingleFlow2 22 portfolio2value ofVar(R p ) wMarketA σ (R A ) w B σ (R B ) 2w A w Bρ(R A ,R B )σ (R A )σ (R B )is also ifferentandnovalueAbinomialrandomvariableis the number of successes (X) from a Bernoulli trial that isPVAnnuityFV: # periods N; % interest per period I/Y; amount FV or amount PMT PVsituational influences, focusing on the immediate ratheroccurs morePVAnnuity: # periodsN; others.% interestperiod I/Y;amountFV or intervalamount PMT intervalPVbinomial random variable is the number of successes (X) from a Bernoulli trial that isthanForpergroupeddata,the modalis theAPV entis an experiment that has only 2 oramountPMT FVFVAnnuityTheis (1thevalueof N;theofonlya datasetonceofFVitcentralhasbeensortedan :frequency.Varianceof “n”a 3 ntor amountPMT into FVthan long-term medianthe FVhighestThemodeitemismeasuretendencythatcan beoutcarriedtimes.PortfolioA Bernoulli experiment is an experiment that has only 2 possible Challenges to ethical behavior: overconfidenceQUANTITATIVEbias,METHODS General ethical decision-making framework: identify,consider, decide and act, reflect. CFA Institute Professional Conduct Program sanctions:public censure, suspension of membership and use ofthe CFA designation, and revocation of the CFA charter(but no monetary fine).Standards of Professional ConductI.II.III.IV.ProfessionalismStatistical ConceptsQMA.Knowledge of the LawB.Independence and ence(highest)between the highest and lowest values in a data set.Important RelationshipstheValuesArithmetic Mean and Geometric MeanContinuousCompounding Betweenand FutureMaterial Nonpublic InformationB.Market ManipulationLoyalty, Prudence, and CareB.Fair DealingC.SuitabilityD.Performance PresentationE.Preservation of ConfidentialityDuties to EmployersA.nA n!BABBC Cov(R B ,R C ) 2w C w A Cov(R C ,R A )scommon pRobabiliTy Dis 99% ofn!allobservations lie in the interval µ 2.58σn is used in the investment management arena to determine theThe harmonic meanaverageRoy’sSafety‐FirstCriterionPr etween38( n r )!is ways Xmean:cost of sharespurchasedtime.maybe viewedMeanasthea c03.inddspecialtype costof weightedHarmonicusedItthetodetermineaverageof Themeani over nA ka.n1 n2 n3 numberof differentk tasks can beadoneequals 1 an observation is inversely proportionalc03.indd 38Minimize P(RP RT)where theMADweightto its magnitude. z‐Score iofsharespurchasedover timenormally distributed random variable The geometricnmean is always less than, or equal to the arithmetic mean.Combinations Wiley 2018where: The geometric mean equals the arithmetic mean only when all the observationsareall Rights Reserved. any unauthorized copying or distribution will constitute an infringement of copyright.Nz (observedreturn value population mean)/standard deviation (x µ)/σRP portfolioidentical.HarmonicX Hof theN squared deviations around the mean. The standardThe varianceis the mean:averagen! n 1geometric and arithmetic mean increases as thereturnRT target Thedifferencebetweenthen Cr deviation is the positive square rootthe xof the variance. While the variance has no units,( n r )!( r!criterion:r Criterion)Roy’s Safety‐First Roy’s safety-firstused to compare shortfall riskdispersioninobservedvaluesi increases.i1 standard deviation has the same units as the random variable.Counting RulesDuties to ClientsA.σ n p (l-p)NormalDistribution 2w w Cov(R ,R ) 2w w The geometricmean ismean:used to averageof change over time or to calculate thecommon pRobabiliTy Disn Cr Arithmeticsimpleratesaveragen r )!( r!)growthovervalueperiod.In ordertogeometric meanfor Formular N mean50% ofr all (observationslie in the interval µ (2/3)σ rateThegeometricisa alwayslessthan,valueorcalculateequal to the arithmeticmean.Bayes’Range variableMaximum MinimumFVNof aPVe rnswe must add1 toequalseach returnobservationa decimal)and thenare data,The geometricmeanthe arithmeticmean(expressedonly whenasallthe observations 68%all observationsin the1σ the items areRemember:Theofcombinationformula islieusedwhenintervalthe orderµin whichgrowth)over timesubtractidentical.1(orfromthe result.z‐ScoreP (Information Event) P (Event)assigned 90%the labelsis NOTimportant.The evaluesofdeviationsof Information)allobservationslie in the interval µ 1.65σ The difference between the geometric and arithmetic mean increases as the ofP(EventP(Information)38observationsin a data set from valuestheir mean. 2018 Wiley (observedvalue populationliemean)/standarddeviation(x µ)/σdispersionincreases. z95%of all observationsin the intervalµ 1.96σR G n (1in observedR1 ) (1 R 2 ) (1 R n ) 1Permutations38 2018 WileyIntegrity of Capital MarketsA.outcomeswhich are labeled“success” and “failure.” Further, these two outcomes areBinomialDistributionQuantilesascendingor descendingmean,usedwith nominaldata. order. The advantage of using the median is that, unlike theoutcomeswhich areandlabeled“success”and “failure.” Further, these two outcomes aremutually eValueofanAnnuityDueThePresentandFutureValueof ananHowever,OrdinaryAnnuityit is nottoFVextremevalues.themediandoes notuse all the informationN2 σN 2 (R ) w 2 σ 2 (R ) w 2 σ 2 (R )ThePresentofAnnuityDue sensitivePV uallyVar(Rexclusiveandp) wA collectivelyAB exhaustive.BCCQMAquantileis aandvalueat, or belowwhich a stated andproportionof theonobservationsinpositions.a datawixwsuccessesaboutthe sizemagnitudeof theonlyweightsfocusestheir relative Var(RProbabilityp ) ofjCov(R i ,R j ) in n trials (where theThe weightedmeanis observationsintheprobabilityTheofxsuccessesin n trials is given by: 2wPV:#periodsN;%interestperperiodI/Y;amountFVorPMT PV 1A w B Cov(R A ,R B ) 2w B w C Cov(R B ,R C ) 2w C w A Cov(R C ,R A )i1jset lie. Examplesof quantilesinclude: PVOrdinary (1 r)PVAnnuityAnnuity DueAnnuity probabilityofsuccess,p,isequalforall trials) is given by: PV(1r)data set sinntrialsisgivenby:Annuity DueOrdinary Annuity: #DueperiodsN; % interestperiodI/Y; amountFV value.or amountPMTset thatFV hasFVFVAnnuity FV per(1 r)The modea datasetis Ordinarysimplyits equalmostfrequentlyA indataAnnuityAnnuityFVofFV (1 r)mean.Thearithmeticassignsweightsto occurringevery observationthe dataset, FormulaAnnuity Due meanOrdinaryAnnuityBayes’n–xVarianceof a 2 Asset Portfolio ersor fouris odessaidtobebimodal.ItP(X x) nCx (p) (1 – p)which makes it very sensitive to extreme values. tureandistributionAnnuityDueis alsoa dataValueset toofhaveno mode,whereall values are different and no valueP(X x) nCx (p)x (1 – p)n – xPresentValueofforPerpetuity possiblePV ofofaaa perpetuityPresentValuePerpetuityP 2(InformationEvent) P (Event) moredeciles,whichdividethe dataintotenths.data, the modal interval is the interval Var(R ) w2 σ 2 (R ) woccursfrequentlythan toothers.Forgroupedσ 2 (R B ) random2wCov(R) is given by:p Information)ABvarianceA ,RBrandomP(EventExpectedvalueofA waBbinomialexpectedvalueA andof a binomialvariable(X)ThegeometricmeanPMTis usedaverageratesof change over time or to calculate the Thepercentiles,whichdividethe distributionhundredths.(Information) PVover is(1 orderPVAnnuityr)onlytointowith raltendencythatcanDueOrdinaryAnnuity beTheexpected value of a binomialP randomvariable (X) is given by:PV anforPerpetuityvariablePVI/YPerpetuity data.FV FV (1 r)usedwithnominalDue I/YAnnuity2 2E(x) n p2 2returns data,Annuitywe mustaddOrdinary1 to eachreturn observation (expressed as a decimal) and then Var(RMeasures of DispersionCounting Rulesp ) w A σ (R A ) w B σ (R B ) 2w A w Bρ(R A ,R B )σ (R A )σ (R B )E(x) n pContinuousCompoundingand Future ValuesQMsubtract 1 fromthe result. andContinuousCompoundingFutureValues different weights to observations in theThe weightedmeanis calculatedby assigningPresentValue ofa Perpetuity Thevarianceofabinomialvariablegiven nby:The numberways that the krandomtasks canbe doneisequalsDispersionis the variabilityor spread of a randomaround its centralVarianceof aof3differentAsset Portfolio1 n2 n3 nk .r N the disproportionatedata set toFVaccounteffect ofvariablecertain observationson thetendency.arithmeticPVefor The variance of a binomial random variable is given by:r NN PVeFVGarithmetic n (1 PMTRRmean R 2 ) (1 R n ) to 1every observation in the data set,N 1 ) (1mean. Theassignsequalweights2PVis the most basic measures of variability of data. It is simply theCombinationsPerpetuityσ n p 2 (l-p)22 22 2Therangeoneof /YVar(Rwhich makes it very sensitiveto extreme values.2p ) w A σ (R A ) w B σ (R B ) w C σ (R C )7 March 2017 March 2018Shortfall ofRatioportfolios (higher SF ratio indicates lower shortfall risk)Minimize P(R R )PTRemember:combinationformula is used when the order in which the items are intheThe harmonicmeanisaverageusedin observationsthearenato determineaverage TheMathematically,unlessall thein managementthe dataset dardDeviationassigned the labels is NOT important.E (RP ) RTcostof2018sharespurchasedovertime.It armonicmeanwill alwaysbe lessthanbeorthegeometricmean, anwhichbelessShortfall ratio (SF Ratio) Wileyall illaconstituteinfringementofwillcopyright.where: Wiley 2018 all Rights Reserved. any unauthorized copying or distribution will constitute an infringement of copyright.σPwherethethearithmeticweight ofmean.an observation is inversely proportional to its magnitude. RthanP portfolio returnPermutations22Loyaltyn (X i µ)2QUANTITATIVE METHODSRT target returnContinuously Compounded Returnsn!NPr B. Additional Compensation Arrangementsmean: X H Nσ Shortfall nRatio( n r r )!1n Standard DeviationSamplingTheorySample Variance andEAR e 1rcc continuously compounded annual rate x copying or distribution will constituteC. Responsibilities of Supervisors 2 Wiley 2018 all Rights Reserved. any unauthorizedan infringement of copyright.sampling anD esTimaTioni 1 iE (RP ) RTShortfallratio(SFRatio) Wiley 2018all Rights Reserved.anytheorem:unauthorizedcopyingor distributionwill constitute aninfringement HPRCentrala populationwithany of copyright.Investment Analysis, Recommendations, and Actionsr limittnσGiven lnPt e221Mathematically,unlessall2the observations in the data set are identical (equal in value), probability distribution,X) 2018 Wileywith mean, μ, and variance, (X(Xi A. Diligence and Reasonable Basisi µ)22i 1the hichitselfwillbelessSamplingand EstimationContinuouslyCompoundedReturnssσ i 1samplingdistributionof the sample mean x,σ , thesampling anD esTimaTion n1B. Communication with Clients and Prospective than the arithmeticn mean.computed from sample size n will approximately bei 1Harmonic2ccV.ccClientsC.VI.Record Retentionc02.inddDisclosure of ConflictsB.Priority of Transactionsnormalwith mean, μ (the population mean), andsTaTisTical concepTsccn Standarddeviation: positive square root of the variancewhensampleis greatervariance,σ2of/n,Samplingthemean theSamplemean sizePopulationmean thanx µ orSamplingandEstimationsTaTisTicalrerrorconcepTs2 tHPR l (X i X)t eequalto 30. Coefficientofvariation:usedtocomparerelativei 1SamplingErrorStandard Error of Sample Mean when Population Variance is knowns of VariationCoefficient The standard deviation of the distribution of sampleExpecteddispersionsValue n 1 of data sets (lower is better)ccConflicts of InterestA.SamplingEARError e r 17 March 2018r7:04PMcontinuously compounded annual ratecc 21pRobabiliTy concepTsCoefficient of Variationmeans isknownas QMthestandardof sampleSamplingerrorof the21mean Samplemean errorPopulationmean xmean. µ 2018 Wileysσx σnCoefficientof)Xvariation 2018 Wiley P(Xdeviation P(XThe meanE(X)absolute(MAD)always11 P(X2 )Xn )X nbe less than or equal to the standard When the population variance is known, the standards2 willXStandard Error of Sample Mean when Population Variance is knownof variation deviation.CoefficientThis is because,by squaringall deviations from the mean, the standardC. Referral FeesXwhere: error of sample mean is calculated asdeviation attachesn a greater weight to larger deviations from the mean.c02.indd 217 March 2018 7:04 PMwhere:σ x the standarderror of the sample meanVII. Responsibilities as a CFA Institute Memberor CFA P(Xσ7xMarch σ2018 7:04 PMc02.indd 22i )X iswhere: sampleE(X)standarddeviationnstandard deviationσ the populationi 1 idatesemivarianceisdeviationthe average of squared deviations below the mean, while thethesamplemean.XsThe samplestandardn the sample sizesemideviationisthe positivesquare root of the semivariance. The target semivariancerisk (higheris better) the samplemean.Xwhere: When the population variance is not known, the standardA. Conduct as Participants in CFA Institute Programswhere:Sharperefers toRatiothe sum of the squared deviations from a specific target return and its squareroot.StandardError ofofSamplewhenVarianceσ x thestandarderrorof theMeansamplemeanerrorsamplemeanis Populationcalculatedas is not knownXi one of n possible outcomes.RatioB. Reference to CFA Institute, the CFA Designation, Sharpeσ the population standard deviationrr Chebyshev’sInequalitypfn the sample sizesand the CFA ProgramVarianceand StandardSharperatio Deviationsx rp s p rfnpRobabiliTy concepTsSharperatio givesChebyshev’sinequalityanin aError of Sample Mean when Population Variance is not knownStandardsp2 approximate value for the proportion of observationsσ 2 (X) E{[X E(X)]}data set that fall within k standard deviations from the mean.sampling anDwhere:where: Confidence interval for unknown population parameter Positive skew: mode median means of sample meanrp mean portfolios x standarderrorwhere:ExpectedValue nreturnsbasedx tatistic22nreturnrrpf risk‐free2 sample standard deviation.meanσportfolioreturn(X) P(XProportionof observationswithin k standard deviations from mean 1 –s 1/ki ) [X i E(X)]platykurticexcess kurtosis), mesokurtic (samestandarddeviationportfolio returnsreturni 1 of(negative Compliance by investment management firms with GIPSsrfp risk‐freeσE(X) P(X1 )X1 P(X 2 )X 2 P(X n )X nConfidencez α /2where: x sskurtosis) standarddeviationofportfolioreturnsspis voluntary.n sample meanSampleskewness,alsoRuleknownsample relativeis calculatedas: populationss x standarderror ofTheTotalProbabilityforasExpectedValueadvantageof Chebyshev’sinequalityis thatskewness,it holds forsamples andandnestimate (reliability factor standard error)skewness,also knowndataas samplerelativeskewness,is thecalculatedas:s samplePointstandarddeviation. Comply with all requirements of GIPS on a firm-wide Samplefor discreteand continuousregardlessof theshape ofdistribution.E(X)P(X)Xnccwhere: ii1. E(X) E(X S)P(S) E(X S )P(S ) 3 Confidence interval for unknown population parameterbasis in order to claim compliance.i 1pRobabiliTy concepTs i ) X)n (X S ConfidenceIntervals Thesamplemean(pointofcopyingpopulationmean)will constitute an infringement of copyright.x) P(S) E(X P(S) . E(XS) P(S)2.E(X) E(XSwhere:1 n1 22nn Wiley 2018basedall Rights Reserved.anyestimateunauthorizedor distributionCoefficient of Variationon t-statistici 1 (X X)3value andvarianceof a random variable (X) zPoint iK Third-party verification of GIPS compliance is optional. where: SExpectedα/2 estimate value of the sample statistic that is used to estimate the population ( n 1)(n n 2 ) i 1 s3 Thestandardnormalrandomvariableforwhichthe probability of an observationwhere:Pointestimate (reliabilityfactor standarderror)SusingprobabilitiesparameterKn possible (ofThecoefficientvariation,ratio of the standard deviation of the dataset toofXn expected2 ) whichs3is thei one Present a minimum of five years of GIPS-compliant n 1)(outcomes.σ lyingfactorExpectedin eithertailis σ /based2 (reliabilityfactor). distribution of the point estimate andE(X) theValueunconditionalvalueof XReliability aerrornumberon theassumedits ts.Alowercoefficient ofThe standardof the hemeancubeddeviation. S1) the expected value of X given Scenario 1historical performance when first claiming compliance, E(Xn level of confidence for the interval (1 α).thewhere:VarianceandStandard Deviationvariationisprobabilitybetter.QUANTITATIVE METHODSAsn1)becomeslarge,to the mean cubed deviation. theofexpressionScenario 1reducesoccurringStandarderror valuethe standarderror ofstatisticthe sample(pointestimate)or since inception of the firm or composite if less than P(SPoint estimateof the samplethat statisticis used toestimatethe populationE(X) P(Xthe)X1 P(X 2 )X 2 P(X n )X nn 1 Whensto use z-statistic or t-statistic, S2, . . . 3, Sn} is mutually exclusive and exhaustive.The set of events {S1parameter2five years, then add one year of compliant performance(X i X) xall Rightst α Remember:σ 2 (X) E(X)]}nE{[X tionwillconstituteaninfringementofcopyright.The based on the assumed distribution of the point estimate andReliability factor n a number1 si n13Small Sample Large Sampleeach subsequent year so that the firm eventually2 CV measures riskCVSCovarianceK (X i3 X)the level ofconfidencefortheE(X)WhenSamplingfroma: interval (1 α).n 30n 30per unit ofreturn.n1 X P(Xs i )X ipresents a (minimum) performance record for 10 years.SK ii 11n 3Standarderror )s i ) [X i E(X)]2where: Normal distribution with known varianceσ 2 (X)n P(Xz‐statisticz‐statisticE{[X E(X)][Y E(Y)]} Nine major sections: Fundamentals of Compliance; Inputwhere: Cov(XY) i 1x sample mean (the point estimate of the population mean)where:tαswhere: sampleCov(RstandardA ,RdeviationB ) E{[R A E(R A )][R B E(R B )]}Normal distribution with unknown variancet‐statistict‐statistic*data; Calculation Methodology; Composite Construction;X the t‐reliability factor one of n possible outcomes.2sThe i samplestandard d Value CovarianceandofreturnsDisclosures; Presentation and Reporting; Real Estate; CorrelationNon-normal distribution with known variancenot availablez‐statisticSample Kurtosisuses standard deviations to the fourth power. Sample excess kurtosissis standardCoefficienterror of the sample meanVarianceandStandard DeviationPrivate Equity; and Wrap Fee/Separately Managedc)P(Sc)calculatedSampleuses standarddeviationsto the fourth power. Sample excess kurtosis nisNon-normal distribution with unknown variancenot availablet‐statistic*1. E(X)Kurtosis as:E(X S)P(S) E(X Ss sample standard deviationAccount (SMA) Portfolios.calculated P(SA2),R .B.). E(X Sn) P(Sn)2. E(X) as:E(X S1) P(S1) E(X S2)Cov(R2 ) * Use of z‐statistic is also acceptableCorr(R(R A ,RB) σ 2 (X) A ,RE{[X ρE(X)]}B n (σ )(σ4 )A X) B(X in2 where:n(n 1)3(n1) 4i 1 (X X) Sample Biases nK unconditional E(X) theexpected valueofi X E Wiley 2020n(n 2)(n1) 3) i 1 2 s4 1) 2 3) 2)(n(n 1)(n (n3(n2 SWileyσthe(X) P(X23valuegiven ScenarioE(XK 2018i ) [Xofi XE(X)]1) E expectedData‐Mining Bias4 1 (n 2)(n 3)(n 1)(n 2)(n 3)s i1P(S1) the probability of Scenario 1 occurring Data mining is the practice of extensively searching through a data set for statistically {S1, S2, . . . , Sn} is mutually exclusive and exhaustive.The set of events22Global Investment PerformanceStandards (GIPS )Probability Concepts
oThesis TesTingSample statistic Hypothesized valueStandard error of sample statisticTest statistic Power of a TestWiley’s CFA Program Exam ReviewDecision Rules for Hypothesis TestsDecisionDo not reject H0H0 is TrueCorrect decisionIncorrect decisionType I errorSignificance level P(Type I error)Reject H0H0 is FalseIncorrect decisionType II errorCorrect decisionPower of the test 1 P(Type II error)Confidence Interval sample critical standard economicS Power of a test 1 P(Type II error) population sample critical standard error x(s n) (z α /2 ) The point of intersection of the AD curve and the SRAS curve defines theeconomy’s short run equilibrium position. Short‐run fluctuations in equilibriumreal GDP may occur due to shifts in either or both the AD and SRAS curves. ShortTopics in DemanD anD supply analysisrun equilibrium may be established at, below or above potential output. Deviationsof short run equilibrium from potential output result in business cycles. In an expansion, real GDP is increasing, the unemployment rate is fallingand capacity utilization is rising. Further, inflation tends to rise during anTotal, Average, Marginal, Fixed, and Variable Costsexpansion. In a contraction, real GDP is decreasing, the unemployment rate is risingTable: Summary of Cost Termsand capacity utilization is falling. Further, inflation tends to fall during aCostsCalculationcontraction.Total fixed cost (TFC)Sum of all fixed expenses; here defined to include allFactorscausinga shift in aggregate demand (AD)Shift in Aggregate Demandopportunity costs statistic value error parameter statistic value HypothesisTesting Shutdown Analysis One-tailedSummaryversus two-tailed testsvariable cost (TVC)Sum of all variable expenses, or per unit variable cost TotalProfitsare maximizedwhen the difference between totaltimes quantity; (per unit VC Q)xType of testOne tailed(upper tail)testNullhypothesisH0 : μ μ0One tailedTestStatisticH0 : μ μ0(lower tail)testTwo‐tailed (z α /2 )AlternatehypothesisHa : μ μ0(sn) µ0 Fail to rejectnull ifReject null ifTest statistic critical valueTest statistic Test statistic critical valueTest statistic critical valuevalueHypothesiscriticalTestingHa : μ μ0P‐value representsProbability that liesabove the computed teststatistic.Probability that liesbelow the computed teststatistic.Sample statistic Hypothesized value: μ μ0 Ha : μ μ0Test statistic Lower criticalProbability that liesTestH0statisticlowercriticalvalue statistictestabove the positiveStandarderrorof samplePower of a TestvalueTest statistic upper criticalvaluePower of a test 1 P(Type II error)statistic upper criticalvaluevalue of the computedtest statistic plus theprobability that liesbelow the negativevalue of the computedtest statistic.forTypeHypothesisTests DecisionType I RulesversusII errors16 Wiley 2018 all Rights Reserved. any unauthorized copying or distribution will constitute an infringement of copyright.DecisionH0 is TrueH0 is FalseCorrect decisionIncorrect decisionDo not reject H0Type II errorIncorrect decisionReject H0Correct decisionType I errorPower of the testSignificance level 1 P(Type II error)P(Type I error)revenue (TR) and total cost (TC) is at its highest. The levelTotal costs (TC)Total fixed cost plus total variable cost; (TFC TVC)of output at which this occurs is the point where:Average fixed cost (AFC)Total fixed cost divided by quantity; (TFC / Q) Marginal revenue (MR)equals marginal cost (MC); andAverage variable cost (AVC) MC is not falling Total variable cost divided by quantity; (TVC / Q)total cost (ATC)Total cost divided by quantity; (TC / Q) orEC(AFC AVC) AverageBreakevenoccurs whenTR TC, and price (or averageMarginalcost (MC)Changetotalin total costcost dividedby changequantity;revenue)equals average(ATC)at thein breakeven(ΔTC / ΔQ)quantity of production. The firm is earning normal profit. Breakeven,Short-runand long-runoperating decisionsShutdown,and Exit PointsRevenue/ Cost RelationshipShort-run DecisionLong-run DecisionTR TCContinue operatingContinue operatingTR TVC, but TCContinue operatingExit marketTR TVCShut down productionExit marketMarket StructuresAn Increase in theFollowing FactorsShifts the AD CurveReasonStock pricesRightward: Increase in ADHigher consumptionHousing pricesRightward: Increase in ADHigher consumptionConsumer confidenceRightward: Increase in ADHigher consumptionBusiness confidenceRightward: Increase in ADHigher investmentCapacity utilizationRightward: Increase in ADHigher investmentGovernment spendingRightward: Increase in ADGovernment spending a componentof ADTaxesLeftward: Decrease in ADLower consumption and investmentBank reservesRightward: Increase in ADLower interest rate, higherinvestment and possibly higherconsumptionExchange rate (foreigncurrency per unitdomestic currency)Leftward: Decrease in ADLower exports and higher importsGlobal growthRightward: Increase in ADHigher exportseconomicS ShiftFactorscausing a shift in aggregate supply (AS)in Aggregate SupplyhypoThesisTesTing Perfectcompetition Minimal barriers to entry, sellers have no pricing power.hypoThesis TesTing Demand curve faced by an individual firm is perfectlyAn Increase inShifts SRASShifts LRASReasonInterval ConfidenceHypothesistest concerning the mean of a singleSupply of laborRightwardRightwardI
CFA Institute Professional i1Conduct Program sanctions: public censure, suspension of membership and use of the CFA designation, and revocation of the CFA charter (but no monetary fine). standards of ProfEssional conduct I. Professionalism A. Knowledge of Nthe Law B. Independenc
