Transcription
Q1Quarterly Market ReviewFirst Quarter 2020
Quarterly Market ReviewFirst Quarter 2020This report features world capital marketperformance and a timeline of eventsfor the past quarter. It begins with aglobal overview, then features thereturns of stock and bond asset classesin the US and international markets.Overview:The report also illustrates the impact ofglobally diversified portfolios.World Asset ClassesMarket SummaryWorld Stock Market PerformanceUS StocksInternational Developed StocksEmerging Markets StocksSelect Market PerformanceSelect Currency Performancevs. US DollarReal Estate Investment Trusts (REITs)CommoditiesFixed IncomeGlobal Fixed IncomeImpact of Diversification2
Quarterly Market SummaryIndex ReturnsUS StockMarket1Q cksGlobalRealEstateSTOCKSUS BondMarketGlobalBondMarketex 9 Q22009 Q22009 Q22009 Q32001 Q32008 Q4-22.8%-23.3%-27.6%-36.1%-3.0%-2.7%2008 Q42020 Q12008 Q42008 Q42016 Q42015 Q2Since Jan. 2001Avg. QuarterlyReturnBestQuarterWorstQuarterPast performance is not a guarantee of future results. Indices are not available for direct investment. Index performance does not reflect the expenses associated withthe management of an actual portfolio. Market segment (index representation) as follows: US Stock Market (Russell 3000 Index), International Developed Stocks (MSCI Worldex USA Index [net div.]), Emerging Markets (MSCI Emerging Markets Index [net div.]), Global Real Estate (S&P Global REIT Index [net div.]), US Bond Market (BloombergBarclays US Aggregate Bond Index), and Global Bond Market ex US (Bloomberg Barclays Global Aggregate ex-USD Bond Index [hedged to USD]). S&P data 2020 S&P DowJones Indices LLC, a division of S&P Global. All rights reserved. Frank Russell Company is the source and owner of the trademarks, service marks, and copyrights related to theRussell Indexes. MSCI data MSCI 2020, all rights reserved. Bloomberg Barclays data provided by Bloomberg.3
Long-Term Market SummaryIndex ReturnsUS StockMarket1 cksGlobalRealEstateSTOCKSUS BondMarketGlobalBondMarketex 88%4.17%5 Years10 YearsPast performance is not a guarantee of future results. Indices are not available for direct investment. Index performance does not reflect the expenses associated withthe management of an actual portfolio. Market segment (index representation) as follows: US Stock Market (Russell 3000 Index), International Developed Stocks (MSCI Worldex USA Index [net div.]), Emerging Markets (MSCI Emerging Markets Index [net div.]), Global Real Estate (S&P Global REIT Index [net div.]), US Bond Market (BloombergBarclays US Aggregate Bond Index), and Global Bond Market ex US (Bloomberg Barclays Global Aggregate ex-USD Bond Index [hedged to USD]). S&P data 2020 S&P DowJones Indices LLC, a division of S&P Global. All rights reserved. Frank Russell Company is the source and owner of the trademarks, service marks, and copyrights related to theRussell Indexes. MSCI data MSCI 2020, all rights reserved. Bloomberg Barclays data provided by Bloomberg.4
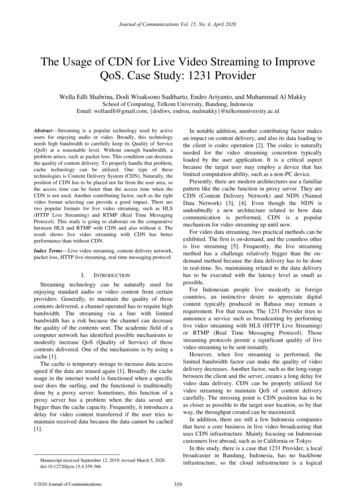
World Stock Market PerformanceMSCI All Country World Index with selected headlines from Q1 2020300280260240220200180Dec 31Jan 31“Foreign InvestmentFalls to Near-DecadeLow as GlobalizationSlows”“New VirusDiscovered byChinese ScientistsInvestigatingPneumoniaOutbreak”Feb 29“EurozoneGrowth Hits6-Year Low”“US Trade DeficitNarrows for FirstTime in SixYears”“RefinancingBoom FuelsMortgages toPost-CrisisRecord”“Drop in EnergyPrices SlowedUS Inflation inJanuary”“Oil PricesCollapseAfter SaudiPledge toBoostOutput”Mar 31“ECB to BuyBondsto CombatEconomicSlowdown”“Dow Closes atRecord asWorries Abate”“Robust US PayrollGain Points toContinued HealthyLabor Market”“Dow, S&P, Nasdaq AllDrop More than 4% inLargest One-Day PointDeclines on Record”“Fed Cuts Rates toNear Zero andWill RelaunchBond-BuyingProgram”“Coronavirus DeclaredPandemic by WorldHealth Organization”“US StocksTurn inWorstQuarterSince2008”“Record Rise inUnemploymentClaims HaltsHistoric Run ofJob Growth”“Dow Soars MoreThan 11% InBiggest One-DayJump Since 1933”These headlines are not offered to explain market returns. Instead, they serve as a reminder that investors should view daily events from along-term perspective and avoid making investment decisions based solely on the news.Graph Source: MSCI ACWI Index [net div.]. MSCI data MSCI 2020, all rights reserved.It is not possible to invest directly in an index. Performance does not reflect the expenses associated with management of an actual portfolio. Past performance is not aguarantee of future results.5
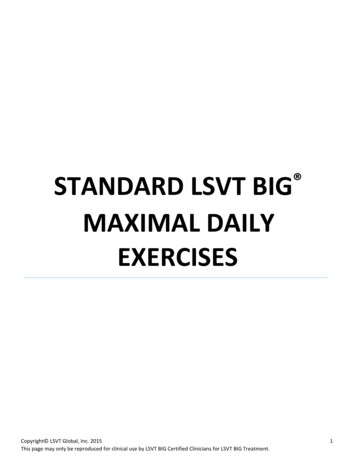
World Stock Market PerformanceMSCI All Country World Index with selected headlines from past 12 monthsLONG TERM (2000–Q1 2020)300200SHORT TERM (Q2 2019–Q1 2020)Last ar 31Jun 30“Home-PriceGrowthSlows toLowest LevelSince 2012”Sep 30“US JobOpenings“China GrowthOutnumberat Its SlowestUnemployedsince 1992 asby WidestBeijingGap Ever”Struggles toJuiceEconomy”“US ConsumerSentiment HitsHighest Levelin 15 Years”“S&P 500 PostsBest First Half in22 Years”Dec 31“ManufacturingSputters asBroader USEconomy Slows”“Dow Sheds800 in BiggestDrop of Year”“Fed CutsRates byQuarter Pointbut FacesGrowing Split”“ECB LaunchesMajor StimulusPackage, CutsKey Rate”“US StocksClose OutDecade with190% Gain”Mar 31“EurozoneGrowthHits6-YearLow”“Dow Closesat Recordas WorriesAbate”“Record Rise inUnemploymentClaims HaltsHistoric Run ofJob Growth”“Fed Cuts Ratesto Near Zero andWill RelaunchBond-BuyingProgram”“New Virus Discoveredby Chinese Scientists“Oil Prices CollapseInvestigatingAfter Saudi PledgePneumonia Outbreak””to Boost Output”“China’s ConsumerInflation Soars to“Dow, S&P, Nasdaq All Drop MoreHighest Level inthan 4% in Largest One-Day PointYears”Declines on Record”These headlines are not offered to explain market returns. Instead, they serve as a reminder that investors should view daily events from along-term perspective and avoid making investment decisions based solely on the news.Graph Source: MSCI ACWI Index [net div.]. MSCI data MSCI 2020, all rights reserved.It is not possible to invest directly in an index. Performance does not reflect the expenses associated with management of an actual portfolio. Past performance is not aguarantee of future results.6
World Asset ClassesFirst Quarter 2020 Index Returns (%)Equity markets around the globe posted negative returns in the first quarter. Looking at broad market indices,US equities outperformed non-US developed markets and emerging markets.Value stocks underperformed growth stocks in all regions. Small caps also underperformed large caps in allregions.REIT indices underperformed equity market indices in both the US and non-US developed markets.Bloomberg Barclays US Aggregate Bond Index3.15One-Month US Treasury Bills0.37S&P 500 Index-19.60Russell 1000 Index-20.22Russell 3000 Index-20.90MSCI World ex USA Index (net div.)-23.26MSCI All Country World ex USA Index (net div.)-23.36MSCI Emerging Markets Index (net div.)-23.60Russell 1000 Value Index-26.73MSCI Emerging Markets Value Index (net div.)-28.00MSCI World ex USA Small Cap Index (net div.)-28.39Dow Jones US Select REIT Index-28.52MSCI World ex USA Value Index (net div.)-28.76Russell 2000 Index-30.61MSCI Emerging Markets Small Cap Index (net div.)S&P Global ex US REIT Index (net div.)-31.37-32.50Russell 2000 Value Index -35.66Past performance is not a guarantee of future results. Indices are not available for direct investment. Index performance does not reflect the expenses associated withthe management of an actual portfolio. The S&P data is provided by Standard & Poor's Index Services Group. Frank Russell Company is the source and owner of thetrademarks, service marks, and copyrights related to the Russell Indexes. MSCI data MSCI 2020, all rights reserved. Dow Jones data 2020 S&P Dow Jones Indices LLC, adivision of S&P Global. All rights reserved. S&P data 2020 S&P Dow Jones Indices LLC, a division of S&P Global. All rights reserved. Bloomberg Barclays data provided byBloomberg. Treasury bills Stocks, Bonds, Bills, and Inflation Yearbook , Ibbotson Associates, Chicago (annually updated work by Roger G. Ibbotson and Rex A. Sinquefield).7
US StocksFirst Quarter 2020 Index ReturnsThe US equity market posted negativereturns for the quarter but on a broadindex level outperformed non-USdeveloped markets and emergingmarkets.Value underperformed growth in the USacross large and small cap stocks.Small caps underperformed large caps inthe US.Ranked Returns (%)Large Growth-14.10Large Cap-20.22Marketwide-20.90Small Growth-25.76Large ValueREIT indices underperformed equitymarket indices.-26.73Small Cap-30.61Small Value -35.66World Market Capitalization—USPeriod Returns (%)Asset Class5 * AnnualizedYTD1 Year3 Years** 5 Years** 10 Years**Large Growth-14.100.9111.3210.3612.97Large 005.7710.15Small Growth-25.76-18.580.101.708.89Large Value-26.73-17.17-2.181.907.67Small Cap-30.61-23.99-4.64-0.256.90Small Value-35.66-29.64-9.51-2.424.79Past performance is not a guarantee of future results. Indices are not available for direct investment. Index performance does not reflect the expenses associated with themanagement of an actual portfolio. Market segment (index representation) as follows: Marketwide (Russell 3000 Index), Large Cap (Russell 1000 Index), Large Cap Value (Russell1000 Value Index), Large Cap Growth (Russell 1000 Growth Index), Small Cap (Russell 2000 Index), Small Cap Value (Russell 2000 Value Index), and Small Cap Growth (Russell 2000Growth Index). World Market Cap represented by Russell 3000 Index, MSCI World ex USA IMI Index, and MSCI Emerging Markets IMI Index. Russell 3000 Index is used as the proxyfor the US market. Dow Jones US Select REIT Index used as proxy for the US REIT market. Frank Russell Company is source and owner of trademarks, service marks, and copyrightsrelated to Russell Indexes. MSCI data MSCI 2020, all rights reserved.8
International Developed StocksFirst Quarter 2020 Index ReturnsDeveloped markets outside the USunderperformed the US equity market butoutperformed emerging markets equitiesduring the quarter.Small caps underperformed large caps innon-US developed markets.Value underperformed growth acrosslarge and small cap stocks.Ranked Returns (%)Local currencyUS currency-15.06Growth-17.81-20.52Large Cap-23.26-25.45Small Cap-28.39Value-28.76-26.05World MarketCapitalization—International DevelopedPeriod Returns (%)Asset Class3 * AnnualizedYTD1 Year3 Years** 5 Years** 10 Years**Growth-17.81-6.472.552.054.25Large Cap-23.26-14.89-2.07-0.762.43Small -3.700.51Past performance is not a guarantee of future results. Indices are not available for direct investment. Index performance does not reflect the expenses associated withthe management of an actual portfolio. Market segment (index representation) as follows: Large Cap (MSCI World ex USA Index), Small Cap (MSCI World ex USA Small CapIndex), Value (MSCI World ex USA Value Index), and Growth (MSCI World ex USA Growth Index). All index returns are net of withholding tax on dividends. World Market Caprepresented by Russell 3000 Index, MSCI World ex USA IMI Index, and MSCI Emerging Markets IMI Index. MSCI World ex USA IMI Index is used as the proxy for theInternational Developed market. MSCI data MSCI 2020, all rights reserved. Frank Russell Company is the source and owner of the trademarks, service marks, and copyrightsrelated to the Russell Indexes.9
Emerging Markets StocksFirst Quarter 2020 Index ReturnsEmerging markets underperformeddeveloped markets, including the US, forthe quarter.Ranked Returns (%)Local currencyValue stocks underperformed growthstocks.US currency-14.69Growth-19.34Small caps underperformed large caps.-19.05Large Cap-23.60-23.57Value-28.00-26.37Small CapWorld Market Capitalization—Emerging MarketsPeriod Returns (%)Asset Class1 -31.37* AnnualizedYTD1 Year3 Years** 5 Years** 10 Years**Growth-19.34-9.942.392.132.71Large 8-3.00-1.45Small Cap-31.37-28.98-9.64-5.17-1.34Past performance is not a guarantee of future results. Indices are not available for direct investment. Index performance does not reflect the expenses associated withthe management of an actual portfolio. Market segment (index representation) as follows: Large Cap (MSCI Emerging Markets Index), Small Cap (MSCI Emerging MarketsSmall Cap Index), Value (MSCI Emerging Markets Value Index), and Growth (MSCI Emerging Markets Growth Index). All index returns are net of withholding tax on dividends.World Market Cap represented by Russell 3000 Index, MSCI World ex USA IMI Index, and MSCI Emerging Markets IMI Index. MSCI Emerging Markets IMI Index used as theproxy for the emerging market portion of the market. MSCI data MSCI 2020, all rights reserved. Frank Russell Company is the source and owner of the trademarks, servicemarks, and copyrights related to the Russell Indexes.10
Select Market PerformanceFirst Quarter 2020 Index ReturnsIn US dollar terms, Denmark and Switzerland recorded the highest country performance in developedmarkets, while Austria and Norway posted the lowest returns for the quarter. In emerging markets, China andQatar recorded the highest country performance, while Brazil and Colombia posted the lowest performance.Ranked Developed Markets Returns (%)DenmarkRanked Emerging Markets Returns (%)-9.61Switzerland-12.16Japan-17.39Hong 99-22.53Saudi ArabiaIsraelNew ussiaCanada-28.90Czech wayAustria-33.77-36.58-38.21HungaryIndonesiaSouth gentina-43.60Colombia -49.77Brazil -50.82Past performance is not a guarantee of future results. Indices are not available for direct investment. Index performance does not reflect the expenses associatedwith the management of an actual portfolio. Country performance based on respective indices in the MSCI World ex US IMI Index (for developed markets), MSCI USA IMI Index(for US), and MSCI Emerging Markets IMI Index. All returns in USD and net of withholding tax on dividends. MSCI data MSCI 2020, all rights reserved. UAE and Qatar havebeen reclassified as emerging markets by MSCI, effective May 2014. Saudi Arabia and Argentina have been reclassified as emerging markets by MSCI, effective May 2019.11
Select Currency Performance vs. US DollarFirst Quarter 2020In developed and emerging markets, currencies mostly depreciated vs. the US dollar with a few exceptions,including the Japanese yen and the Swiss franc.Ranked Developed Markets Returns (%)Japanese yen (JPY)Ranked Emerging Markets Returns (%)0.67Hong Kong dollar (HKD)0.53Swiss franc (CHF)0.08Danish krone (DKK)-2.11Euro (EUR)-2.25Israeli New shekel (ILS)-2.36Swedish krona (SEK)-5.52Singapore dollar (SGD)-5.56British pound (GBP)-6.40Canadian dollar (CAD)-8.89Egyptian pound (EGP)1.97Saudi Arabian riyal (SAR)-0.15Philippine peso (PHP)-0.42New Taiwan dollar (TWD)-0.87Chinese renminbi (CNY)-1.80Peruvian sol (PEN)-3.71Korean won (KRW)-5.00Malaysian ringgit (MYR)-5.31Indian rupee (INR)-5.65Pakistani rupee (PKR)-6.76Argentinian peso (ARS)-7.02Thai baht (THB)-8.73Polish zloty (PLN)-8.82Czech koruna (CZK)-9.32Turkish lira (TRY)-9.70Hungarian forint (HUF)-10.38Chilean peso (CLP)-11.78Indonesian rupiah (IDR)New Zealand dollar (NZD)-12.12Colombian peso (COP)Mexican peso (MXN)Australian dollar (AUD)-12.93Russian ruble (RUB)-14.88-19.18-19.50-20.51South African rand (ZAR) -21.70Norwegian krone (NOK)-16.32Brazilian real (BRL) -22.44Past performance is not a guarantee of future results. Indices are not available for direct investment. Index performance does not reflect the expenses associated withthe management of an actual portfolio.MSCI data MSCI 2020, all rights reserved.12
Real Estate Investment Trusts (REITs)First Quarter 2020 Index ReturnsUS real estate investment trustsoutperformed non-US REITs in US dollarterms during the quarter.Ranked Returns (%)US REITSGlobal ex US REITSTotal Value of REIT Stocks-32.50Period Returns (%)Asset Class41%World -28.52* AnnualizedYTD1 Year 3 Years** 5 Years** 10 Years**US REITS-28.52-23.96-4.28-1.426.88Global ex US REITS-32.50-25.34-4.83-2.763.6159%US Past performance is not a guarantee of future results. Indices are not available for direct investment. Index performance does not reflect the expenses associated withthe management of an actual portfolio. Number of REIT stocks and total value based on the two indices. All index returns are net of withholding tax on dividends. Total value ofREIT stocks represented by Dow Jones US Select REIT Index and the S&P Global ex US REIT Index. Dow Jones US Select REIT Index used as proxy for the US market, andS&P Global ex US REIT Index used as proxy for the World ex US market. Dow Jones and S&P data 2020 S&P Dow Jones Indices LLC, a division of S&P Global. All rightsreserved.13
CommoditiesFirst Quarter 2020 Index ReturnsThe Bloomberg Commodity Index TotalReturn decreased 23.29% for the firstquarter.Unleaded gas and WTI crude oil were theworst performers, declining by 68.20%and 66.63%, respectively.Ranked Returns (%)Gold4.20Soybean meal3.47Wheat1.75Kansas wheat0.12SoybeansGold and soybean meal led quarterlyperformance, returning 4.20% and3.47%, lver-21.37Live cattle-22.83Soybean oil-23.23Cotton-26.60Natural gas-27.69Lean hogs-36.94Heating oil-50.20Low sulphur gas oil-51.56Brent crude oil-56.39WTI crude oil -66.63Unleaded gas -68.20Period Returns (%)Asset ClassCommoditiesQTR-23.29* Annualized1 Year 3 Years** 5 Years** 10 Years**-22.31-8.61-7.76-6.74Past performance is not a guarantee of future results. Index is not available for direct investment. Index performance does not reflect the expenses associated with themanagement of an actual portfolio. Commodities returns represent the return of the Bloomberg Commodity Total Return Index. Individual commodities are sub-index values ofthe Bloomberg Commodity Total Return Index. Data provided by Bloomberg.14
Fixed IncomeFirst Quarter 2020 Index ReturnsInterest rates decreased in the US treasurymarket in the first quarter. The yield on the5-year Treasury note decreased by 132basis points (bps), ending at 0.37%. Theyield on the 10-year note decreased by 122bps to 0.70%. The 30-year Treasury bondyield decreased 104 bps to 1.35%.US Treasury Yield Curve (%)4.003.0012/31/20192.003/31/2020On the short end of the yield curve, the 1month Treasury bill yield decreased to0.05%, while the 1-year Treasury bill yielddecreased by 142 bps to 0.17%. The 2year note finished at 0.23% after adecrease of 135 bps.In terms of total returns, short-termcorporate bonds declined 2.19%.Intermediate-term corporate bondsdeclined 3.15%.3/29/20191.000.001Yr5Yr10Yr30YrBond Yields across Issuers (%)The total return for short-term municipalbonds was -0.51%, while intermediate munibonds returned -0.82%. General obligationbonds outperformed revenue bonds.3.842.872.380.7010-Year USTreasuryState and LocalMunicipalsAAA-AACorporatesPeriod Returns (%)Asset ClassA-BBBCorporates*AnnualizedQTR1 Year3 Years**5 Years**20.6332.2813.307.328.89Bloomberg Barclays US Aggregate Bond Index3.158.934.823.363.88FTSE World Government Bond Index 1-5 Years (hedged to USD)2.254.983.032.242.00ICE BofA 1-Year US Treasury Note Index1.723.852.311.570.98Bloomberg Barclays US TIPS Index1.696.853.462.673.48FTSE World Government Bond Index 1-5 Years0.692.792.121.550.40Bloomberg Barclays US Government Bond Index LongICE BofA US 3-Month Treasury Bill IndexBloomberg Barclays Municipal Bond IndexBloomberg Barclays US High Yield Corporate Bond Index10 2.68-6.940.772.785.64One basis point (bps) equals 0.01%. Past performance is not a guarantee of future results. Indices are not available for direct investment. Index performance does notreflect the expenses associated with the management of an actual portfolio. Yield curve data from Federal Reserve. State and local bonds are from the S&P National AMTFree Municipal Bond Index. AAA-AA Corporates represent the ICE BofA US Corporates, AA-AAA rated. A-BBB Corporates represent the ICE BofA US Corporates, BBB-A rated.Bloomberg Barclays data provided by Bloomberg. US long-term bonds, bills, inflation, and fixed income factor data Stocks, Bonds, Bills, and Inflation (SBBI) Yearbook ,Ibbotson Associates, Chicago (annually updated work by Roger G. Ibbotson and Rex A. Sinquefield). FTSE fixed income indices 2020 FTSE Fixed Income LLC, all rightsreserved. ICE BofA index data 2020 ICE Data Indices, LLC. S&P data 2020 S&P Dow Jones Indices LLC, a division of S&P Global. All rights reserved.15
Global Fixed IncomeFirst Quarter 2020 Yield CurvesGovernment bond interest rates in the globaldeveloped markets generally decreased during thequarter.Longer-term bonds generally outperformed shorterterm bonds in the global developed markets.Short- and intermediate-term nominal interest ratesare negative in Japan and Germany.USChanges in Yields (bps) since 201.00.0Yield (%)Yield 0Y30Y1Y5YYears to 1/20200.0Yield (%)Yield (%)20YYears to 5Y10Y20Y30Y1Y5YYears to Maturity10Y20Y30YYears to 31/20201.00.0-1.0Yield (%)Yield Y1Y5YYears to MaturityOne basis point (bps) equals 0.01%. Source: ICE BofA government yield. ICE BofA index data 2020 ICE Data Indices, LLC.10Y20Y30YYears to Maturity16
Impact of DiversificationFirst Quarter 2020These portfolios illustrate theperformance of different globalstock/bond mixes and highlight thebenefits of diversification. Mixes withlarger allocations to stocks areconsidered riskier but have higherexpected returns over time.Ranked Returns (%)100% Treasury Bills0.37-5.2925/75-10.7850/50-16.1075/25100% Stocks-21.26Period Returns (%)* Annualized10-Year1 Year 3 Years** 5 Years** 10 Years** STDEV¹Asset ClassQTR100% Treasury .10-7.392.173.015.1410.50100% Stocks-21.26-10.762.053.416.4514.00Growth of Wealth: The Relationship between Risk and ReturnStock/Bond Mix 120,000100% Stocks 100,000 80,00075/25 60,00050/50 40,00025/75100% Treasury Bills 20,000 1. STDEV (standard deviation) is a measure of the variation or dispersion of a set of data points. Standard deviations are often used to quantify the historical return volatility of asecurity or portfolio.Diversification does not eliminate the risk of market loss. Past performance is not a guarantee of future results. Indices are not available for direct investment. Indexperformance does not reflect expenses associated with the management of an actual portfolio. Asset allocations and the hypothetical index portfolio returns are forillustrative purposes only and do not represent actual performance. Global Stocks represented by MSCI All Country World Index (gross div.) and Treasury Bills represented by USOne-Month Treasury Bills. Globally diversified allocations rebalanced monthly, no withdrawals. Data MSCI 2020, all rights reserved. Treasury bills Stocks, Bonds, Bills, andInflation Yearbook , Ibbotson Associates, Chicago (annually updated work by Roger G. Ibbotson and Rex A. Sinquefield).17
DisclosuresA basis point is the smallest measure used in quoting yields or interest rates. One basis point is equal to one one-hundredth of one percentage point (0.01%).There is no guarantee that a diversified portfolio will enhance overall returns or outperform a non-diversified portfolio. Diversification does not protect against market risk.Bonds are subject to market and interest rate risk if sold prior to maturity. Bond values will decline as interest rates rise and bonds are subject to availability and change inprice. Bond yields are subject to change. Certain call or special redemption features may exist which could impact yield.The price of equity securities may rise or fall because of changes in the broad market or changes in a company’s financial condition, sometimes rapidly or unpredictably.These price movements may result from factors affecting individual companies, sectors or industries, or the securities market as a whole, such as changes in economic orpolitical conditions. Equity securities are subject to “stock market risk” meaning that stock prices in general may decline over short or extended periods of time.Investments in emerging markets can be more volatile. As mentioned above, the normal risks of investing in foreign countries are heightened when investing in emergingmarkets. In addition, the small size of securities markets and the low trading volume may lead to a lack of liquidity, which leads to increased volatility. Also, emergingmarkets may not provide adequate legal protection for private or foreign investment or private property.Investments in commodities may have greater volatility than investments in traditional securities, particularly if the instruments involve leverage. The value ofcommodity-linked derivative instruments may be affected by changes in overall market movements, commodity index volatility, changes in interest rates, or factors affectinga particular industry or commodity, such as drought, floods, weather, livestock disease, embargoes, tariffs and international economic, political and regulatory developments.Use of leveraged commodity-linked derivatives creates an opportunity for increased return but, at the same time, creates the possibility for greater loss.Real estate investments may be subject to a higher degree of market risk because of concentration in a specific industry, sector or geographical sector. Real estateinvestments may be subject to risks including, but not limited to, declines in the value of real estate, risks related to general and economic conditions, changes in the valueof the underlying property owned by the trust and defaults by borrower. Investing in Real Estate Investment Trusts (REITs) involves special risks such as potential illiquidityand may not be suitable for all investors. There is no assurance that the investment objectives of this program will be attained.International investing involves a greater degree of risk and increased volatility. Changes in currency exchange rates and differences in accounting and taxation policiesoutside the U.S. can raise or lower returns. Also, some overseas markets may not be as politically and economically stable as the United States and other nations.Treasury inflation-protected securities (TIPS) help eliminate inflation risk to your portfolio as the principal is adjusted semiannually for inflation based on the ConsumerPrice Index – while providing a real rate of return guaranteed by the U.S. Government. Treasury Inflation-Protected Securities, or TIPS, are subject to market risk andsignificant interest rate risk as their longer duration makes them more sensitive to price declines associated with higher interest rates.World Market Capitalization refers to the total dollar market value that a country makes up, as a whole of the global markets.All indexes are unmanaged, and an individual cannot invest directly in an index Unmanaged index returns do not reflect fees, expenses, or sales charges.Index performance is not indicative of the performance of any investment. Past performance is no guarantee of future results.Russell 1000 Index consists of the 1,000 largest securities in the Russell 3000 Index, which represents approximately 90% of the total market capitalization of the Russell3000 Index. It is a large-cap, market-oriented index and is highly correlated with the S&P 500 Index.Russell 2000 Index measures the performance of the 2,000 smallest companies in the Russell 3000 Index.Russell 3000 Index measures the performance of the 3,000 largest U.S. companies based on total market capitalization.Russell 1000 Value Index measures the performance of the large-cap value segment of the U.S. equity universe. It includes those Russell 1000 companies with lowerprice-to-book ratios and lower expected growth values. The index is unmanaged, includes the reinvestment of dividends and cannot be purchased directly by investors.Russell 2000 Value Index measures the performance of those Russell 2000 companies with lower price-to-book ratios and lower forecasted growth values.Russell 3000 Growth Index measures the performance of those Russell 3000Index companies with higher price-to-book ratios and higherforecasted growthvalues. The stocks in this index are also members of either the Russell 1000 Growthor the Russell 2000 Growth indexes.
DisclosuresMSCI World ex USA Index captures large and mid cap representation across 22 of 23 Developed Markets (DM) countries*--excluding the United States. With 1,005constituent
Growth Index). World Market Cap represented by Russell 3000 Index, MSCI World ex USA IMI Index, and MSCI Emerging Markets IMI Index. Russell 3000 Index is used as the proxy for the US market. Dow Jones US Select REIT Index used as proxy for the US REIT market. Frank Russell Company is source and owner of trademarks, service marks, and copyrights