Transcription
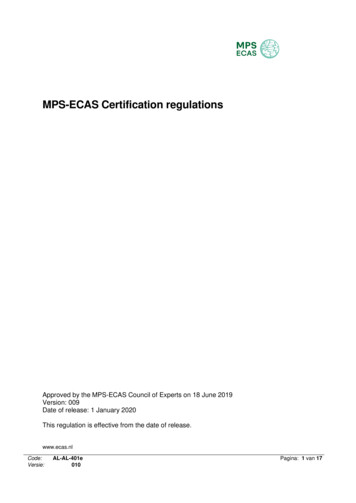
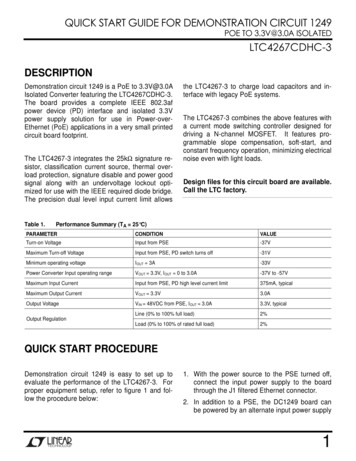
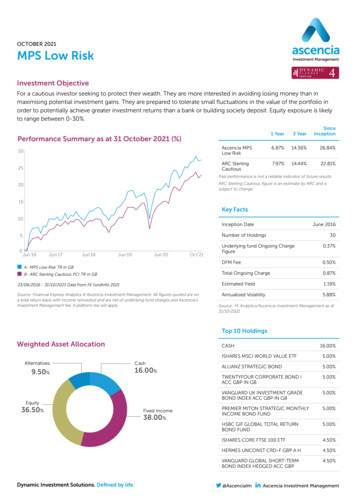
OCTOBER 2021MPS Low RiskInvestment ObjectiveFor a cautious investor seeking to protect their wealth. They are more interested in avoiding losing money than inmaximising potential investment gains. They are prepared to tolerate small fluctuations in the value of the portfolio inorder to potentially achieve greater investment returns than a bank or building society deposit. Equity exposure is likelyto range between 0-30%.Performance Summary as at 31 October 2021 (%)1 Year3 YearSinceInception30Ascencia MPSLow Risk6.87%14.36%26.84%25ARC SterlingCautious7.97%14.44%22.81%Past performance is not a reliable indicator of future results.ARC Sterling Cautious figure is an estimate by ARC and issubject to change.2015Key Facts10Inception DateJune 2016Number of Holdings530Underlying fund Ongoing ChargeFigure0.37%DFM Fee0.50%Total Ongoing Charge0.87%23/06/2016 - 31/10/2021 Data from FE fundinfo 2021Estimated Yield1.19%Source: Financial Express Analytics & Ascencia Investment Management. All figures quoted are ona total return basis with income reinvested and are net of underlying fund charges and Ascencia’sInvestment Management fee. A platform fee will apply.Annualised n’20Oct’21A - MPS Low Risk TR in GBB- ARC Sterling Cautious PCI TR in GBSource: FE Analytics/Ascencia Investment Management as at31/10/2021Top 10 HoldingsWeighted Asset 50%Dynamic Investment Solutions. Defined by life.Fixed Income38.00%16.00%ISHARES MSCI WORLD VALUE ETF5.00%ALLIANZ STRATEGIC BOND5.00%TWENTYFOUR CORPORATE BOND IACC GBP IN GB5.00%VANGUARD UK INVESTMENT GRADEBOND INDEX ACC GBP IN GB5.00%PREMIER MITON STRATEGIC MONTHLYINCOME BOND FUND5.00%HSBC GIF GLOBAL TOTAL RETURNBOND FUND5.00%ISHARES CORE FTSE 100 ETF4.50%HERMES UNCONST CRD-F GBP A H4.50%VANGUARD GLOBAL SHORT-TERMBOND INDEX HEDGED ACC GBP4.50%@AscenciaImAscencia Investment Management
Risk and Reward ProfileInvestment PlatformsLower risk(typically lowerrewards)Higher risk12345678910(typically higherrewards)The risk and reward category is not guaranteed to remain unchanged and may shift overtime.The portfolios can be held on the followingplatforms:› 7IM› Hubwise› FusionA central model is created for each of our model portfolios, where the performance summary, asset allocation, fundholdings, charges and yield quoted on this factsheet are based on the central model portfolio. Where the centralmodel is replicated, such as through a platform, any individual portfolio is unlikely to be identical to that of the centralmodel as a result of the timing of the investment or any restrictions of the platform provider.Investment TeamSimon CallowAnthony HoltChris CaveneyDirector of Investment SolutionsManager of Investment SolutionsInvestment ManagerThe information provided is not to be treated as specific advice. It has no regard for the specific investment objectives, financial situation or needs of any specificperson or entity. The investments discussed in this document may not be suitable for all investors. Investors should make their own investment decisions based upontheir own financial objectives and financial resources and, if in any doubt, should seek advice from an investment adviser.Ascencia Investment Management Limited is a subsidiary of Frenkel Topping Group Plc and is authorised and regulated by the Financial Conduct AuthorityNo: 409409. Ascencia Investment Management Limited Registered in England No: 05010380.Past performance is not a guide to future performance. The value of investments and any income from them can fall and you may get back less than you invested. Ifyou invest in currencies other than your own, fluctuations in currency value will mean that the value of your investment will move independently of the underlyingasset. Investors should be aware of the additional risks associated with funds investing in smaller companies.Dynamic Investment Solutions. Defined by life.@AscenciaImAscencia Investment Management
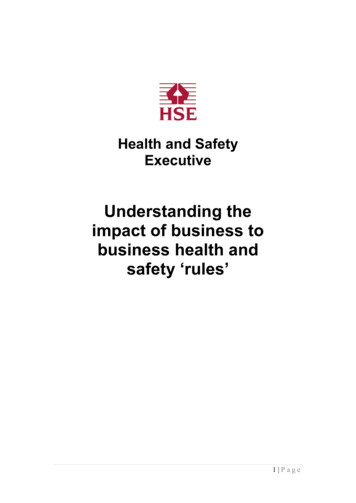
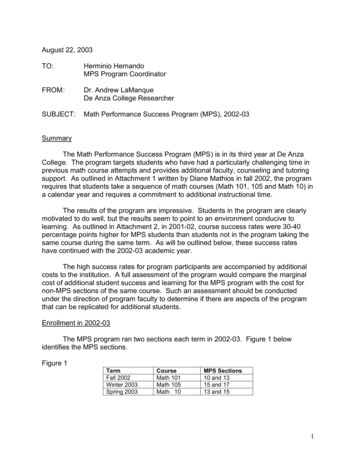
OCTOBER 2021MPS Low to Medium RiskInvestment ObjectiveFor a conservative investor seeking to maintain their capital. They are prepared to accept a lower investment return thanequity markets over the longer term in exchange for trying to minimise potential losses. They accept that the portfoliowill be subject to fluctuations in value over the medium-to-longer term. Equity exposure is likely to range between30–55%.1 Year3 YearSinceInceptionAscencia MPSLow to MediumRisk11.00%19.82%39.74%ARC SterlingBalanced13.98%20.77%35.84%Performance Summary as at 31 October 2021 (%)5040Past performance is not a reliable indicator of future results.30ARC Sterling Balanced Asset figure is an estimate by ARC and issubject to change.20Key FactsInception Date10June 2016Number of ct’21A - MPS Low to Medium Risk TR in GBB- ARC Sterling Balanced Asset23/06/2016 - 31/10/20201 Data from FE fundinfo 2021Source: Financial Express Analytics & Ascencia Investment Management. All figures quoted are ona total return basis with income reinvested and are net of underlying fund charges and Ascencia’sInvestment Management fee. A platform fee will apply.31Underlying fund Ongoing ChargeFigure0.47%DFM Fee0.50%Total Ongoing Charge0.97%Estimated Yield0.85%Annualised Volatility7.77%Source: FE Analytics/Ascencia Investment Management as at31/10/2021Top 10 HoldingsWeighted Asset 50%Dynamic Investment Solutions. Defined by life.Fixed Income28.00%13.00%ISHARES MSCI WORLD VALUE ETF5.50%HSBC GIF GLOBAL TOTAL RETURNBOND FUND5.00%ISHARES CORE S&P 500 ETF5.00%ISHARES MSCI SRI USA5.00%PREMIER MITON STRATEGIC MONTHLYINCOME BOND FUND4.50%ISHARES CORE FTSE 100 ETF4.50%TWENTYFOUR CORPORATE BOND IACC GBP IN GB4.00%VANGUARD UK INVESTMENT GRADEBOND INDEX ACC GBP IN GB4.00%ISHARES MSCI JAPAN SRI4.00%@AscenciaImAscencia Investment Management
Risk and Reward ProfileInvestment PlatformsLower risk(typically lowerrewards)Higher risk12345678910(typically higherrewards)The risk and reward category is not guaranteed to remain unchanged and may shift overtime.The portfolios can be held on the followingplatforms:› 7IM› Hubwise› FusionA central model is created for each of our model portfolios, where the performance summary, asset allocation, fundholdings, charges and yield quoted on this factsheet are based on the central model portfolio. Where the centralmodel is replicated, such as through a platform, any individual portfolio is unlikely to be identical to that of the centralmodel as a result of the timing of the investment or any restrictions of the platform provider.Investment TeamSimon CallowAnthony HoltChris CaveneyDirector of Investment SolutionsManager of Investment SolutionsInvestment ManagerThe information provided is not to be treated as specific advice. It has no regard for the specific investment objectives, financial situation or needs of any specificperson or entity. The investments discussed in this document may not be suitable for all investors. Investors should make their own investment decisions based upontheir own financial objectives and financial resources and, if in any doubt, should seek advice from an investment adviser.Ascencia Investment Management Limited is a subsidiary of Frenkel Topping Group Plc and is authorised and regulated by the Financial Conduct AuthorityNo: 409409. Ascencia Investment Management Limited Registered in England No: 05010380.Past performance is not a guide to future performance. The value of investments and any income from them can fall and you may get back less than you invested. Ifyou invest in currencies other than your own, fluctuations in currency value will mean that the value of your investment will move independently of the underlyingasset. Investors should be aware of the additional risks associated with funds investing in smaller companies.Dynamic Investment Solutions. Defined by life.@AscenciaImAscencia Investment Management
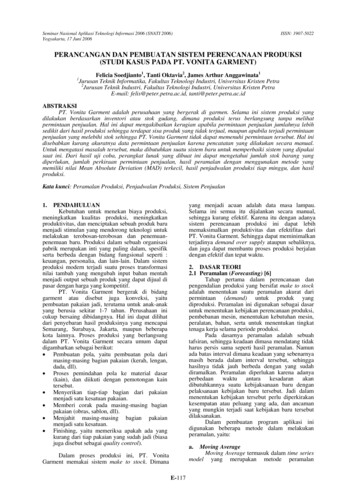
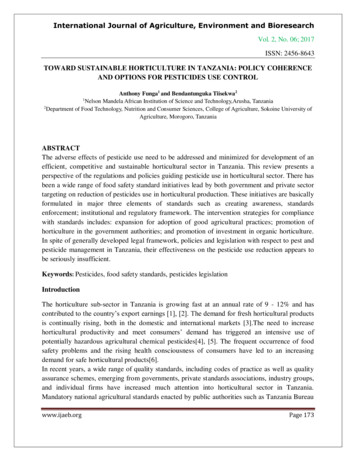
OCTOBER 2021MPS Medium RiskInvestment ObjectiveFor clients who aim to achieve a greater investment return from the portfolio. They are prepared to own a significantproportion of higher-risk investments in order to try to produce a higher investment return. They are prepared to acceptthat the value of the portfolio may fluctuate significantly in order to achieve potentially greater investment returns overthe longer term. Equity exposure is likely to range between 55-75%.Performance Summary as at 31 October 2021 (%)601 Year3 YearSinceInception50Ascencia MPSMedium Risk14.99%21.73%48.08%40ARC SterlingSteady Growth18.98%26.63%50.14%Past performance is not a reliable indicator of future results.30ARC Sterling Steady Growth figure is an estimate by ARC and issubject to change.20Key Facts100Jun‘16Inception DateJun’17Jun’18Jun’19Jun’20Oct’21A - MPS Medium Risk TR in GBJune 2016Number of Holdings31Underlying fund Ongoing ChargeFigure0.51%23/06/2016 - 31/10/2021 Data from FE fundinfo 2021DFM Fee0.50%Source: Financial Express Analytics & Ascencia Investment Management. All figures quoted are ona total return basis with income reinvested and are net of underlying fund charges and Ascencia’sInvestment Management fee. A platform fee will apply.Total Ongoing Charge1.01%Estimated Yield0.97%B- ARC Sterling Steady GrowthAnnualised Volatility10.25%Source: FE Analytics/Ascencia Investment Management as at31/10/2021Weighted Asset AllocationAlternatives9.50%Top 10 HoldingsCash7.50%Fixed IncomeEquity62.50%Dynamic Investment Solutions. Defined by life.20.50%CASH7.50%ISHARES CORE S&P 500 ETF7.00%ISHARES MSCI WORLD VALUE ETF6.00%ISHARES MSCI SRI USA6.00%ISHARES CORE FTSE 100 ETF5.50%ISHARES MSCI JAPAN SRI5.00%HSBC GIF GLOBAL TOTAL RETURNBOND FUND4.50%ISHARES EMERGING MARKET SRI ETF4.00%PREMIER MITON STRATEGIC MONTHLYINCOME BOND FUND3.00%ALLIANZ STRATEGIC BOND3.00%@AscenciaImAscencia Investment Management
Risk and Reward ProfileInvestment PlatformsLower risk(typically lowerrewards)Higher risk12345678910(typically higherrewards)The risk and reward category is not guaranteed to remain unchanged and may shift overtime.The portfolios can be held on the followingplatforms:› 7IM› Hubwise› FusionA central model is created for each of our model portfolios, where the performance summary, asset allocation, fundholdings, charges and yield quoted on this factsheet are based on the central model portfolio. Where the centralmodel is replicated, such as through a platform, any individual portfolio is unlikely to be identical to that of the centralmodel as a result of the timing of the investment or any restrictions of the platform provider.Investment TeamSimon CallowAnthony HoltChris CaveneyDirector of Investment SolutionsManager of Investment SolutionsInvestment ManagerThe information provided is not to be treated as specific advice. It has no regard for the specific investment objectives, financial situation or needs of any specificperson or entity. The investments discussed in this document may not be suitable for all investors. Investors should make their own investment decisions based upontheir own financial objectives and financial resources and, if in any doubt, should seek advice from an investment adviser.Ascencia Investment Management Limited is a subsidiary of Frenkel Topping Group Plc and is authorised and regulated by the Financial Conduct AuthorityNo: 409409. Ascencia Investment Management Limited Registered in England No: 05010380.Past performance is not a guide to future performance. The value of investments and any income from them can fall and you may get back less than you invested. Ifyou invest in currencies other than your own, fluctuations in currency value will mean that the value of your investment will move independently of the underlyingasset. Investors should be aware of the additional risks associated with funds investing in smaller companies.Dynamic Investment Solutions. Defined by life.@AscenciaImAscencia Investment Management
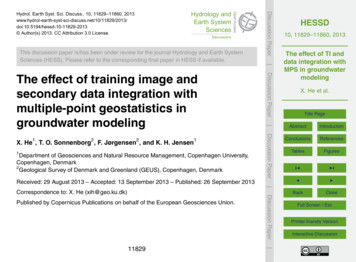
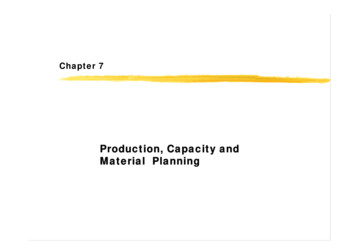
HighOCTOBER 2021MPS Medium to High RiskInvestment ObjectiveFor clients who aim to achieve larger investments gains. They are prepared to own a very significant proportion ofhigher risk investments in order to try and achieve large investment gains. Most of their portfolio will be invested in riskyinvestments. They are willing (and can afford) to sustain significant investment losses over a prolonged period of time inorder to potentially achieve better long-term investment returns. Equity exposure is likely to range between 75–95%.1 Year3 YearSinceInception19.58%30.97%67.08%70Ascencia MPSMedium to HighRisk60ARC Sterling EquityRisk24.01%33.17%63.40%Performance Summary as at 31 October 2021 (%)8050Past performance is not a reliable indicator of future results.40ARC Sterling Equity Risk figure is an estimate by ARC and issubject to change.30Key Facts20Inception Date10Number of ct’21A - MPS Medium to High Risk TR in GBB- ARC Sterling Equity Risk23/06/2016 - 31/10/2021 Data from FE fundinfo 2021Source: Financial Express Analytics & Ascencia Investment Management. All figures quoted are ona total return basis with income reinvested and are net of underlying fund charges and Ascencia’sInvestment Management fee. A platform fee will apply.DFM Fee0.50%Total Ongoing Charge0.89%Estimated Yield1.06%Annualised Volatility12.49%Source: FE Analytics/Ascencia Investment Management as at31/10/20218.00%4.50%ISHARES MSCI SRI USA7.00%ISHARES MSCI WORLD VALUE ETF6.50%ISHARES CORE FTSE 100 ETF6.50%ISHARES MSCI JAPAN SRI6.00%ISHARES EMERGING MARKET SRI ETF5.00%CASH4.50%HSBC GIF GLOBAL TOTAL RETURN BONDFUND4.50%HSBC ASIA PACIFIC EX JAPAN SUSTAINEQ UCITS ETF4.00%LIONTRUST SUSTAINABLE FUTUREEUROPEAN GROWTH 2 ACC4.00%10.00%Dynamic Investment Solutions. Defined by life.0.39%ISHARES CORE S&P 500 ETFFixed Income76.00%Underlying fund Ongoing ChargeFigureCash9.50%Equity27Top 10 HoldingsWeighted Asset AllocationAlternativesJune 2016@AscenciaImAscencia Investment Management
Risk and Reward ProfileInvestment PlatformsLower risk(typically lowerrewards)Higher risk12345678910(typically higherrewards)The risk and reward category is not guaranteed to remain unchanged and may shift overtime.The portfolios can be held on the followingplatforms:› 7IM› Hubwise› FusionA central model is created for each of our model portfolios, where the performance summary, asset allocation, fundholdings, charges and yield quoted on this factsheet are based on the central model portfolio. Where the centralmodel is replicated, such as through a platform, any individual portfolio is unlikely to be identical to that of the centralmodel as a result of the timing of the investment or any restrictions of the platform provider.Investment TeamSimon CallowAnthony HoltChris CaveneyDirector of Investment SolutionsManager of Investment SolutionsInvestment ManagerThe information provided is not to be treated as specific advice. It has no regard for the specific investment objectives, financial situation or needs of any specificperson or entity. The investments discussed in this document may not be suitable for all investors. Investors should make their own investment decisions based upontheir own financial objectives and financial resources and, if in any doubt, should seek advice from an investment adviser.Ascencia Investment Management Limited is a subsidiary of Frenkel Topping Group Plc and is authorised and regulated by the Financial Conduct AuthorityNo: 409409. Ascencia Investment Management Limited Registered in England No: 05010380.Past performance is not a guide to future performance. The value of investments and any income from them can fall and you may get back less than you invested. Ifyou invest in currencies other than your own, fluctuations in currency value will mean that the value of your investment will move independently of the underlyingasset. Investors should be aware of the additional risks associated with funds investing in smaller companies.Dynamic Investment Solutions. Defined by life.@AscenciaImAscencia Investment Management
OCTOBER 2021MPS High RiskInvestment ObjectiveFor clients who aim to maximise investment returns over the long term. They are prepared to be fully invested in equitiesor other higher risk investments to potentially achieve the highest possible investment returns. They are willing to sustainand can afford substantial investment losses over a prolonged period of time.1 Year3 YearSinceInceptionAscencia MPS HighRisk21.06%32.84%72.56%ARC Sterling EquityRisk24.01%33.17%63.40%Performance Summary as at 31 October 2021 (%)80706050Past performance is not a reliable indicator of future results.40ARC Sterling Equity Risk figure is an estimate by ARC and issubject to change.30Key Facts20Inception Date10June 2016Number of ct’21A - MPS High Risk TR in GB23Underlying fund Ongoing ChargeFigure0.39%DFM Fee0.50%Total Ongoing Charge0.89%Estimated Yield0.96%B- ARC Sterling Equity Risk23/06/2016 - 31/10/2021 Data from FE fundinfo 2021Source: Financial Express Analytics & Ascencia Investment Management. All figures quoted are ona total return basis with income reinvested and are net of underlying fund charges and Ascencia’sInvestment Management fee. A platform fee will apply.Annualised Volatility13.29%Source: FE Analytics/Ascencia Investment Management as at31/10/2021Weighted Asset AllocationAlternatives5.00%Top 10 HoldingsCash4.00%Fixed Income3.00%Equity88.00%Dynamic Investment Solutions. Defined by life.ISHARES CORE S&P 500 ETF9.00%ISHARES MSCI SRI USA8.00%ISHARES MSCI WORLD VALUE ETF7.50%ISHARES MSCI JAPAN SRI7.00%ISHARES CORE FTSE 100 ETF6.50%ISHARES EMERGING MARKET SRI ETF6.00%LIONTRUST SUSTAINABLE FUTUREEUROPEAN GROWTH 2 ACC5.00%X-TRACKERS MSCI WORLD HEALTHCARE ETF5.00%CASH4.00%HSBC ASIA PACIFIC EX JAPAN SUSTAINEQ UCITS ETF4.00%@AscenciaImAscencia Investment Management
Risk and Reward ProfileInvestment PlatformsLower risk(typically lowerrewards)Higher risk12345678910(typically higherrewards)The risk and reward category is not guaranteed to remain unchanged and may shift overtime.The portfolios can be held on the followingplatforms:› 7IM› Hubwise› FusionA central model is created for each of our model portfolios, where the performance summary, asset allocation, fundholdings, charges and yield quoted on this factsheet are based on the central model portfolio. Where the centralmodel is replicated, such as through a platform, any individual portfolio is unlikely to be identical to that of the centralmodel as a result of the timing of the investment or any restrictions of the platform provider.Investment TeamSimon CallowAnthony HoltChris CaveneyDirector of Investment SolutionsManager of Investment SolutionsInvestment ManagerThe information provided is not to be treated as specific advice. It has no regard for the specific investment objectives, financial situation or needs of any specificperson or entity. The investments discussed in this document may not be suitable for all investors. Investors should make their own investment decisions based upontheir own financial objectives and financial resources and, if in any doubt, should seek advice from an investment adviser.Ascencia Investment Management Limited is a subsidiary of Frenkel Topping Group Plc and is authorised and regulated by the Financial Conduct AuthorityNo: 409409. Ascencia Investment Management Limited Registered in England No: 05010380.Past performance is not a guide to future performance. The value of investments and any income from them can fall and you may get back less than you invested. Ifyou invest in currencies other than your own, fluctuations in currency value will mean that the value of your investment will move independently of the underlyingasset. Investors should be aware of the additional risks associated with funds investing in smaller companies.Dynamic Investment Solutions. Defined by life.@AscenciaImAscencia Investment Management
ishares msci world value etf 5.00% allianz strategic bond 5.00% twentyfour corporate bond i acc gbp in gb 5.00% vanguard uk investment grade bond index acc gbp in gb 5.00% premier miton strategic monthly income bond fund 5.00% hsbc gif global total return bond fund 5.00% ishares core ftse 100 etf 4.50% hermes unconst crd-f gbp a h 4.50%