Transcription
Endogenous Entry, Product Variety, and Business CyclesAuthor(s): Florin O. Bilbiie, Fabio Ghironi, and Marc J. MelitzReviewed work(s):Source: Journal of Political Economy, Vol. 120, No. 2 (April 2012), pp. 304-345Published by: The University of Chicago PressStable URL: http://www.jstor.org/stable/10.1086/665825 .Accessed: 07/06/2012 09:24Your use of the JSTOR archive indicates your acceptance of the Terms & Conditions of Use, available at ms.jspJSTOR is a not-for-profit service that helps scholars, researchers, and students discover, use, and build upon a wide range ofcontent in a trusted digital archive. We use information technology and tools to increase productivity and facilitate new formsof scholarship. For more information about JSTOR, please contact support@jstor.org.The University of Chicago Press is collaborating with JSTOR to digitize, preserve and extend access to Journalof Political Economy.http://www.jstor.org
Endogenous Entry, Product Variety, andBusiness CyclesFlorin O. BilbiieParis School of Economics, Université Paris 1 Panthéon-Sorbonne, and Centre for Economic PolicyResearchFabio GhironiBoston College, Federal Reserve Bank of Boston, and National Bureau of Economic ResearchMarc J. MelitzHarvard University, Centre for Economic Policy Research, and National Bureau of EconomicResearchThis paper builds a framework for the analysis of macroeconomicfluctuations that incorporates the endogenous determination of thenumber of producers and products over the business cycle. EconomicPreviously circulated under the title “Business Cycles and Firm Dynamics” and firstpresented in the summer of 2004. For helpful comments, we thank Robert Shimer, twoanonymous referees, Susanto Basu, Christian Broda, Sanjay Chugh, Andrea Colciago,Diego Comin, Fiorella De Fiore, Massimo Giovannini, Jean-Olivier Hairault, Robert Hall,Kólver Hernández, Boyan Jovanovic, Nobuhiro Kiyotaki, Oleksiy Kryvtsov, Philippe Martin,Kris Mitchener, José-Vı́ctor Rı́os-Rull, Nicholas Sim, Viktors Stebunovs, Michael Woodford,and participants in many conferences and seminars. We are grateful to Brent Bundick,Massimo Giovannini, Nicholas Sim, Viktors Stebunovs, and Pinar Uysal for excellent research assistance. Remaining errors are our responsibility. Bilbiie thanks the NBER, theCentre for Economic Performance at London School of Economics, and the EuropeanCentral Bank for hospitality in the fall of 2006, 2005, and summer of 2004, respectively;Nuffield College at Oxford for financial support during the 2004–7 period; and Banquede France for financial support through the Chaire Banque de France at the Paris Schoolof Economics. Ghironi and Melitz thank the National Science Foundation for financialsupport through a grant to the NBER. The views expressed in this paper are those of theauthors and do not necessarily reflect those of Banque de France, the Federal ReserveBank of Boston, or Federal Reserve policy.[Journal of Political Economy, 2012, vol. 120, no. 2]䉷 2012 by The University of Chicago. All rights reserved. 0022-3808/2012/12002-0004 10.00304
endogenous entry305expansions induce higher entry rates by prospective entrants subjectto sunk investment costs. The sluggish response of the number ofproducers generates a new and potentially important endogenouspropagation mechanism for business cycle models. The return to investment determines household saving decisions, producer entry, andthe allocation of labor across sectors. Our framework replicates severalfeatures of business cycles and predicts procyclical profits even forpreference specifications that imply countercyclical markups.I.IntroductionThis paper studies the role of endogenous producer entry and creationof new products in propagating business cycle fluctuations. Toward thatgoal, we develop a dynamic, stochastic, general equilibrium model withmonopolistic competition, consumer love for variety, and sunk entrycosts. We seek to understand the contributions of the intensive andextensive margins—changes in production of existing goods and in therange of available goods—to the response of the economy to changesin aggregate productivity.Empirically, new products are introduced not only by new firms butalso by existing firms (most often at their existing production facilities).We therefore take a broad view of producer entry (and exit) as alsoincorporating product creation (and destruction) by existing firms, although our model does not address the determinants of product varietywithin firms. Even though new firms account for a small share of overallproduction (for US manufacturing, new firms account for 2–3 percentof both overall production and employment), the contribution of newproducts (including those produced at existing firms) is substantiallylarger—important enough to be a major source of aggregate outputchanges. Furthermore, as is the case with firm entry, new product creation is also very strongly procyclical.1The important contribution of product creation and destruction toaggregate output is convincingly documented in a recent paper by Bernard, Redding, and Schott (2010), who are the first to measure productcreation and destruction within firms across a large portion of the USeconomy (all US manufacturing firms). For each firm, they record production levels (dollar values) across five-digit US Standard IndustrialClassification (SIC) categories, which still represent a very coarse defi1The working paper version of this study (Bilbiie, Ghironi, and Melitz 2007) containsevidence on the procyclicality of net firm entry (measured as new incorporations minusfailures) and profits for the period 1947–98. Our conclusions there are in line with thepioneering work of Dunne, Roberts, and Samuelson (1988). Here, we focus on productcreation rather than firm entry.
306journal of political economy2nition of products. Bernard et al. first document that 94 percent ofproduct additions by US manufacturing firms occur within their preexisting production facilities (as opposed to new plants or via mergersand acquisitions). They further show that 68 percent of firms changetheir product mix within a 5-year census period (representing 93 percentof firms weighted by output). Of these firms, 66 percent both add anddrop products (representing 87 percent of firms weighted by output).Thus, product creation over time is not just a secular trend at the firmlevel (whereby firms steadily increase the range of products they produceover time). Most important, Bernard et al. show that product creationand destruction account for important shares of overall production:over a 5-year period—a horizon usually associated with the length ofbusiness cycles—the value of new products (produced at existing firms)is 33.6 percent of overall output during that period ( 30.4 percent ofoutput for the lost value from product destruction at existing firms).These numbers are almost twice (1.8 times) as large as those accountedfor by changes at the intensive margin: production increases and decreases for the same product at existing firms. The overall contributionof the extensive margin (product creation and destruction) would beeven higher if a finer level of product disaggregation (beyond the fivedigit level) were available.3Put together, product creation (by both existing firms and new firms)accounts for 46.6 percent of output in a 5-year period, and the lost valuefrom product destruction (by existing and exiting firms) accounts for44 percent of output. This represents a minimal annual contributionof 9.3 percent (for product creation) and 8.8 percent (for productdestruction). The actual annual contributions are likely larger, not onlybecause the coarse definition of a product potentially misses much product creation and destruction within the five-digit SIC category but alsobecause additions to and subtractions from output across years withinthe same 5-year interval (for a given firm-product combination) are notrecorded. Relatedly, Den Haan and Sedlacek (2010) estimate the contribution of the extensive margin (measured along the employmentdimension) to total value added. They calculate the contribution of“cyclical workers” (workers who during the period under scrutiny ex2As an example, the five-digit SIC codes within the four-digit SIC category 3949 (sporting and athletics goods) are 39491 (fishing tackle and equipment), 39492 (golf equipment), 39493 (playground equipment), 39494 (gymnasium and exercise equipment), and39495 (other sporting and athletic goods). For all of US manufacturing, there are 1,848five-digit products.3In the example of five-digit SIC 39494 (gymnasium and exercise equipment) fromthe previous footnote, any production of a new equipment product, whether a treadmill,an elliptical machine, a stationary bike, or any weight machine, would be recorded asproduction of the same product and hence be counted toward the intensive margin ofproduction.
endogenous entry307perienced a nonemployment spell) over a 3-year interval for Germanyand the United States and find that this amounts to roughly half of totalvalue added.The substantial contribution of product creation and destruction isalso confirmed by Broda and Weinstein (2010), who measure productsat the finest possible level of disaggregation: the product bar code. Theirdata cover all the purchases of products with bar codes by a representative sample of US consumers. An important feature of the evidencein Bernard et al. (2010) is confirmed by Broda and Weinstein’s highlydisaggregated data: 92 percent of product creation occurs within existing firms. Broda and Weinstein find that 9 percent of the consumers’purchases in a year are devoted to new goods not previously available.4Similarly to Bernard et al., Broda and Weinstein find that the marketshare of new products is four times larger than the market share of newfirms (measured in terms of either output or employment), preciselybecause most product creation occurs within the firm (the same conclusion arises for product destruction vs. firm exit). Furthermore, Brodaand Weinstein report that this product creation is strongly procyclicalat a quarterly business cycle frequency. The evidence on the strongprocyclicality of product creation is also confirmed by Axarloglou (2003)for US manufacturing at a monthly frequency.In our model, we assume symmetric, homothetic preferences over acontinuum of goods. This nests several tractable specifications (including constant elasticity of substitution [CES]) as special cases. To keepthe setup simple, we do not model multiproduct firms. In our modelpresentation below and in the discussion of results, there is a one-toone identification between a producer, a product, and a firm. This isconsistent with much of the macroeconomic literature with monopolistic competition, which similarly uses “firm” to refer to the producerof an individual good. However, the relevant profit-maximizing unit inour setup is best interpreted as a production line, which could be nestedwithin a multiproduct firm. The boundary of the firm across productsis then not determined. Strategic interactions (within and across firms)do not arise because of our assumption of a continuum of goods aslong as each multiproduct firm produces a countable set of goods ofmeasure 0.5 In this interpretation of our model, producer entry and4This 9 percent figure is low relative to its 9.3 percent counterpart from Bernard etal. (2010), given the substantial difference in product disaggregation across the two studies(the extent of product creation increases monotonically with the level of product disaggregation). We surmise that this is due to the product sampling of Broda and Weinstein’s(2010) data: including only final goods with bar codes. Food items, which have the lowestlevels of product creation rates, tend to be overrepresented in those samples.5This differentiates our approach from that of Jaimovich and Floetotto (2008), whoassume a discrete set of producers within each sector. In that case, the boundaries of firmscrucially determine the strategic interaction between individual competitors.
308journal of political economyexit capture the product-switching dynamics within firms documentedby Bernard et al. (2010).In our baseline setup, each individual producer/firm produces outputusing only labor. However, the number of firms that produce in eachperiod can be interpreted as the capital stock of the economy, and thedecision of households to finance entry of new firms is akin to thedecision to accumulate physical capital in the standard real businesscycle (RBC) model. Product creation (or, more broadly, entry) takesplace subject to sunk product development costs, which are paid byinvestors in the expectation of future profits. Free entry equates thevalue of a product (the present discounted value of profits) to the sunkcost; subsequent to entry, the per-period profits fluctuate endogenously.This distinguishes our framework from earlier studies that modeledentry in a frictionless way: there, entry drives profits to zero in everyperiod. (We discuss the relation between our work and these studieslater on.) Our framework is hence closer to that of variety-based endogenous growth models (see, e.g., Romer 1990; Aghion and Howitt1991; Grossman and Helpman 1991). Indeed, just as the RBC model isa discrete-time, stochastic, general equilibrium version of the exogenousgrowth model that abstracts from growth to focus on business cycles,our model can be viewed as a discrete-time, stochastic, general equilibrium version of variety-based, endogenous growth models that abstractsfrom endogenous growth (we discuss in greater detail further on whywe have chosen to abstract from growth).From a conceptual standpoint, linking innovation-based growth andbusiness cycle theory is not new: the history of this idea goes back atleast to Schumpeter (1934). Aghion and Howitt (1991) review someattempts at unifying growth and business cycles. Shleifer’s (1986) theoryof implementation cycles is one example of the conceptual link between(endogenous) business cycles and innovation-based growth theory: cycles occur because firms, expecting higher profits in booms due to ademand externality, innovate simultaneously in the expectation of aboom; the boom therefore becomes self-fulfilling. However, to the bestof our knowledge this is the first study that blends elements of varietybased endogenous growth theory and RBC methodology (including thefocus on exogenous aggregate productivity as the only source of uncertainty). Moreover, our framework also uses a general structure ofpreferences for variety that implies that markups fall when market sizeincreases (which can be viewed as a dynamic extension of Krugman’s[1979] insights about the effects of market size on firm size andmarkups).The investment in new productive units is financed by householdsthrough the accumulation of shares in the portfolio of firms. The stockmarket price of this investment fluctuates endogenously in response to
endogenous entry309shocks and is at the core of our propagation mechanism. Together withthe shares’ payoff (monopolistic profits), it determines the return toinvestment/entry, which in turn determines household saving decisions,producer entry, and the allocation of labor across sectors in the economy. This contrasts with the standard, one-sector RBC models, wherethe price of physical capital is constant without capital adjustment costsand the return to investment is simply equal to the marginal productof physical capital. This approach to investment and the price of capitalprovides an alternative to adjustment costs in order to obtain a timevarying price of capital. It also introduces a direct link between investment and (the expectation of) economic profits. In our model, laboris allocated to production of existing goods and creation of new ones,and the total number of products acts as capital in the production ofthe consumption basket. This structure is close to two-sector versionsof the RBC model in which labor is allocated to production of theconsumption good and to investment that augments the capital stock,and capital is also used to produce the consumption good. We discussthis relationship in further detail below.In terms of matching key second moments of the US business cycle,our baseline model performs at least as well as a traditional RBC model(it does better at matching the volatility of output and hours). Importantly, our model can additionally account for stylized facts pertainingto entry, profits, and markups. With translog preferences (for which theelasticity of substitution is increasing in the number of goods produced),our model is further able to simultaneously generate countercyclicalmarkups and procyclical profits; it also reproduces the time profile ofthe markup’s correlation with the business cycle. These are well-knownchallenges for models of countercyclical markups based on sticky prices(see Rotemberg and Woodford [1999] for a discussion). To the best ofour knowledge, our framework is the first to address and explain theseissues simultaneously.6 Moreover, we develop an extension of our framework that also incorporates investment in physical capital. This significantly improves the performance of the model (relative to both ourbaseline without physical capital and the standard RBC model) in reproducing the volatilities of output, hours worked, and total investment.The paper is structured as follows. Section II presents the baselinemodel. Section III computes impulse responses and second momentsfor a numerical example and illustrates the properties of the model for6Perfect-competition models, such as the standard RBC, address none of these facts.Imperfect-competition versions (with or without sticky prices) generate fluctuations inprofits (and, for sticky prices, in markups) but no entry. Frictionless-entry models discussedlater generate fluctuations in entry (and, in some versions—such as Cook [2001], Cominand Gertler [2006], or Jaimovich and Floetotto [2008]—also markups) but with zeroprofits.
310journal of political economytransmission of economic fluctuations. Section IV outlines the extensionof our model to include investment in physical capital and illustratesits second-moment properties. Section V discusses the relation betweenour work and other contributions to the literature on entry and businesscycles. Section VI presents conclusions.II.The ModelA.Household Preferences and the Intratemporal Consumption ChoiceThe economy is populated by a unit mass of atomistic, identical households. All contracts and prices are written in nominal terms. Prices areflexible. Thus, we solve only for the real variables in the model. However,as the composition of the consumption basket changes over time because of firm entry (affecting the definition of the consumption-basedprice index), we introduce money as a convenient unit of account forcontracts. Money plays no other role in the economy. For this reason,we do not model the demand for cash currency and resort to a cashlesseconomy as in Woodford (2003).The representative household supplies L t hours of work each periodt in a competitive labor market for the nominal wage rate Wt and max imizes expected intertemporal utility E t[冘spt b s tU(Cs, L s)], where C isconsumption and b 苸 (0, 1) the subjective discount factor. The periodutility function takes the form U(C t, L t) p ln C t x(L t)1 1/J/(1 1/J),x 1 0, where J 0 is the Frisch elasticity of labor supply to wages andthe intertemporal elasticity of substitution in labor supply. Our choiceof functional form for the utility function is guided by results in King,Plosser, and Rebelo (1988): Given separable preferences, log utility fromconsumption ensures that income and substitution effects of real wagevariation on effort cancel out in the steady state; this is necessary tohave constant steady-state effort and balanced growth if there is productivity growth.At time t, the household consumes the basket of goods C t , definedover a continuum of goods Q. At any given time t, only a subset of goodsQt O Q is available. Let p(q)denote the nominal price of a good q 苸tQt . Our model can be solved for any parameterization of symmetrichomothetic preferences. For any such preferences, there exists a welldefined consumption index C t and an associated welfare-based priceindex Pt . The demand for an individual variety, c(q), is then obtainedtas c(q)dqp C t Pt / p(q), where we use the conventional notation forttquantities with a continuum of goods as flow values (see the Appendixfor more details).We anticipate symmetric equilibrium across products. Given the demand level per variety, the symmetric price elasticity of demand z is in
endogenous entry311general a function of the number Nt of goods (where Nt is the mass of, for any symmetric variety q. TheQt): z(Nt) { [ c(q)/ p(q)][p(q)/c(q)]ttttbenefit of additional product variety is described by the relative pricer(q)p r(Nt) { p(q)/Pttt , for any symmetric variety q, or, in elasticityform, e(Nt) { r (Nt)Nt /r(Nt). Together, z(Nt) and r(Nt) completely characterize the effects of consumption preferences in our model; explicitexpressions for these objects can be obtained upon specifying functionalforms for preferences, as will become clear in the discussion below.B.FirmsThere is a continuum of monopolistically competitive firms, each producing a different variety q 苸 Q. Production requires only one factor,labor (this assumption is relaxed in Sec. IV, where we introduce physicalcapital). Aggregate labor productivity is indexed by Z t , which representsthe effectiveness of one unit of labor. The term Z t is exogenous andfollows an AR(1) process (in logarithms). Output supplied by firm q isy(q)p Z tl t(q), where l t(q) is the firm’s labor demand for productivetpurposes. The unit cost of production, in units of the consumptionbasket C t , is wt/Z t , where wt { Wt /Pt is the real wage.Prior to entry, firms face an exogenous sunk entry cost of fE effectivelabor units (as in Judd [1985], Romer [1990], and Grossman and Helpman [1991], among others), equal to wt fE /Z t units of the consumptionbasket. This specification ensures that exogenous productivity shocksare truly aggregate in our model, as they affect symmetrically both production of existing goods and creation of new products.7 Given ourmodeling assumption relating each firm to a product line, we think ofthe entry cost as the development and setup cost associated with aparticular variety.There are no fixed production costs. Hence, all firms that enter theeconomy produce in every period until they are hit with a “death” shock,which occurs with probability d 苸 (0, 1) in every period. The assumptionof exogenous exit is adopted here only in the interest of tractability.Recent evidence suggests that this assumption is a reasonable startingpoint for analysis. At the product level, Broda and Weinstein (2010)report that product destruction is much less cyclical than product creation. A similar pattern also holds at the plant level: using US Census(annual) data, Lee and Mukoyama (2007) find that, while plant entryis highly procyclical (the entry rate is 8.1 percent in booms and 3.4percent in recessions), annual exit rates are similar across booms andrecessions (5.8 and 5.1 percent, respectively). They also find that plants7Thus, the “production function” for new goods is NE,t p ZtLE,t /fE .
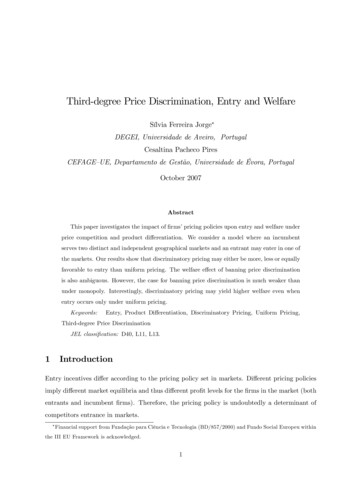
312journal of political economyTABLE 1Two FrameworksCESm(Nt) p m pTranslogvv 11jN t1 N Ntexp ( 2 jNN ),tm(Nt) p mt p 1 r(Nt) p Ntm 1 p Nt1/(v 1)r(Nt) pÑ { Mass(Q)e(Nt) p m 1e(Nt) p12jNtp 21 [m(Nt) 1]exiting in recessions are very similar to those exiting in booms (in termsof employment or productivity).In units of consumption, variety q’s price will be set to alcost(anttt tttticipating symmetric equilibrium). Given our demand specification withendogenous price elasticity of residual demand, this markup is a function of the number of producers: mt p m(Nt) { z(Nt)/[z(Nt) 1]. Theprofits generated from the sales of each variety (expressed in units ofconsumption) are d t(q) p d t p [1 m(Nt) 1]C t /Nt and are returned tohouseholds as dividends.1.Preference Specifications and MarkupsIn our quantitative exercises, we consider two alternative specificationsthat are nested within our general analysis of symmetric homotheticpreferences. The first specification features CES between goods as inDixit and Stiglitz (1977). For these CES preferences, the consumptionv 1/vdq]v/(v 1), where v 1 1 is the symmetricaggregator is C t p [ q苸Q c(q)telasticity of substitution across goods. The consumption-based price in1 vdex is then Pt p [ q苸Qt p(q)dq]1/(1 v) and the household’s demand fort veach individual good q is c(q)p [p(q)/P]C t . It follows that the markuptttand the benefit of variety are independent of the number of goods(e(Nt) p e, m(Nt) p m) and related by e p m 1 p 1/(v 1). The second specification uses the translog expenditure function proposed byFeenstra (2003), which introduces demand-side pricing complementarities. For this preference specification, the symmetric price elasticity ofdemand is (1 jNt), j 1 0: as Nt increases, goods become closer substitutes, and the elasticity of substitution 1 jNt increases. If goods arecloser substitutes, then the markup m(Nt) and the benefit of additionalvarieties in elasticity form (e(Nt)) must decrease. This property occurswhenever the price elasticity of residual demand decreases with quantityconsumed along the residual demand curve. The change in e(Nt) is onlyhalf the change in net markup generated by an increase in the numberof producers. Table 1 contains the expressions for markup, relative price,
endogenous entry313and the benefit of variety (the elasticity of r to the number of firms)for each preference specification.2.Firm Entry and ExitIn every period, there is a mass Nt of firms producing in the economyand an unbounded mass of prospective entrants. These entrants areforward looking and correctly anticipate their expected future profitsds(q) in every period s t 1 as well as the probability d (in everyperiod) of incurring the exogenous exit-inducing shock. Entrants attime t start producing only at time t 1, which introduces a one-periodtime-to-build lag in the model. The exogenous exit shock occurs at thevery end of the time period (after production and entry). A proportiond of new entrants will therefore never produce. Prospective entrantsin period t compute their expected postentry value (v(q)) given by thetpresent discounted value of their expected stream of profits :{ds(q)}spt 1冘 v(q)p EttQ t,sds(q),(1)spt 1where Q t,s is the stochastic discount factor that is determined in equilibrium by the optimal investment behavior of households. This alsorepresents the value of incumbent firms after production has occurred(since both new entrants and incumbents then face the same probability1 d of survival and production in the subsequent period). Entryoccurs until firm value is equalized with the entry cost, leading to thefree-entry condition v(q)p wt fE /Z t . This condition holds as long astthe mass NE,t of entrants is positive. We assume that macroeconomicshocks are small enough for this condition to hold in every period.Finally, the timing of entry and production we have assumed impliesthat the number of producing firms during period t is given byNt p (1 d)(Nt 1 NE,t 1). The number of producing firms representsthe stock of capital of the economy. It is an endogenous state variablethat behaves much like physical capital in the benchmark RBC modelbut in contrast to the latter has an endogenously fluctuating pricegiven by (1).3.Symmetric Firm EquilibriumAll firms face the same marginal cost. Hence, equilibrium prices, quantities, and firm values are identical across firms: p(q)p pt , r(q)p rt ,ttl t(q) p l t , y(q)p yt , d t(q) p d t , and v(q)p vt . In turn, equality of pricesttacross firms implies that the consumption-based price index Pt and thefirm-level price pt are such that pt /Pt { rt p r(Nt). An increase in the
314journal of political economynumber of firms implies necessarily that the relative price of each individual good increases, r (Nt) 1 0. When there are more firms, households derive more welfare from spending a given nominal amount; thatis, ceteris paribus, the price index decreases. It follows that the relativeprice of each individual good must rise. The aggregate consumptionoutput of the economy is Nt rt yt p C t , which we can rewrite as C t pZ t r(Nt)(L t fENE,t /Z t). An increase in the number of entrants NE,t absorbsproductive resources and acts like an overhead labor cost in productionof consumption. Importantly, in the symmetric firm equilibrium, theoption value of waiting to enter is zero, despite the presence of sunkcosts and exit risk. This happens because all uncertainty in our modelis aggregate, and the death shock is symmetric across firms and timeinvariant.8C.Household Budget Constraint and Optimal BehaviorHouseholds hold shares in a mutual fund of firms. Let x t be the sharein the mutual fund held by the representative household entering period t. The mutual fund pays a total profit in each period (in units ofcurrency) equal to the total profit of all firms that produce in thatperiod, PNt td t . During period t, the representative household buys x t 1shares in a mutual fund of Nt NE,t firms (those already operating attime t and the new entrants). The mutual fund covers all firms in theeconomy, even though only 1 d of these firms will produce and paydividends at time t 1. The date t price (in units of currency) of aclaim to the future profit stream of the mutual fund of Nt NE,t firmsis equal to the nominal price of claims to future firm profits, Pvt t.The househ
JSTOR is a not-for-profit service that helps scholars, researchers, and students discover, use, and build upon a wide range of . over a 5-year period—a horizon usually associated with the length of . the previous footnote, any production of a new equipment product, whether a treadmill, an elliptical machine, a stationary bike, or any .