Transcription
Health and Recovery Plan (HARP):MetroPlus EnhancedCAHPS 5.1HAdult Medicaid SurveyContinuous Quality Improvement ReportApril 20223975 Research Park DriveAnn Arbor, MI 48108
MetroPlus EnhancedTable of ContentsBackground1Executive Summary22345678Standard RatingsStandard CompositesKey Measure SummarySample ProfileSample DispositionResponse Rate ReportTrend AnalysisMethodology9IntroductionSurvey MilestonesSampling FrameQuestionnaireSelection of Cases for AnalysisDefinition of Achievement ScoresCompositesCorrelation to SatisfactionComparisonsStatistical TestingCase-Mix AnalysisUsing This Report12Graphs/Results141516171819202122Standard RatingsStandard CompositesGetting Needed CareGetting Care QuicklyHow Well Doctors CommunicateCustomer ServiceMedical Assistance with Smoking CessationSingle ItemsCorrelation AnalysisSummaryRating Question Details262728Responses by Question33Appendix A: QuestionnaireNew York State Department of Health DataStat, Inc.
MetroPlus EnhancedBackgroundBackgroundIn New York, Medicaid enrollees living with significant behavioral health needs may be enrolled in a type ofMedicaid managed care plan called a Health and Recovery Plan (HARP). These plans are designed tospecifically address the needs of members living with mental health or substance use disorders byproviding access to experienced behavioral health providers and offering services specialized for theirneeds. Specialized services include care coordination between medical and other providers, promotingwellness, and treatment adherence services.The Consumer Assessment of Healthcare Providers and Systems (CAHPS ) survey is a comprehensivetool designed to assess consumers' experience with health care and health plans. CAHPS is thequestionnaire that asks health plan members about experiences with access to care, health care providersand health plans. The New York State Department of Health (NYSDOH) sponsors a CAHPS surveyevery other year for the Medicaid managed care plans and uses the results to determine variation inmember satisfaction among the plans. DataStat, Inc. conducted the survey on behalf of the NYSDOH in2021. The instrument used for the administration of the survey was the CAHPS 5.1H Adult Medicaid coresurvey, developed and tested nationally for assessing the performance of health plans.The majority of question items addressed member's experience with their health care, such as getting carequickly, communication with doctors, and overall satisfaction with health care and with the health plan. Thequestionnaire was expanded to include 24 supplemental questions of particular interest to the NYSDOH.Rounding out the instrument was a set of questions collecting demographic data. In total, thequestionnaire consisted of 69 questions. A copy of the modified CAHPS questionnaire can be found inAppendix A.Copyright Notice: DataStat has created the format and organization of this report and retains that as its sole property, holds the copyrighton that portion of the report and conveys no interest in that portion of the report. Users of this report expressly agree not to copy orotherwise disseminate the format or organization which are DataStat's sole property without DataStat's written permission.CAHPS is a registered trademark of the Agency for Healthcare Research and Quality (AHRQ).New York State Department of HealthPage 1 DataStat, Inc.
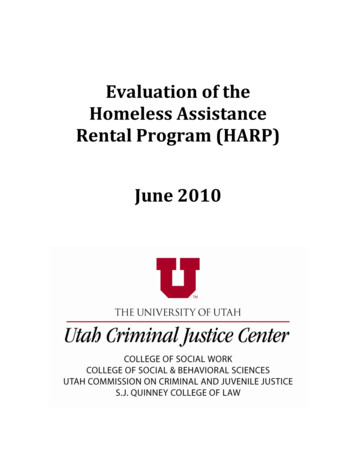
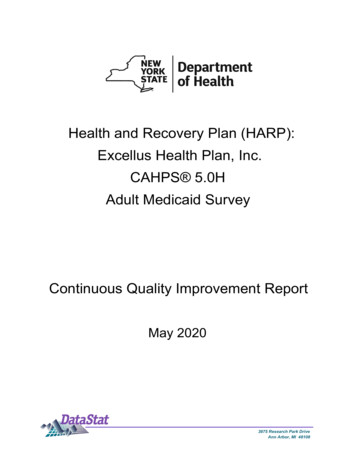
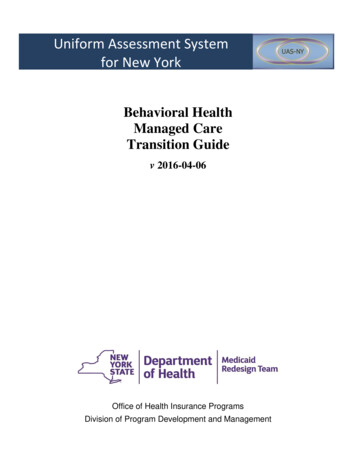
MetroPlus EnhancedExecutive SummaryExecutive SummaryIn New York, the CAHPS survey is administered to Medicaid managed care plan members every other year.For the 2021 administration, the NYSDOH focused on adult members of Medicaid managed care plans as wellas members in Special Needs Plans (SNPs) and Health and Recovery Plans (HARPs). The survey included12 HARPs in New York with a sampled goal of 2,000 adults per plan. Questionnaires were sent to 24,000members following a mail only methodology during the period October 14, 2021, through January 13, 2022,using a standardized survey procedure and questionnaire. A total of 306 responses were received resulting ina 15.4% response rate. The disposition of surveys is contained at the end of this section.Conclusions based on the information presented in this report should be tempered by a few caveats. First, forsome questionnaire items, relatively small numbers of responses may be available due to skip patterns in thequestionnaire. In order to present the most reliable information, results based on fewer than 30 observationsare not presented in this report. Second, in some of the data presentations included in this report, correlationcoefficients are computed to explore the relationship between different measures. High correlations, however,do not necessarily indicate causation. Finally, in many of the graphs and tables presented in this report,differences between the Statewide average and individual managed care plans are readily apparent. However,where these differences are not statistically significant they should be evaluated accordingly.Summary of Standard Rating QuestionsResponse options for standard rating questions ranged from 0 (worst) to 10 (best). In the table below, theachievement score represents the proportion of members who responded with a rating of "8", "9", or "10".HARP results are presented for Statewide, New York City (NYC), Rest of State and the plan. Plan results arecompared to the HARP Statewide achievement scores and a significance level of .05 or less was consideredstatistically significant and "é" or " ê" is placed at the top of the appropriate bar. Regional results are presentedfor additional information, but are not compared to the Statewide achievement scores.BetterStandard Ratings Questions (8, 9 or 10)1009080êê7060504030Worse20100HARP Statewide 2021NYC 2021Rest of State 2021MetroPlus 2021Q21. Rating of allhealth careQ39. Rating ofpersonal doctorQ43. Rating ofspecialist talkedto most oftenQ50. Rating ofhealth planQ25. Rating oftreatment 9%65.82%64.51%62.51%66.07%60.57%éêStatistically significantly better/worse than HARP Statewide 2021.New York State Department of HealthPage 2 DataStat, Inc.
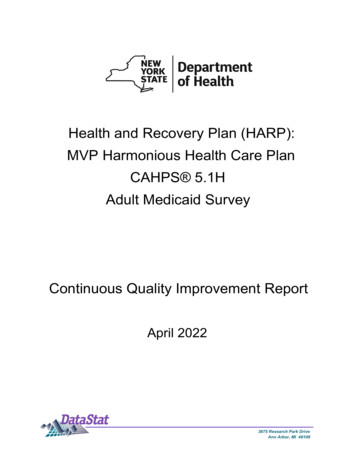
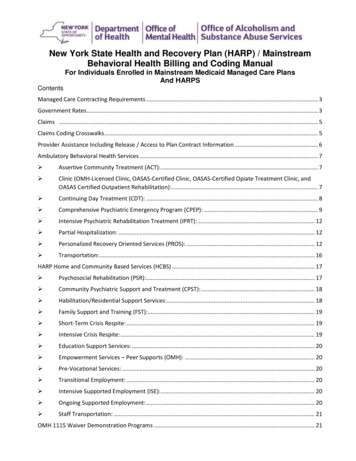
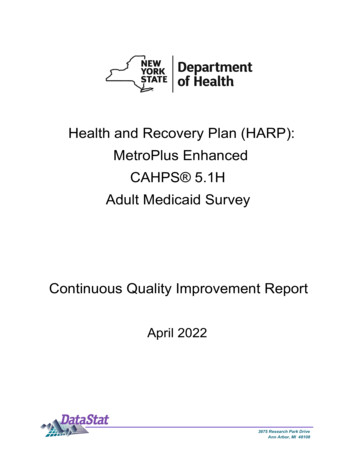
MetroPlus EnhancedExecutive SummarySummary of Standard CompositesA composite score is calculated for each of four domains of member experience: Getting Needed Care,Getting Care Quickly, How Well Doctors Communicate and Customer Service. Composite achievement scoresindicate the proportion of members who reported a positive experience within a given domain. Responses of"Usually" or "Always" indicate achievement for all composite measures. HARP results are presented forStatewide, New York City (NYC), Rest of State and the plan. Plan results are compared to the HARPStatewide achievement scores and a significance level of .05 or less was considered statistically significantand "é" or " ê" is placed at the top of the appropriate bar. Regional results are presented for additionalinformation, but are not compared to the Statewide achievement scores.BetterStandard Composites1009080ê7060504030Worse20100HARP Statewide 2021NYC 2021Rest of State 2021MetroPlus 2021Getting Needed Care(Usually or Always)Getting Care Quickly(Usually or Always)How Well DoctorsCommunicate (Usuallyor Always)Customer Service(Usually or 24%éêStatistically significantly better/worse than HARP Statewide 2021.New York State Department of HealthPage 3 DataStat, Inc.
MetroPlus EnhancedExecutive SummaryKey Measure SummaryPlansGettingNeededCare(Usually orAlways)How WellGetting CareDoctorsQuicklyCommunicate(Usually or(Usually orAlways)Always)CustomerService(Usually orAlways)Rating of allhealth careRating ofpersonaldoctorRating ofspecialisttalked tomost oftenRating ofhealth planRating oftreatment orcounselingHARP st of State808291876879757366Affinity Enriched ire808392846978736961Excellus Health Plan,Inc.778293886980757559Fidelis HealthierLife828491837080806967Healthfirst PersonalWellness Plan798294866783837866HIP EmblemHealth787589786678696964Independent Health808391926981738271MetroPlus Enhanced737889806571746661Molina HealthcarePLUS778290815476746368MVP 876672726958Statistically significantly better/worse than HARP Statewide 2021.New York State Department of HealthPage 4 DataStat, Inc.
MetroPlus EnhancedExecutive SummaryRespondent Sample ProfileAge (years)18 to 24HARP StatewideNYCRest of StateMetroPlusEnhanced1.0%0.9%1.1%1.0%25 to 349.6%8.2%10.8%5.4%35 to 4416.1%15.1%16.8%14.9%45 to 5424.0%22.0%25.3%21.7%55 to 6445.4%48.8%43.1%52.2%65 to 743.5%4.5%2.7%4.7%75 or older0.4%0.6%0.2%0.0%HARP StatewideNYCRest of le50.0%45.8%52.6%36.8%0.7%0.7%0.7%0.3%HARP StatewideNYCRest of StateMetroPlusEnhanced9.3%13.0%6.8%16.1%Some high school, but did not graduate22.9%26.1%20.9%25.1%High school graduate or GED34.0%29.5%37.2%30.1%Some college or 2-year degree24.7%22.6%26.0%23.7%4-year college graduate6.0%5.7%6.1%2.7%More than 4-year college graduate3.1%3.1%3.0%2.3%Hispanic or LatinoHARP StatewideNYCRest of StateMetroPlusEnhancedYes, Hispanic or Latino25.7%42.5%14.3%47.8%No, Not Hispanic or Latino74.3%57.5%85.7%52.2%RaceHARP StatewideNYCRest of ck or .2%5.7%Native Hawaiian or Other Pacific Islander0.8%1.2%0.5%2.2%GenderOther Responses: TransMale, TransFemale, Genderqueer,Gender Non-Binary, or OtherHighest grade or level of school completed8th grade or lessAmerican Indian or Alaska Native3.4%2.9%3.9%2.2%16.5%27.2%9.5%27.2%HARP StatewideNYCRest of ry rRating of Overall HealthNew York State Department of HealthPage 5 DataStat, Inc.
MetroPlus EnhancedExecutive SummarySample DispositionHARP StatewideFirst mailing - sentMetroPlus 321,471623493,71130678630Ineligible: Deceased†224Ineligible: Mentally or physically unable to completesurvey†201Refusal/Returned survey blank615Incomplete survey691515.5%15.4%First mailing - usable survey returned*Second mailing - sentSecond mailing - usable survey returned*Third mailing - sentThird mailing - usable survey returned*Total - usable surveysIneligible: According to population criteria‡†Ineligible: Language barrier†Response Rate*Included in response rate numerator†Excluded from response rate denominator‡Population criteria: The designated respondent must be a member of the health and recovery plan.Note: Response Rate Total Usable Surveys / Total Eligible CasesNew York State Department of HealthPage 6 DataStat, Inc.
MetroPlus EnhancedExecutive SummaryResponse RatesResponseRateUsableSurveysHARP ARP Statewide 2021New York State Department of Health65707580859095100BetterResponse RateHealth Plans 2021Page 7 DataStat, Inc.
MetroPlus EnhancedTrend AnalysisTrend Analysis - 2021 vs. 2019The table below provides a snapshot of the items with the greatest point change, positive or negative,since 2019. All performance-related items in the questionnaire that were trendable were listed indescending order of point change, and testing was conducted to determine which trends were statisticallysignificant. Two questions (Questions 8 and 10) cannot be trended and are not included in this analysis.Shown below are the ten items at the top of the list and the ten items at the bottom, with their 2019 and2021 scores and results of the significance testing. In the table presented below, differences over timemay be readily apparent. However, where these differences are not statistically significant they should beevaluated accordingly.MetroPlus2021 ScoreMetroPlus2019 ScorePointChangeComposite/Question GroupQ45. Written materials or internet usually or always providedinformation about how health plan works67.2%57.6% 9.6Single ItemsQ17. Doctor or other health provider asked what you thought wasbest for you89.9%81.9% 8.0Single ItemsQ16. Doctor or other health provider talked about reasons youmight not want to take a medicine67.0%58.9% 8.0Single ItemsQ15. Doctor or other health provider talked about reasons youmight want to take a medicine93.9%88.7% 5.1Single ItemsQ4. Usually or always got urgent care as soon as you needed80.0%77.9% 2.1Getting CareQuicklyQ13a. Doctor or other health provider talked about a healthy dietand eating habits79.1%77.3% 1.8Single ItemsQ43. Rating of specialist talked to most often73.9%72.9% 1.0RatingsQ13c. Doctor or other health provider talked about things in yourlife that worry you or cause you stress77.3%76.4% 1.0Single ItemsQ33. Personal doctor usually or always explained things in a waythat was easy to understand89.2%88.4% 0.8CommunicationQ35. Personal doctor usually or always showed respect for whatyou had to say92.4%92.4%- 0.1CommunicationQ6. Usually or always got an appointment for check-up or routinecare as soon as you needed75.0%81.8%- 6.9Getting CareQuicklyQ8. Usually or always able to get care needed during evenings,weekends or holidays75.0%81.8%- 6.9Single ItemsQ10. After regular office hours usually or always got answer tomedical question as soon as needed75.0%81.8%- 6.9Single ItemsQ56. Advised by doctor/provider to quit smoking or using tobacco81.1%88.1%- 7.0Smoking CessationQ58. Doctor/provider discussed or provided methods and strategiesto assist with quitting smoking or using tobacco59.4%66.7%- 7.2Smoking CessationQ30. Rating of alcohol, drug, or addiction treatment or counseling54.1%61.5%- 7.5Single ItemsQ39. Rating of personal doctor71.2%79.6%- 8.4RatingsQ13e. Doctor or other health provider talked about smoking orusing tobacco products54.0%62.9%- 8.9Single ItemsQ47. Health plan customer service usually or always gaveinformation or help you needed75.3%84.6%- 9.4Customer ServiceQ50. Rating of health plan65.8%75.5%- 9.6RatingsQuestionStatistically significantly higher/lower than 2019 score.New York State Department of HealthPage 8 DataStat, Inc.BetterWorse
MetroPlus EnhancedMethodologyMethodologyAdults who were current members of a NYSDOH HARP, ages 21 to 64, as of September 2021 and who hadbeen enrolled for five out of the last six months were eligible to be randomly selected for the survey.Respondents were surveyed in English or Spanish. The survey was administered over a 13 week period usinga mail only three wave protocol. The protocol consisted of a first questionnaire packet and reminder postcardto all selected members, followed by a second questionnaire packet and reminder postcard to individuals whohad not responded to the initial mailings and concluding with a third questionnaire packet to individuals whohad not responded to either the initial or secondary mailings.Survey Milestones1. 1st questionnaire packets mailed: October 14, 20212. 1st Reminder postcards mailed: October 25, 20213. 2nd questionnaire packets mailed: November 11, 20214. 2nd Reminder postcards mailed: November 22, 20215. 3rd questionnaire packets mailed: December 9, 20216. Field closed: January 13, 2022Sampling FrameA stratified random sample was drawn with the goal of selecting 1,500 eligible adults for each of the HARPs.To be eligible, individuals had to be current members, aged 21 to 64, who were continuously enrolled in theplan for at least five out of the last six months as of September 2021.QuestionnaireThe instrument selected for the survey, the CAHPS 5.1H Adult Medicaid core survey, was developed andtested nationally for use in assessing the performance of health plans. The majority of questions addresseddomains of member experience such as getting care quickly, doctor communication, overall satisfaction withhealth care and health plan. The questionnaire was expanded to include 24 supplemental questions ofparticular interest to the NYSDOH. Rounding out the questionnaire was a set of questions collectingdemographic data. In total, the questionnaire consisted of 69 questions. A copy of the modified CAHPS questionnaire can be found in Appendix A.Selection of Cases for AnalysisQuestionnaires were considered complete if respondents did not say 'No' to Question 1 (Our records showthat you are now in [HEALTH PLAN NAME]. Is that right?) and if they provided a valid response to at leastthree of the five questions: Q3, Q31, Q40, Q46, Q50. Complete interviews were obtained from 306 NYSDOHHARP members, and the overall project response rate was 15.4%.Definition of Achievement ScoresMember responses to questionnaire items are summarized as achievement scores. Responses that indicate apositive experience are labeled as achievements, and an achievement score is computed equal to theproportion of responses qualifying as achievements. Since achievement scores for questions represent theproportion of respondents who indicate a positive experience, the lower the achievement score, the greaterthe need for improvement. See the Responses by Question section for assignment of achievement responsesfor each question.In general, somewhat positive responses are included with positive responses as achievements. For example,a response of "Usually" or "Always" to the question "How often did you get an appointment for health care at adoctor's office or clinic as soon as you needed?" is considered an achievement, as are responses of "8", "9",or "10" to rating questions.New York State Department of HealthPage 9 DataStat, Inc.
MetroPlus EnhancedMethodologyCompositesFour standard composite scores summarize responses in key areas: Getting Needed Care, Getting CareQuickly, How Well Doctors Communicate and Customer Service. The achievement score for the composite isthe average of the achievement scores for the individual items comprising a composite. Following is a list ofthe questions that comprise each composite:Getting Needed CareQ22. Usually or always easy to get the care, tests, or treatment you neededQ41. Usually or always got appointments with a specialist as soon as you neededGetting Care QuicklyQ4. Usually or always got urgent care as soon as you neededQ6. Usually or always got an appointment for check-up or routine care as soon as you neededHow Well Doctors CommunicateQ33.Q34.Q35.Q36.Personal doctor usually or always explained things in a way that was easy to understandPersonal doctor usually or always listened carefully to youPersonal doctor usually or always showed respect for what you had to sayPersonal doctor usually or always spent enough time with youCustomer ServiceQ47. Health plan customer service usually or always gave information or help you neededQ49. Health plan customer service usually or always treated you with courtesy and respectCorrelation to SatisfactionTo understand the relationship between performance and satisfaction in particular areas of memberexperience, correlations are computed between responses to the question items comprising the fourcomposites and each of the ratings questions. The specific correlation computed is Pearson's CorrelationCoefficient, which takes on values between -1 to 1. Correlation scores are presented in the CorrelationAnalysis section.Comparisons: Current Year and TrendingTwo types of comparisons are presented. Current year comparisons are found in the Executive Summary andGraphs sections. In the Executive Summary section, plan level results for the Standard Ratings andComposites are compared to the Statewide achievement score, with statistical testing. Regional results arepresented for comparison. In the Graphs section plan level results for each performance measure arecompared to the Statewide achievement score, with statistical testing. Regional results are presented foradditional information, but are not compared to the Statewide achievement scores.Comparisons across time are the focus of the Trend Analysis section: all performance-related items in thequestionnaire that were trendable were listed in descending order of point change. The Trend Analysis sectiondisplays, for the plan, the ten items at the top of the list and the ten items at the bottom, with the 2019 and2021 scores and results of significance testing. In addition, in the Responses by Question section, for eachperformance item, the achievement score point change is displayed along with results of significance testing.New York State Department of HealthPage 10 DataStat, Inc.
MetroPlus EnhancedMethodologyStatistical TestingStatistically significant differences between scores were determined using t-tests. A significance level of .05 orless was considered statistically significant and "é" or " ê" is placed at the top of the appropriate bar or next tothe appropriate achievement score.Case-Mix AnalysisThe majority of achievement scores presented in this report are case-mix adjusted to control for differences inthe member population across managed care plans. The results for 2021 are case-mix adjusted for age (Q62),health status (Q52) and education (Q64). Case-mix adjustment is applied to mitigate the effect of differencesin individual plan's member population. The variables chosen for case-mix adjustment are beyond the controlof the managed care plan and have been shown to affect managed care plan and health care ratings. Forexample, individuals with higher levels of education generally rate lower for satisfaction. Details about thedistribution of populations in categories for the three adjusters can be seen in the Respondent Sample Profilecontained in the Executive Summary section.All achievement scores based on questions in the "About Your Health" and "About You" sections are not casemix adjusted. Case-mix adjustment is also not applied to the achievement scores for the Question 13 series.New York State Department of HealthPage 11 DataStat, Inc.
MetroPlus EnhancedUsing this reportUsing this ReportUnderstanding Achievement ScoresThis report is designed to assist the NYSDOH and participating health plans in identifying keyopportunities to improve members' experiences. Member responses to questions are summarized asachievement scores. Responses that indicate a positive experience are labeled as achievements, and anachievement score is computed as the proportion of responses qualifying as positive. For all composites,responses of "Usually" or "Always" are considered achievements. For example, a response of "Usually" or"Always" to the question "How often did you get care as soon as you needed?" is considered a positiveresponse, and the achievement score for this question is equal to the proportion of respondents whoanswered the question with "Usually" or "Always". Because achievement scores for questions arecomputed as the proportion of members who indicate a positive experience, the lower the achievementscore, the greater the need to improve.Achievement scores are computed and reported for all pertinent questions. In addition, composite scoresare built from groups of questions that make up broad domains of members' experience: Getting NeededCare, Getting Care Quickly, How Well Doctors Communicate and Customer Service.Achievement scores based on fewer than 30 observations are suppressed in this report and "NA" issubstituted for the result. When relevant, a footnote is presented. Typically, too few responses are due toskip patterns in the questionnaire. Suppressing scores based on a small number of cases ensures that thisreport includes the most reliable information available.Understanding the Sections of the ReportThe CAHPS survey results are presented here in a format that is optimized for use in practical decisionmaking. Specifically, these reports can:1. Assist the NYSDOH and health plans in identifying strengths and weaknesses in quality ofhealth care, access and services, and2. Provide the NYSDOH and health plans with a way to assess where resources can best beallocated to improve experiences.The remainder of the report is broken into three major sections that are briefly described here to help youmake the best use of the report and the information it contains.Graphs/ResultsThis section contains a graphic presentation of the HARP Statewide, NYC, Rest of State and plan specificresults for questions using the achievement scores. Statistical significance, the achievement score, andthe number of respondents for each plan are displayed. This depicts plan specific performance comparedto the HARP Statewide and peers. The composites are directly followed by the individual questions thatare combined to create composite measures.Correlation AnalysisThe Correlation Analysis section is helpful in understanding how satisfaction in various questions relates tothe four standard rating questions (personal doctor, specialist seen most often, all health care, and healthplan) for respondents. The charts show which questions are most strongly linked to the rating and thecurrent achievement score. The information helps define what areas are related to satisfaction and howthe plan performed in that area. The section enables a quick view of how composite questions correlateacross ratings.New York State Department of HealthPage 12 DataStat, Inc.
MetroPlus EnhancedUsing this reportThe correlation analyses are presented two ways. First there are correlations of the top ten highlycorrelated composite questions to the four rating questions ranked by the highest correlation between thequestion and rating. This allows a visual picture of clustering of composites across ratings. The secondanalysis presents the proportion of responses in each response option for each composite question foreach individual rating. This lets you see where there may be an opportunity for improvement. For example,if a question correlates highly and has higher proportions of "usually" and "sometimes", improving theprocesses may move respondents up to "always" to improve not only that composite, but the other ratingquestions.Responses by QuestionThis section provides a breakdown for each question with the number of members responding to thequestion and the distribution for each available response option. For each question that has responsesdetermined to be positive or negative, there is a colored circle indicating achievement (green circle) orroom for improvement (red circle). The circles are based on the response category and are not indicativeof areas the plan needs to improve necessarily. For example, "Always" and "Usually" are achievement and"Sometimes" and "Never" are room for improvement. Similarly on a rating question, "8", "9", or "10" areachievement and 0 through 7 are room for improvement. Questions without a colored circle indicate thequestion is not associated with this type of response determination. For example, asking whether amember needed a service in the past six months does not have an associated achievement score.Achievement scores based on fewer than 30 observations are suppressed and "NA" is substituted for theresult. This section provides additional information about volume of members to help you prioritize areas tobe addressed.When applicable, each question is represented with the composite name, the achievement score, thecorrelation with rating of health plan and trend information. The achievement scores are case-mix adjustedwhile data for each response option are not case-mix adjusted. Achievement scores for the Question 13series, the "About Your Health" and "About You" sections are not case-mix adjusted.New York State Department of HealthPage 13 DataStat, Inc.
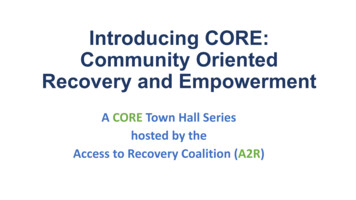
MetroPlus EnhancedGraphs/ResultsGraphs/ResultsThe Graphs/Results sections contains a graphic presentation of the HARP Statewide, NYC, Rest of State andplan specific results for each question using the achievement scores. Statistical significance, the achievementscore, and the number of respondents for each plan are displayed. This depicts plan specific performancecompared to various benchmarks or peers. Rating results are followed by composites and the questions thatmake up each composite. Medical Assistance with Smoking Cessation and Single Items can be found at theend of this section.The CAHPS 5.1H survey uses a 0-10 rating for assessing overall experience with personal doctors,specialists, health care and health plans. In the four ratings graphs, proportions of respondents assigningratings of "8", "9", or "10" are reported as achievement scores.Questions that relate to the same broad domain of performance are grouped together for the purpose ofreporting. For example, the domain "Getting Care Quickly" includes questions about how soon appointmentswere scheduled. Composite achievement scores reflect responses of "Usually" or "Always". Graphs presentingthe results of individual questions that make up the composite score follow the presentation of the compositeresults.For full detail of response options for each question and which responses qualify as achievements, pleaserefer to the Responses by Question section.In this report, results based on fewer than 30 cases are suppressed and "NA" is substituted for the result.When relevant, a footnote is presented.New York State Department of HealthPage 14 DataStat, Inc.
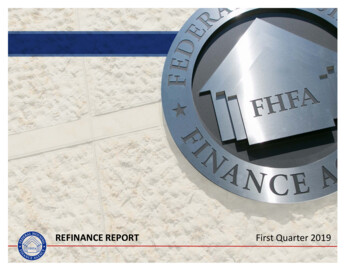
MetroPlus EnhancedStandard RatingsStandard RatingsQ21. Rating of allhealth care (8, 9 or 10)Q39. Rating ofpersonal doctor (8, 9or 10)êQ43. Rating ofspecialist talked tomost often (8, 9 or 10)Q50. Rating of healthplan (8, 9 or 10)êQ25. Rating oftreatment orcounseling (8, 9 or 10)051015202530404550556065707580Achievement ScoreWorseéê35
Hispanic or Latino HARP Statewide NYC Rest of State MetroPlus Enhanced Yes, Hispanic or Latino 25.7% 42.5% 14.3% 47.8% No, Not Hispanic or Latino 74.3% 57.5% 85.7% 52.2% Race HARP Statewide NYC Rest of State MetroPlus Enhanced White 52.4% 28.7% 68.6% 24.4% Enhanced