Transcription
Li et al. Chin Med (2017) 12:4DOI 10.1186/s13020-016-0121-xChinese MedicineOpen AccessRESEARCHQuality control of Lycium chinenseand Lycium barbarum cortex (Digupi) by HPLCusing kukoamines as markersYuan‑Yuan Li1,3†, Rui Di1†, Wing‑Leung Hsu1, Ye‑Qing Huang1 and Hon‑Yeung Cheung1,2*AbstractBackground: Lycii Cortex (LyC), composed of Lycium chinense and Lycium barbarum cortex and having the Chinesename Digupi, is used to treat chronic diseases like cough, hypertension, and diabetes in Eastern Asia. However, chro‑matographic methods, such as TLC and HPLC, to determine the phytochemical composition of LyC have not beenincluded in any official compendiums. This study aims to establish a validated HPLC method for quality control of LyC.Methods: Kukoamines A and B (KA and KB, respectively) were selected as markers for the HPLC method. An ace‑tic acid solution was adopted for sample extraction because it facilitated the release of kukoamines and effectivelyprevented their degradation. Optimal separation of the kukoamine isomers was achieved on hydrophilic ligandcoated C18 columns with a gradient elution of acetonitrile and 0.1% (v/v) trifluoroacetic acid. The average contentsand proposed contents for LyC were calculated with a t test and an uncertainty test based on 16 batches of authenticsamples.Results: The method was validated with linearity (r2 0.9999 for both KA and KB), precision (RSD 1.29% for KA and0.57% for KB), repeatability (RSD 1.81% for KA and 0.92% for KB), and accuracy (recovery of 90.03–102.30% for KA,and 98.49–101.67% for KB), indicating that the method could offer reliable results for quality control analysis of LyC. Atthe 95% confidence level, the calculated content limits were 1.45 mg/g for KA and 4.72 mg/g for KB.Conclusion: Compared with conventional morphological identification, the HPLC method involving KA and KB con‑tents offers precise, objective, and quantitative results for quality control of LyC.BackgroundLycii Cortex (LyC) is used to treat chronic diseases likecough, hypertension, and diabetes in Eastern Asia [1–3].Although pharmacopeias from China, Japan, and Koreahave officially stipulated the source of LyC as the rootbark of Lycium chinense and Lycium barbarum [4–6],the herb is often misused or adulterated with other cortexes having similar appearances. Contemporary authentication of LyC relies on morphological identification[4–6]. In contrast, inspections based on characteristic*Correspondence: cheung.honyeung@cityu.edu.hk†Yuan-Yuan Li and Rui Di contributed equally to this work1Research Group for Bioactive Products, Department of BiomedicalSciences, City University of Hong Kong, Hong Kong SAR, ChinaFull list of author information is available at the end of the articleconstituents are practical and objective, because monitoring of phytochemical markers is normally not onlygenus-specific, but also herbal function-related [7–9].Chromatographic techniques are commonly used forboth qualitative and quantitative purposes with reliableresults [10]. However, a genuine chromatographic methodfor LyC involving unique markers is still missing in official compendiums. Although some phytochemicals suchas phenolic acids and flavonoids have been recommendedas markers for quality assessment for LyC [11–13], theyare neither unique nor abundant in this herb. Hence, theyshould not be adopted.Recently, kukoamines A and B (KA and KB, respectively)were recommended by us as unique markers for LyC [14],because they are truly bioactivity-related, genus-specific,and content-abundant in this herb. Although the LC–MS/ The Author(s) 2017. This article is distributed under the terms of the Creative Commons Attribution 4.0 International /), which permits unrestricted use, distribution, and reproduction in any medium,provided you give appropriate credit to the original author(s) and the source, provide a link to the Creative Commons license,and indicate if changes were made. The Creative Commons Public Domain Dedication waiver ) applies to the data made available in this article, unless otherwise stated.
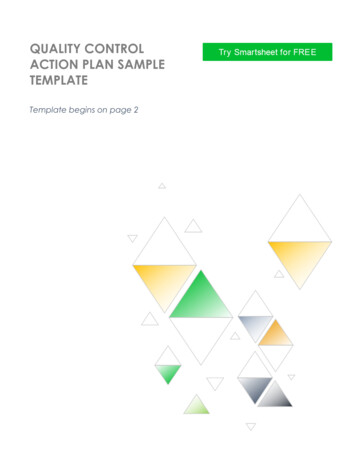
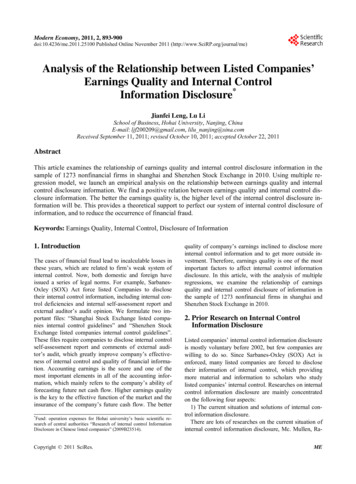
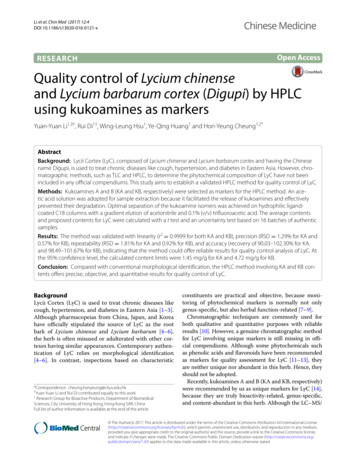
Li et al. Chin Med (2017) 12:4MS method is considered to provide simultaneous andprecise determination of numerous phytochemical constituents [14, 15], the high cost of the equipment and itsoperation has made this method less practical for dailyquality control inspections.This study aims to provide a validated method for quality control of LyC with reference to KA and KB. Basedon the developed method, multiple batches of LyC wereinvestigated and the content limits were statisticallycalculated.MethodsReagentsMethanol and acetonitrile (HPLC grade) were purchasedfrom Labscan Asia (Thailand). Trifluoroacetic acid (TFA)and acetic acid (both HPLC grade) were purchased fromFluka (Switzerland). All other chemicals were of analytical grade. Water was prepared using a Millipore MilliQPlus system (Millipore, USA). KA and KB (Fig. 1) wereextracted and purified by our group (purity: higher than98%) [16].Plant materialsDried root bark samples of L. chinense and L. barbarumwere collected from different regions in China and a localmarket in Hong Kong (Table 1). At least 2 kg of each barkwas collected. The species of the plants were identifiedby Dr. Zhi-Feng Zhang (Ethnic Pharmaceutical Institute,Southwest University for Nationalities). The voucherspecimens (DGP-JXXS-001, DGP-HBQL-001, and DGPJXJJ-001) were stored in the Department of Health, HongKong Government SAR.LyC sliced samples, with the commercial names HongDigupi (RLyC) and Bai Digupi (WLyC), were provided byherb stores from the Hehuachi herbal market in ChengduPage 2 of 8(Sichuan Province, China). These samples had unclearsources, and were classified based on traditional experience. LyC extracts (Nos. 01–03) were bought from herbalextract companies in Sichuan, Shanxi, and Hubei. Theseextracts were claimed to be extracted from LyC.Chromatographic conditionsThe HPLC analysis was performed on an Agilent 1260system (Agilent, USA) equipped with an on-line degasser (G1322A; Agilent, USA), a binary bump (G1312C;Agilent, USA), an autosampler (G1329B; Agilent, USA), acolumn oven (G1316A; Agilent, USA), and a diode arraydetector (G1315D; Agilent, USA). A Zorbax C18 SB-AQcolumn (250 mm 4.6 mm i.d., 5 μm; Agilent, USA) wasused for the separation. A mobile phase consisting of0.1% TFA (A) and acetonitrile (B) was applied for the separation with the following gradient program: 0–15 min,12–16% B; 15–35 min, 16–22% B. The flow rate was1.0 mL/min and the column oven was set at 40 C. Thedetection wavelength was 280 nm.Sample preparationEach LyC sample was cut into small pieces and pulverized into a powder (passed through a 200-mesh sieve).The herbal powder (0.5 g) was accurately weighed. Theextraction solvent was a 50% methanol aqueous solutioncontaining 0.5% acetic acid (v/v). After addition of 20 mLof the extraction solvent, the mixture was sonicated inan ultrasonic bath (100 W, AC-120H; MRC, Germany)for 30 min and then centrifuged at 2880 g for 10 min(Allegra X-15R; Beckman Coulter, USA). The supernatantwas transferred into a 50-mL volumetric flask and thepellet was re-extracted with another 20 mL of extractionsolvent for 30 min. After centrifugation, the extractedsolution was transferred to the same volumetric flask.Next, 10 mL of extraction solvent was used to wash thetube, and the washing solution was also added to the volumetric flask and filled to the mark. The prepared samplesolution was filtered through a 0.22-μm pore-size filterbefore injection.Method validationFig. 1 Structures of kukoamines A and BCalibration curves for KA and KB were constructed byplotting the peak area versus the standard concentration.The calibration curves ranged from 3.91–250.00 mg/Lfor KA and 4.12–263.50 mg/L for KB. The method precision was measured by the relative standard deviation(RSD; %) of the peak areas determined for six successive injections of the standard solution. The repeatabilitytest was measured by injection of five replicate samplesfor the proposed sample preparation and determinationmethods. The repeatability was calculated by the RSD
Li et al. Chin Med (2017) 12:4Page 3 of 8Table 1 Production areas and species of Lycii Cortex samples and the contents of kukoamines A and BBatch no.SpeciesOriginCollection yearLC 1L. chinenseJiangxi2011LC 2L. chinenseJiangxi2011LC 3L. chinenseJiangxi2011LC 4L. chinenseJiangxi2011LC 5L. chinenseGansu2011LC 6L. chinenseShangxi2011LC 7L. chinenseNeimenggu2011LC 8L. chinenseNeimenggu2011LC 9L. barbarumNingxia2011LC 10L. barbarumNingxia2011LC 11L. barbarumNingxia2011LC 12L. barbarumNingxia2011LC 13L. barbarumNingxia2011LC 14L. chinenseHong Kong2011LC 15L. chinenseHong Kong2012LC 16L. chinenseHong Kong2012aContent of KAa (mg/g)9.65 0.264.38 0.27Content of KBa (mg/g)5.03 0.1313.27 0.043.33 0.1813.50 0.183.83 0.0313.29 0.141.82 0.133.39 0.226.34 0.1122.08 0.114.87 0.0414.27 0.271.93 0.026.65 0.011.13 0.021.86 0.093.49 0.026.80 0.184.06 0.2316.88 0.383.96 0.2919.02 0.114.25 0.0418.45 0.601.47 0.011.29 0.031.75 0.024.76 0.233.47 0.157.60 0.02The content was converted to the dry basis. The experiments for each sample were performed in triplicate (n 3), and the results are presented as themean standard deviationof the contents obtained from the five replicate samples[17]. The sample recovery was assessed by adding knownamounts of individual standards into an accuratelyweighted sample. Three concentrations were investigatedand triplicate measurements were performed for eachconcentration. Recovery was calculated with the following equation [16]:Recovery (%) 100 (amount found original amount)/amount spikedThe method detection limit (MDL) and limit of quantitation (LOQ) were determined according to theguidelines in Validation of Analytical Procedures: Methodology (Q2B) [18].Statistical analysisThe contents of samples were presented as themean standard deviation. The proposed content limitfor each analyte was calculated according to the contentsfrom multiple batches with consideration of the standard uncertainty of the precision, bias, purity of referencesubstance, and water content (the calculation equation isshown in Additional file 1). The calculation was based onthe ISO “Guide to the Expression of Uncertainty in Measurement” [19], EURACHEM/CITAC document “Quantifying Uncertainty in Analytical Measurement” [20], andLGC document “Development and Harmonization ofMeasurement Uncertainty Principles” [21]. The mean differences for KA and KB in the two species of L. chinenseand L. barbarum were evaluated by analysis of variance(ANOVA). If the P value was less than 0.05, a follow-uppost hoc test was conducted.Results and discussionEstablishment of HPLC conditions for determinationof kukoaminesSelection of column, mobile phase, and detection wavelengthKA and KB are water-soluble spermine alkaloids withmultiple amino and amide groups [22, 23] that causepeak tailing on the C18 packing material. Three kinds ofC18 columns with special coatings on the packing surface,i.e., Zorbax C18 BDS, Zorbax C18 Extended, and ZorbaxC18 SB-AQ (all from Agilent, USA), were compared forthe analyte retention behaviors. The kukoamines showedbetter retention on the Zorbax C18 SB-AQ column,owing to the better affinity of the extremely water-solubleanalytes for the hydrophilic packing surface.The influence of acids on the separation was investigated(Table 2). Within the pH range of 2.0–2.5, TFA was superior to phosphoric acid and formic acid in obtaining satisfactory peak resolution and symmetry. Furthermore, thepeak sequence of KA and KB observed with TFA was theopposite to that observed with the other two acids. Thisdifference was caused by the formation of ion pairs [24],which greatly altered the interaction between the analytesand the packing surface. Owing to the better separationperformance, TFA was chosen as the acid for the mobilephase. The detection wavelength chosen for the kukoamines was 280 nm, based on the characteristic UV absorption of the o-dihydrocaffeoyl groups in the analytes.
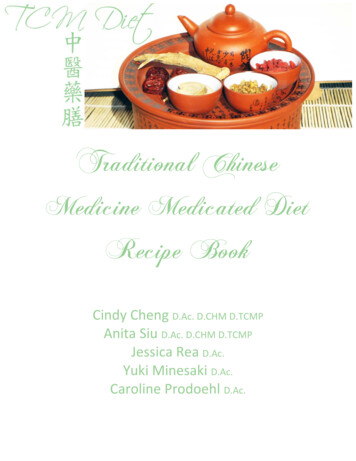
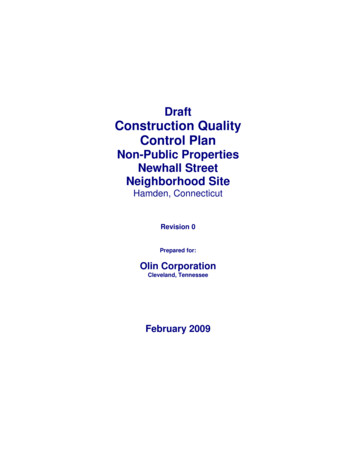
Li et al. Chin Med (2017) 12:4Page 4 of 8Table 2 Influence of acids on chromatographic behaviors of kukoaminesAqueous phasea (v/v)AnalytesRetention time 5.13954KB37.93249KA47.310,091KB37.110,8870.2% Formic acid (v:v) pH 2.50.1% Phosphate acid (v:v) pH 2.00.1% Trifluoroacetic acid (v:v) pH 1.101.12aThe exp eriment was conducted on an Agilent Zorbax C18 SB-AQ column (250 mm 4.6 mm i.d., 5 μm) with fixed proportions of acetonitrile and aqueous phase(16:84). The aqueous phase was investigated with different acidsbcThe number of theoretical plates was calculated as N 5.54 (tR/Wh/2)2, where tR is the retention time and Wh/2 is the peak width at half heightThe resolution R refers to the resolution between KA and KB. It was calculated as R 2 (tA tB)/(WA WB), where tA and tB are the retention times and WA and WB arethe peak widthsdThe tailing factor T was calculated as T W0.05h/2f, where W0.05h is the peak width at 5% peak height and f is the width start point at 5% peak height to the time ofthe maximum pointInfluence of pH on the stability of the kukoaminesA stability test for the analytes was performed, and theresults are shown in Fig. 2. KA and KB were not stable in neutral solution (pH 7), as they were found todecrease by about 30% after exposure in air for 21 h. Thischange might arise through oxidation of the o-dihydrocaffeoyl moieties into quinones [25]. In contrast, it wasfound that when the pH was adjusted to 2.5–3 by aceticacid, KA and KB remained constant within the investigated period. This protective effect can be explained bythe formation of hydrogen bonds between the phenolichydroxyl groups and the solvent molecules in the acidicsolution, which greatly protected the phenolic hydroxylgroups from oxidization [26]. Therefore, an acidic solution (0.5% acetic acid aqueous solution, v/v) was preferred for both the standard and sample solutions.kukoamines were completely extracted. Therefore, twoextractions were chosen for our extraction procedure.Method validationThe established method was validated for its detectionlimit (MDL), quantification limit (LOQ), linearity, precision, reproducibility, and recovery. As shown in Table 3,the high correlation coefficient (r2 0.9999; P 0.05)indicated good linearity between the concentrations ofkukoamines and their peak areas. The MDL and LOQwere derived from the responses of the analytes to UV, andwere found to be 1.76 and 8.78 μg/mL for kukoamine A,and 1.86 and 9.29 μg/mL for kukoamine B, respectively.The RSD (%) in the recovery, precision, and reproducibilitytests were all less than 2%. The good recovery obtained further suggested that the method was accurate and reliable.Optimization of kukoamine extraction proceduresQuantification results and proposed contentsKey factors influencing the extraction efficiency, specifically the extraction solvent and number of extractionrounds, were optimized to completely extract the analytes for analysis. The 50 and 80% methanol solutions(v/v) showed similar performances, which were muchhigher than those for the other concentrations (Fig. 3a).The optimal concentration of methanol for extraction was found to be 50% (v/v) from the aspect of ecofriendliness. Figure 3b shows the effects of acids on theextraction efficiency. The acidic solution was about onefold more potent than the neutral solution for kukoamine extraction. Therefore, 0.5% acetic acid (v/v) wasadopted, because it facilitated the release of alkaloidsfrom the powder to the solvent. The influence of thenumber of extraction rounds was also examined (Fig. 3c).When samples were sonicated twice, almost all of theThe validated method was applied to investigation ofthe LyC samples from different locations, which covered most of the production regions in China. Thepost-harvest treatment of the herb strictly followed theprocedures described in the professional compendiumsto ensure quality consistency [4, 27]. A typical chromatogram of LyC and the overlay chromatograms for multiple batches are shown in Fig. 4a, b. The chromatographicpatterns of all samples, regardless of whether they wereL. barbarum or L. chinense, were highly consistent,although the abundance of some peaks varied remarkably. With the proposed chromatographic methods, thecommon peaks (1–6) in Fig. 4b could be used as the fingerprinting features for LyC authentication. The contentsof KA and KB in the investigated LyC samples were in theranges of 1.13–9.65 and 3.39–22.08 mg/g, respectively
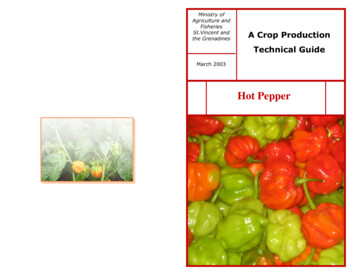
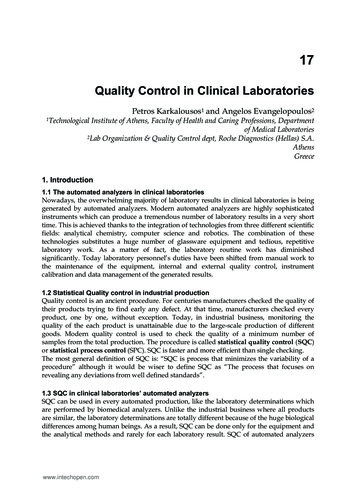
Li et al. Chin Med (2017) 12:4Page 5 of 8Fig. 2 Kukoamines A (a) and B (b) are stable in sample solution at pH2.5 (open square), but not at pH 7.0 (triangle)(Table 1). In general, KB was more abundant than KA inthe LyC samples.The LyC samples from L. chinense and L. barbarum didnot differ significantly from each other in their kukoamine contents when compared by one-way ANOVA (Additional file 1). These findings demonstrated that bothplants can produce LyC with equivalent quality.Geography, soil, and climate can cause fluctuations inherbal constituents [28–30]. Nevertheless, the secondary metabolites in LyC, KA and KB, typically fitted a normal distribution model [19–21]. Therefore, we estimatedthe content ranges of KA and KB for the LyC populationusing data from the collected representative samples bystatistical inference [19–21] (Additional file 2). At the95% confidence level, the calculated content limits were1.45 mg/g for KA and 4.72 mg/g for KB (Table 4). Thesecontent limits could be used as reference values to judgethe quality of LyC samples (Table 4).Fig. 3 Influence of methanol concentration (a), acetic acid concen‑tration (b), and number of extraction rounds (c) on the extractionefficiency of kukoamines in LyC. The experiments for each conditionwere performed in triplicate (n 3) and the results are presented asthe mean standard deviationApplication of the HPLC method for quality control of LyCFive batches of unauthenticated samples, which wereclaimed to be LyC sliced pieces and extracts, were testedby the established method and then judged by the calculated quality criteria. As shown in Fig. 5, only the crudematerial called “Hong Digupi” and the extract powder
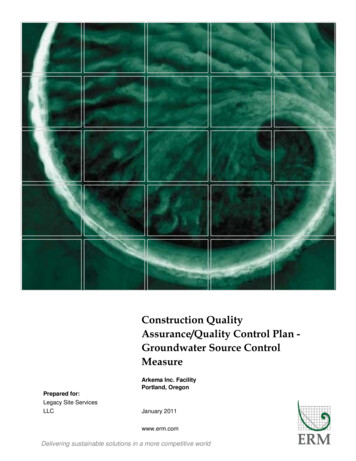
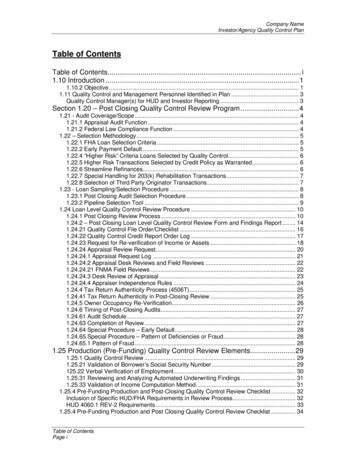
Li et al. Chin Med (2017) 12:4Page 6 of 8Table 3 Linearity, precision, repeatability, recovery, MDL, and LOQ of the established methodParameterLinearity (12 points)bPrecision (RSD) , %Kukoamine AKukoamine B3.91–250.00 mg/L; r2 0.9999a4.12–263.50 mg/L; r2 0.9999a1.290.57Repeatability (RSD)c, %1.810.92Mean recovery (n 5)d95.89%90.03–102.30%100.32%98.49–101.67%MDL (µg/mL)1.761.86LOQ (µg/mL)8.789.29MDL method detection limit, LOQ limit of quantificationabcr2, square of correlation coefficient for the linear regression (P 0.05)Precision was tested based on six injections of a standard solution with 62.50 µg/mL kukoamine A and 131.75 µg/mL kukoamine B. RSD (%) 100 SD/meanRepeatability was tested on five replicate samplesdRecovery (%) 100 (amount found original amount)/amount spiked. The results were presented as the mean recovery and recovery range. The amounts ofspiked components for the recovery test were 10.4, 20.8, and 41.6 mg for KB, and 1.5, 3.0, and 4.5 mg for KATable 4 Mean contents and proposed content limitsfor kukoamines A and B in Lycii 9158.73nd16tecritical2.131uc (C)f0.462.67Calculated limitg1.454.72Outlierh00Failing rate (%)i12.5018.75aCa, average content of klkukoamines in samples (mg/g)bSD, standard deviation of the contents in all samplescRSD (%) 100 SD/meanden, sample sizetcritical, critical value for a 95% confidence interval when the sample size was 16fuc (C), combined standard uncertainty of the kukoamine B content in thesample (mg/g). The calculation is shown in the supplementary data sectiongCalculated limit for kukoamines in the sample. The calculation is shown in thesupplementary data sectionhiFig. 4 HPLC chromatogram of mixed standards (a) and fingerprintprofiles of LyC (b) from multiple batches. The numbers 1–6 in b indi‑cate the common fingerprinting peaks for identificationfrom Sichuan presented the proper amounts of kukoamines, while other samples did not contain any kukoamines. The “Bai Digupi” on the market was actually notfrom the root bark of either L. chinense or L. barbarum.The lack of kukoamines in the investigated LyC extractpowder might be caused by an inappropriate extractionNumber of outlier samples. The data are referenced to Table 1Percentage of samples with kukoamine contents outside the calculated limitsmethod that damaged the major bioactive compounds,or extraction from the wrong source plants.Compared with the conventional morphological identification, the proposed HPLC method for monitoring thecharacteristic constituents KA and KB provides a simpleand universal way to measure the quality of LyC samples. The method and calculated content limits presentedin this article could support amendments to the qualitystandards for LyC in official compendiums.
Li et al. Chin Med (2017) 12:4Page 7 of 8Received: 2 November 2016 Accepted: 6 December 2016Fig. 5 Quality assessment of LyC sliced samples and extracts frommarkets. RLyC Hong Digupi, WLyC Bai Digupi, LyC E 01–03 LyC extractsfrom manufacturers 01–03ConclusionThe developed method could be applied for qualityinspection of LyC in the food and pharmaceutical manufacturing industries.Additional filesAdditional file 1: Table S1. Comparison of LyCs from L. chinensis and L.barbarum in terms of kukoamines A and B using ANOVA test.Additional file 2. Equations for calculation of the content limits ofkukoamines.AbbreviationsLyC: Lycii Cortex; KA: kukoamine A; KB: kukoamine B; HPLC: high performanceliquid chromatography; LOQ: limit of quantification; MDL: method detectionlimit; RSD: relative standard deviation; TFA: trifluoroacetic acid.Authors’ contributionsLYY and DR conceived and designed the study. CHY secured financial supportand oversaw the whole study. DR, LYY, and HWL performed the experiments.HYQ performed the statistical analysis. LYY and DR drafted the manuscript andCHY revised it. All authors read and approved the final manuscript.Author details1Research Group for Bioactive Products, Department of Biomedical Sciences,City University of Hong Kong, Hong Kong SAR, China. 2 Key Laboratoryof Biochip Technology, Shenzhen Biotech and Health Centre, City Universityof Hong Kong, Shenzhen 518057, China. 3 Present Address: System and Trans‑lational Science Center, RTI International, Research Triangle Park, NC 27709,USA.AcknowledgementsThe authors also extend their gratitude to Mr. William T. Mahan for languageediting.Competing interestsThe authors declare that they have no competing interests.FundingHong Kong Chinese Materia Medica Standards, Department of Health, HongKong Government, SAR, China, for the CityU project (No. 9210029).References1. Ministry of Health of RP China. Document for further management ofmaterials for manufacture functional food. 2002. ce0d894051b15490aa3219cdc4.shtml.2. Yao X, Peng Y, Xu LJ. Phytochemical and biological studies of Lyciummedicinal plants. Chem Biodivers. 2011;8:976–1010.3. Potterat O. Goji (Lycium barbarum and L. chinese): phytochemistry, phar‑macology and safety in the perspective of traditional uses and recentpopularity. Planta Med. 2010;76:7–19.4. Committee of National Pharmacopoeia. Pharmacopoeia of the People’sRepublic of China. Beijing: Chemical Industry Press; 2010. p. 115.5. Ministry of Health. Labor and welfare: The Japanese pharmacopoeia.Tokyo: Pharmaceuticals and Medical Devices Agency; 2012. p. 1686.6. Korea Food and Drug Administration. The Korean herbal pharmacopoeia.Seoul: Ministry of health family welfare of South Korea; 2007. p. 1058–9.7. Liang XM, Jin Y, Wang YP. Qualitative and quantitative analysis inquality control of traditional Chinese medicines. J Chromatogr A.2009;1216:2033–44.8. Lau AJ, Woo SO, Koh HL. Analysis of saponins in raw and steamed Panaxnotoginseng using high-performance liquid chromatography with diodearray detection. J Chromatogr A. 2003;1011:77–87.9. Shi Z, He J, Yao T. Simultaneous determination of cryptotanshinnone,tanshinone I and tanshinone IIA in traditional Chinese medicinal prepara‑tions containing Radix salvia miltiorrhiza by HPLC. J Pharm Biomed Anal.2005;37:481–6.10. Wu HF, Guo J, Chen SL. Recent developments in qualitative and quan‑titative analysis of photochemical constituents and their metabolitesusing liquid chromatography-mass spectrometry. J Pharm Biomed Anal.2012;72:267–91.11. Chu QC, Fu L, Lin M. Study on bioactive ingredients in Cortex Lycii bycapillary zone electrophoresis with amperometric detection. Chin J AnalChem. 2005;33:1611–4.12. Li K, Chen XH, Bi KS. Determination of vanillic acid in Cortex Lycii by RPHPLC. Chin Tradit Herbal Drugs. 2005;36:446–7.13. Li K, Li Q, Yuan JS. Determination of scopoletin in Cortex Lycii by RP-HPLC.Chin Pharm J. 2005;40:1741–2.14. Li YY, Di R, Baibado JT. Identification of kukoamines as the novel markersfor quality assessment of Lycii Cortex. Food Res Int. 2014;35:373–80.15. Zhang JX, Guan SH, Yang M. Simultaneous determination of 24 constitu‑ents in Cortex Lycii using high-performance liquid chromatography-triplequadrupole mass spectrometry. J Pharm Biomed Anal. 2013;77:63–70.16. Cheung HY, Li YY, Di R, Process for isolating kukoamine. USP 9012687B2.17. US Environmental Protection Agency. Technique support documentfor the assessment of detection and quantitation approaches. EPA821-R-03-005, Washington D.C. 2003.18. ICH, H. T. G. Validation of Analytical Procedure: Methodology (Q2B). Inter‑national conference on harmonization. USA; 1997.19. International Organization for the Standardization: ISO/IEC Guide 98-3uncertainty of measurement—part 3: guide to the expression of uncer‑tainty in measurement (GUM: 1995). Geneva; 2008.20. Ellison SLR, Roesslein M, Williams A. EURACHEM/CITAC Guide: quantifyinguncertainty in analytical measurement, 2nd ed. 2000. http://www.vtt.fi/ket/eurachem/quam2.pdf.21. Barwick VJ, Ellison SLR. VAM Project 3.2.1 Development and Harmonisa‑tion of Measurement Uncertainty Principles Part (d): Protocol for Uncer‑tainty Evaluation from Validation Data, Version 5.1, LGC (Teddington) Lim‑ited. 2000. http://blpd.dss.go.th/knowledge el/VAM uncertainty-0452.pdf.22. Parr A, Mellon FA, Colquhoun IJ. Dihydrocaffeoyl polyamines (kukoamineand allies) in potato (Solanum tuberosum) tuber detected during metabo‑lite profiling. J Agr Food Chem. 2005;53:5461–6.23. Rogoza LN, Salakhutdinov NF, Tolstikov GA. Plant alkaloids of the polym‑ethyleneamine series. Russ Chem Rev. 2005;74:381–96.
Li et al. Chin Med (2017) 12:424. Cai B, Li J. Evaluation of trifluoroacetic acid as an ion-pair reagent in theseparation of small ionizable molecules by reversed-phase liquid chroma‑tography. Anal Chim Acta. 1999;399:249–58.25. Li YY, Wang H, Zhao C, Huang Y, Tang X, Cheung HY. Inentification andcharacterization of kukoamine metabolites by multiple ion monitoringtriggered enhanced product ion scan method with a triple-quadruplelinear ion trap mass spectrometer. J Agric Food Chem. 2015;63:10785–90.26. Sjödin M, Irebo T, Utas JE, Lind J, Merényi G, Akermark B, Hammarström L.Kinetic effects of hydrogen bonds on proton-coupled electron transferfrom phenols. J Am Chem Soc. 2006;128:13076–83.27. Wagner H, Bauer R, Melchart D. Chromatographic fingerprint analysis ofherbal medicines: thin-layer and high performance liquid chromatogra‑phy of Chinese drugs (vol 1). New York: Springer; 2011. p. 509–19.Page 8 of 828. Yi LZ, Yuan DL, Liang YZ. Quality control and discrimination of PercarpiumCitri Reticulatae and Pericarpium Citri Reticulatae Viride based onhigh-performance liquid chromatographic fingerprints and multivariatestatistical analysis. Anal Chim Acta. 2007;588:207–15.29. Liang YZ, Xie PS, Chan K. Quality control of herbal medicines. J Chroma‑togr A. 2004;812:53–70.30. Zhao ZZ, Yuen JPS, Wu J. A system study on confused species of ChineseMateria Medica in the Hong Kong market. Ann Acad Med Singapore.2006;35:764–9.Submit your next manuscript to BioMed Centraland we will help you at every step: We accept pre-submission inquiries Our selector tool helps you to find the most relevant journal We provide round the clock customer support Convenient online submission Thorough peer review Inclusion in PubMed and all major indexing services Maximum visibility for your researchSubmit your manuscript atwww.biomedcentral.com/submit
Establishment of HPLC conditions for determination of kukoamines Selection of column, mobile phase, and detection wavelength KA and KB are water-soluble spermine alkaloids with multiple amino and amide groups [23] that cause 22, peak tailing on the C 18 packing material. Three kinds of C 18 columns with special coatings on the packing surface,