Transcription
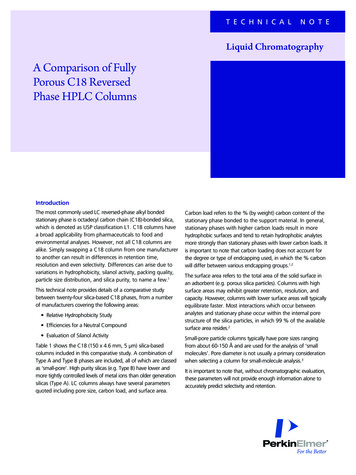
T E C H N I C A LN O T ELiquid ChromatographyA Comparison of FullyPorous C18 ReversedPhase HPLC ColumnsIntroductionThe most commonly used LC reversed-phase alkyl bondedstationary phase is octadecyl carbon chain (C18)-bonded silica,which is denoted as USP classification L1. C18 columns havea broad applicability from pharmaceuticals to food andenvironmental analyses. However, not all C18 columns arealike. Simply swapping a C18 column from one manufacturerto another can result in differences in retention time,resolution and even selectivity. Differences can arise due tovariations in hydrophobicity, silanol activity, packing quality,particle size distribution, and silica purity, to name a few.1This technical note provides details of a comparative studybetween twenty-four silica-based C18 phases, from a numberof manufacturers covering the following areas: Relative Hydrophobicity Study Efficiencies for a Neutral Compound Evaluation of Silanol ActivityTable 1 shows the C18 (150 x 4.6 mm, 5 µm) silica-basedcolumns included in this comparative study. A combination ofType A and Type B phases are included, all of which are classedas ‘small-pore’. High purity silicas (e.g. Type B) have lower andmore tightly controlled levels of metal ions than older generationsilicas (Type A). LC columns always have several parametersquoted including pore size, carbon load, and surface area.Carbon load refers to the % (by weight) carbon content of thestationary phase bonded to the support material. In general,stationary phases with higher carbon loads result in morehydrophobic surfaces and tend to retain hydrophobic analytesmore strongly than stationary phases with lower carbon loads. Itis important to note that carbon loading does not account forthe degree or type of endcapping used, in which the % carbonwill differ between various endcapping groups.1,2The surface area refers to the total area of the solid surface inan adsorbent (e.g. porous silica particles). Columns with highsurface areas may exhibit greater retention, resolution, andcapacity. However, columns with lower surface areas will typicallyequilibrate faster. Most interactions which occur betweenanalytes and stationary phase occur within the internal porestructure of the silica particles, in which 99 % of the availablesurface area resides.2Small-pore particle columns typically have pore sizes rangingfrom about 60-150 Å and are used for the analysis of ‘smallmolecules’. Pore diameter is not usually a primary considerationwhen selecting a column for small-molecule analysis.3It is important to note that, without chromatographic evaluation,these parameters will not provide enough information alone toaccurately predict selectivity and retention.
Table 1. LC column stationary phase specifications for twenty-four C18 150 x 4.6 mm, 5 µm columns from various manufacturers investigated in these studies.ColumnCarbon Load (%)Pore size (Å)Surface Area (m2/g)End cappingSilica Type (A/B)ACE 5 C1815.5100300YesBAtlantis C1812.0100330YesBBrownlee Analytical C1813.0110180YesABrownlee Validated C1820.0100300YesBGemini C1814.0110375YesBHypersil BDS C1811.0130170YesAHypersil Gold C1810.0175220YesBHypersil ODS10.0120170YesAInertsil ODS-218.5150320YesBInertsil ODS-315.0100450YesBInertSustain C1814.0100350YesBKromasil C1820.0100320YesBLuna C18 (2)17.5100400YesBProdigy ODS-315.5100450YesBQuasar C1817.0100380YesBSymmetry C1819.1100335YesBXBridge C1818.0130185YesBXSelect CSH C1815.0130185YesBXSelect HSS C1815.0100230YesBXTerra MS C1815.5125175YesBYMC-Pack ODS-A17.0120330YesBZorbax Eclipse XDB-C1810.080180YesBZorbax Extend-C1812.580180YesBZorbax SB-C1810.080180NoBRelative Hydrophobicity StudyComparison of HydrophobicityHydrophobicity is a measure of the bonded stationary phase’s abilityto hydrophobically interact with analyte carbon groups. In this study,only C18 alkyl stationary phases have been considered. The retentionfactor (k) is a method of evaluating how much interaction the analytehas had with the alkyl chain.k is calculated using the retention time of the analyte and the time atwhich an unretained compound elutes (e.g. uracil in reversed-phaseHPLC) (Equation 1). It is considered best practice to have a k valuebetween 2-10 for good separations. The k value for a hydrophobic/neutral compound (toluene is commonly used and was investigatedin this study) is a good marker of hydrophobicity.k (tr – t0)t0Equation 1. Retention factor (k) equation, where tr is the retention time of the analyte, and t0is the time at which the unretained compound elutes.42Low k values ( 1) indicate little to no retention has taken place,which can be problematic. In cases such as these, potential impuritiescan easily co-elute, resulting in poor selectivity. Higher k values indicatethat the analyte is more highly retained. A stationary phase withgreater hydrophobicity will experience greater analyte retention (thusgreater k) for a hydrophobic compound.4,5 Excessive retention reducessample throughput, with increased analysis times, and the peak heightwill also decrease as peak bandwidth increases.5 However, there isscope to reduce longer run times by switching to a less hydrophobicphase (e.g. C18 to a C8).Some benefits of increased retention include: Greater opportunity to resolve analytes without increasingcolumn length. Water content of the mobile phase does not need to beincreased to improve retention, yielding greater MS sensitivity.
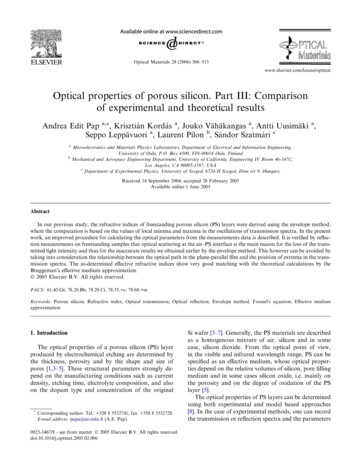
Figure 1 shows the chromatograms of a neutral compound test mixobtained on a selection of columns within the study with differinglevels of hydrophobicity. Figure 2 details the k values obtained fortoluene on the C18 phases, from the most retentive to the least.Columns such as the XSelect HSS C18 and Luna C18 (2) providemoderate retention. However, PerkinElmer’s Quasar C18 phase is amongthe more retentive phases due to the high surface area, combined withits optimised C18 ligand bonding process. This gives Quasar, and othersimilarly retentive phases, greater opportunity to resolve analytes withoutincreasing the column length.The InertSustain C18 also demonstrated a high k value for toluene.However, peaks are broader, which can translate to lower efficiencies,and this is indeed observed when calculating efficiencies. Conversely,the Hypersil Gold C18 demonstrated the least retention, with a k valuefor toluene below one. Low k values can cause issues withreproducibility and can cause a column to fail method validation.Mobile Phase: 80/20 (MeOH/H2O)Flow Rate: 1 mL/minTemperature: 25 ºCWavelength: 254 nmFigure 1. Chromatograms of a neutral compound test mix on C18 columns of varying hydrophobicity. Elution order: uracil, dimethyl phthalate, toluene, biphenyl, phenanthrene.Figure 2. C18 phases ranked according to k value of toluene.3
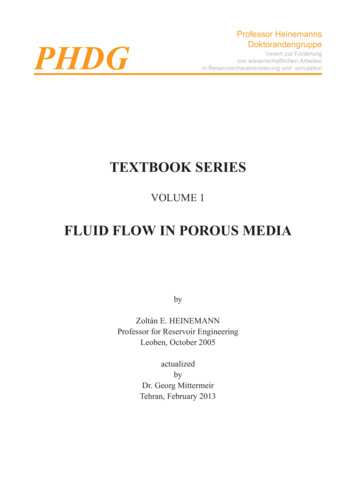
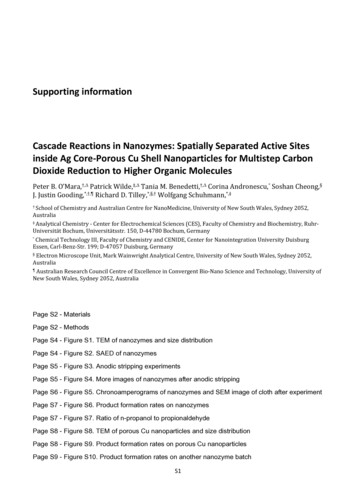
Comparison of Column EfficiencyHigh retention needs to be accompanied by good peak shape for themost effective separations. Therefore, it is important to calculatecolumn efficiencies (of toluene in this instance) to gain insight intooverall column performance.Figure 4 shows the column efficiencies (N/m) obtained for tolueneusing the C18 columns included in this study. The data was obtainedusing the same neutral test mix as in the hydrophobicity study. Figure 5illustrates the efficiency of toluene obtained on a selection of columns.High efficiencies were observed on several columns including BrownleeValidated C18, Luna C18 (2), and ACE 5 C18. However, much higherefficiencies were obtained on various columns, including Quasar C18.Higher efficiencies generally indicate narrower peaks, and thus allowgreater scope to resolve critical pairs.Column efficiency is a measure of the peak dispersion on the column,which reflects the column performance. It is typically reported as plates(N) or plates per meter (N/m). For a given column length, a greaternumber of plates implies less dispersion of chromatographic bands,narrower peaks, and a more efficient separation.6 Column packingquality, column dimensions, particle size, and formation of voids withinthe column all contribute to the column efficiency. It is important tonote that later eluting peaks, which look broad in comparison withearly eluting peaks, may have a higher column efficiency.5Figure 6 demonstrates a comparison between the efficiencies andretention of toluene for each of the columns. In the hydrophobicitystudy, the InertSustain C18 showed to be slightly more retentive thanQuasar C18. However, high retention needs to be accompanied by goodpeak shape, and the InertSustain C18 did not show good peak shapewhen compared with Quasar C18 (Figure 7); it demonstrated 30 % lessefficiency for toluene.There are various methods of calculating column efficiency, including theFoley-Dorsey method (Figure 3a) and Tangential methods (Figure 3b). Inthis study, the USP compliant tangential method has been used as it iswidely adopted by the industry.Additionally, by using Figure 6 as a guide, if a user switches from anXTerra MS C18 or Symmetry C18 to a Quasar C18, they could expectto observe a more efficient separation, with sharper peaks and greaterretention for neutral compounds. Greater efficiency enhances theresolving power of the column and improves critical peak pair separation.If a method measures relative retention, then switching phases poses lessof an issue. If, however, the method measures absolute retention andthere is a fixed retention window, adjustments would need to be madeto the mobile phase composition to alter the analyte retention profile.Using a neutral compound (such as toluene) for efficiency measurementsallows retention from unwanted secondary interactions to be minimized.This ensures the primary interaction is the hydrophobic interactionbetween the alkyl chain and the neutral analyte; that in turn enables thedata generated to provide a greater indication on factors such as particlesize, packing efficiency, and particle size distribution. Smaller averageparticle sizes, higher quality packing and narrow particle size distributionsall tend to result in higher efficiencies.6(a)(b)Figure 3. Foley-Dorsey approximation method (a) and Tangential method (b) for calculating column efficiency.7,84
Figure 4. Column efficiencies (N/m) obtained for toluene for C18 150 x 4.6 mm, 5 µm columns.Figure 5. Comparison of various C18 columns for toluene peak shape. LC conditions: 80/20 (MeOH/H2O) at 1 mL/min, 254 nm PDA detection, 25 oC oven temperature.5
Figure 6. C18 columns ranked by retention and efficiency of toluene. (*Hypersil ODS and Hypersil BDS experienced similar k and column efficiency).Quasar C18p.w. 50 % 5.34 sp.w. 10 % 10.00 sInertSustain C18p.w. 50 % 6.87 sp.w. 10 % 13.06 sFigure 7. Toluene peak obtained using Quasar C18 (blue) and InertSustain C18 (orange) with peak widths (p.w.) shown at 50 % and 10 % peak height.The YMC ODS-A phase showed the highest column efficiency fortoluene, with the second ranking being Quasar C18. However, whenobserving the backpressures of these two columns, YMC ODS-Agenerated much higher backpressure than Quasar C18, 2020 psi asagainst 1660 psi respectively, a 22 % increase. Packing particle size isone of the largest factors which influences backpressure. Whilst smallerparticles yield higher efficiencies, they also result in higher backpressures.6The backpressure observed for the YMC ODS-A phase is more indicativeof a 4 µm phase, as opposed to a 5 µm phase. Continuous use of LCcolumns under higher backpressures leads to deterioration in overallcolumn efficiency, which can be detrimental to column lifetime. It mayalso limit the method development scope, specifically in terms of beingunable to use faster flow rates necessary for rapid analysis.
Figure 8 shows a comparison of the column efficiencies obtained fortoluene and the backpressures observed for a selection of columns. Areasonable mid-range backpressure was observed using Quasar. Thisallows Quasar to operate easily at higher flow rates and stay withinpressure limitations of the pump and column. Conversely, thebackpressure observed using the Zorbax Extend C18 was relatively low,but this phase also showed a much lower efficiency. Lower efficienciesindicate broader peaks, which can reduce the resolving power of thecolumn. The XTerra MS, however, combined two unfavorable features,higher backpressure and very low efficiency.Below pH 3, hydrogen bonding dominates and residual silanol groupstend to be in the less active un-ionized form.1,10Silica purity is an important factor for LC columns in order to obtainpeaks with little tailing and maintain high efficiency separations.Surface metals (M ) can further activate free silanol groups, makingthem even more acidic, and become even more likely to interact withbasic analytes. High purity silicas (e.g. Type B) have lower and moretightly controlled levels of metal ions than older generation silicas(Type A). These properties result in lower silanol activity and betterpeak shape for basic compounds.12Efficiencies and peak shapes of basic compounds are affected by silanolinteractions, thus comparison of efficiency and tailing factors for a basiccompound, such as pyridine (used in this study), can be used as anindicator of silanol activity. Phases with ‘very low’ levels of silanol activitytend to also have higher column efficiencies.10The tailing factor is a measure of peak tailing, which is calculated usingthe equation shown in Figure 11 at 5 % peak height. A tailing factor ofone indicates a perfectly symmetrical peak. Peak tailing occurs when thetailing factor is 1, and peak fronting occurs when the tailing factor is 1. Calculation at 5 % peak height, rather than at 10 %, provides amore rigorous test and better discrimination between phases.Figure 8. Comparison of toluene column efficiency and backpressure for a selection ofC18 columns.Evaluation of Silanol ActivityUsing neutral compounds are useful for determining packing efficiencyand efficiency of a column. However, it does not indicate the activity ofthe silica surface or how the column might perform when separatingbasic/cationic compounds. Basic compounds can frequently interact withweakly acidic underivatized residual silanols (Si-OH) on the surface of thesilica particles. This unwanted secondary retention causes the analytes tobe retained longer than the ‘bulk’ of the analyte molecules, which resultsin peak tailing and impacts on the separation efficiency of the column.9Ion-exchange and hydrogen bonding are thought to be the two mostsignificant interactions which govern the process.10The secondary retention is most problematic when the column is usedbetween pH 4 – 8, in which ion-exchange governs the interactionprocess. Within this range, ionized silanols (SiO-) (Figure 9) can formion-exchange sites which interact with protonated bases and causesecondary retention (Figure 10).11Figure 9. Unionized silanol (Si-OH) (left) and ionized silanol (SiO-) (right).Figure 10. Ion-exchange interaction between a protonated basic compound (XH ) and anionized silanol group, which often results in peak tailing.11Figure 11. Tailing factor equation and method.7
Figure 12 shows the tailing factors for pyridine using the C18 columnsincluded in the study. The mobile phase conditions were at near neutralpH to promote interaction between pyridine and silanols. No buffer wasused in this study as its presence in the mobile phase can mask potentialinteractions of the silica surface and the analyte.The Quasar C18 phase demonstrated excellent peak shape with verylow tailing (T 1.29) when compared with other phases (e.g. XSelectHSS, T 1.93), due to its ultra-high purity silica base and low residualsilanol activity.The YMC ODS-A and Kromasil C18 columns both show high efficienciesin neutral separation and ranked in the top group; conversely, theydemonstrated lower rankings in the silanol activity study. Much higherpeak tailing is observed when they are compared with Quasar C18, withtailing factors of 2.26 and 3.04 respectively. These results indicate thattheir silica surfaces cause more unwanted secondary interactions withbasic compounds (Figure 13).As expected, the highly acidic, traditional, type A silicas (HypersilBDS, Brownlee Analytical C18 and Hypersil ODS) showed extremelystrong retention of pyridine, with very broad to no elution over a30-minute period.Figure 12. Tailing factors (5 %) obtained for pyridine for the C18 150 x 4.6 mm, 5 µm columns.Figure 13. Pyridine peak obtained using Quasar C18 at 2.45 mins (blue), YMC ODS-A at 2.40 mins (red), and Kromasil C18 at 2.22 mins (black).8
As mentioned previously, column efficiency can be calculated usingtangential methods or the Foley-Dorsey method. The latter method,used in the silanol activity study, provides a more accurate calculationof theoretical plates by introducing equation parameters whichaccommodate the peak asymmetry.13Figure 14 shows the column efficiencies (N/m) obtained for pyridine forthe C18 columns included in this study. Figure 15 illustrates a fewexamples of the pyridine peak shape obtained on different columns.High efficiencies were obtained on the Inertsil ODS-3 and Zorbax EclipseXDB-C18. However, Quasar C18 demonstrated the highest efficiency forpyridine, with a value of 44,185 N/m.The YMC ODS-A phase demonstrated excellent efficiency for neutralcompounds but produced very low column efficiency for pyridine. Whencompared with the Quasar C18, the YMC ODS-A showed a 74 % dropin efficiency. Additionally, Kromasil C18 demonstrated very highefficiency for neutral compounds, but showed extremely low efficiencyfor pyridine. In comparison with Quasar C18, a 90 % drop in efficiencyfor pyridine was observed.Figure 14. Column efficiencies (Foley-Dorsey) obtained for pyridine for all C18 150 x 4.6 mm, 5 µm columns.Figure 15. Comparison of various C18 columns for column efficiency of pyridine and peak shape. LC conditions: 60/40 (MeOH/H2O) at 1 mL/min, 254 nm PDA detection,25 oC oven temperature.9
Figure 16. Column efficiency of pyridine vs. retention (k) of toluene for all C18 columns.A plot of pyridine column efficiency against retention (k) of toluene(Figure 16) shows how the columns compare for the two tests. TheInertsil ODS-3 and Quasar C18 phases both show high retention fortoluene and high efficiency for pyridine, with Quasar being moreefficient than the Inertsil ODS-3. As such phases yield efficientseparations, with good resolution, there is scope to optimize methodsand reduce overall run times which in turn improves productivity.Conversely, columns such as Atlantis C18 and XTerra MS C18 showmuch reduced retention for toluene and much lower efficiencies forpyridine. For less retentive columns, such as these, the water content ofthe mobile phase would need to be increased to improve retention,which would result in lower MS sensitivity. Additionally, Kromasil C18 isan example of a column demonstrating high retention for toluene, adesirable attribute, but extremely low efficiency for the basic compoundpyridine. This enhanced retention allows greater opportunity to resolveanalytes without increasing column length. However, poor efficienciesare the result of poor peak shape which can also degrade the resolvingpower and cause difficulty in resolving critical peak pairs.ConclusionIn this in-depth study, evaluation of relative hydrophobicity,efficiencies for a neutral compound, and silanol activity have beeninvestigated for twenty-four silica-based C18 phases. It has beenshown that, despite being the same bonded phase, there aredifferences between these columns. This study provides a guide tohelp with alternative column selection.10PerkinElmer’s Quasar C18 phase has shown to have a highly retentivestationary phase due to the high surface area of the silica, combinedwith the optimized ligand bonding process applied. Highly retentivephases provide greater opportunity to resolve analytes without increasingthe column length or increasing the mobile phase water content. MSsensitivity is enhanced with mobile phase containing low water content.In addition, the backpressures observed using Quasar allows the columnto operate easily at higher flow rates and stay within pressure limitationsof the pump and column.High retention needs to be accompanied by good peak shape, whichQuasar has shown. Quasar demonstrated very high column efficienciesfor neutral compounds, with data for toluene presented. Additionally,Quasar has demonstrated very high efficiency and very low peak tailingfor a basic compound, pyridine, due to its ultra-high purity silica baseand low residual silanol activity.It is important to note that a column which provides desirable separationand characteristics for one application, may not be the most suitable foranother application. However, the comparative data obtained provides agood indicator as to how the columns evaluated might perform forneutral and basic analytes.
References1. LCGC’s CHROMacademy, All HPLC C18s are the same aren’t they?Retrieved from 8-all-the-same.html. Date Accessed: March 2020.2. LCGC’s CHROMacademy, Selecting Reversed Phase Columns.Retrieved from Reversed-Phase-Columns.html. Date Accessed:March 2020.3. The LCGC Blog, Things you should know about your HPLC column,Part I – Pore Sizes and Particle Diameters. Retrieved from re-sizes-and-particle-diameters.Date accessed: March 2020.4. M.W. Dong, Modern HPLC for Practicing Scientists, John Wiley &Sons, Inc., New Jersey, 2006.5. LCGC’s CHROMacademy, The Theory of HPLC ChromatographicParameters. Retrieved from https://www.chromacademy.com/lms/sco2/Theory Of HPLC Chromatographic Parameters.pdf. Dateaccessed: March 2020.6. B.A. Bidingmeyer, Practical HPLC Methodology and Applications,John Wiley & Sons, Inc., New York, 1992.7. J.P. Foley & J.G. Dorsey, Equations for Calculation ofChromatographic Figures of Merit for Ideal and Skewed Peaks, Anal.Chem., 1983, 55, 730-737.8. N.A. Parris, Instrumental Liquid Chromatography: A PracticalManual on High Performance Liquid Chromatographic Methods,Journal of Chromatography Library – Volume 5, Elsevier, TheNetherlands, 1979.9. LCGC’s CHROMacademy, The Theory of HPLC Column Chemistry.Retrieved from https://www.chromacademy.com/lms/sco4/TheoryOf HPLC Column Chemistry.pdf. Date accessed: March 2020.10. M. Kele & P.C. Iraneta, CHROMATOGRAPHY: LIQUID ColumnTesting and Evaluation, Chemistry, Encyclopedia of SeparationScience, 2007, 1-7.11. T. Tuzimski & J. Sherma, High Performance Liquid Chromatographyin Pesticide Residue Analysis, Taylor & Francis Group, Florida, 2015.12. LCGC’s CHROMacademy, HPLC Troubleshooting Guide – PeakTailing. Retrieved from roubleshooting-Peak-Tailing.html. Dateaccessed: March 2020.13. L. Ohannesian & A. Streeter, Handbook of Pharmaceutical Analysis,Marcel Dekker, Inc., New York, 2005.PerkinElmer, Inc.940 Winter StreetWaltham, MA 02451 USAP: (800) 762-4000 or( 1) 203-925-4602www.perkinelmer.comFor a complete listing of our global offices, visit www.perkinelmer.com/ContactUsCopyright 2020, PerkinElmer, Inc. All rights reserved. PerkinElmer is a registered trademark of PerkinElmer, Inc. All other trademarks are the property of their respective owners.75232PKI
Phase HPLC Columns. Introduction . . environmental analyses. However, not all C18 columns are alike. Simply swapping a C18 column from one manufacturer to another can result in differences in retention time, resolution and even selectivity. . illustrates the efficiency of toluene obtained on a selection of columns. High efficiencies were .