Transcription
Supporting informationCascade Reactions in Nanozymes: Spatially Separated Active Sitesinside Ag Core-Porous Cu Shell Nanoparticles for Multistep CarbonDioxide Reduction to Higher Organic MoleculesPeter B. O’Mara,†,Δ Patrick Wilde,‡,Δ Tania M. Benedetti,†,Δ Corina Andronescu, Soshan Cheong,§J. Justin Gooding,*,†,¶ Richard D. Tilley,*,§,† Wolfgang Schuhmann,*,‡† Schoolof Chemistry and Australian Centre for NanoMedicine, University of New South Wales, Sydney 2052,Australia‡ Analytical Chemistry - Center for Electrochemical Sciences (CES), Faculty of Chemistry and Biochemistry, RuhrUniversität Bochum, Universitätsstr. 150, D-44780 Bochum, Germany Chemical Technology III, Faculty of Chemistry and CENIDE, Center for Nanointegration University DuisburgEssen, Carl-Benz-Str. 199; D-47057 Duisburg, Germany§ Electron Microscope Unit, Mark Wainwright Analytical Centre, University of New South Wales, Sydney 2052,Australia¶ Australian Research Council Centre of Excellence in Convergent Bio-Nano Science and Technology, University ofNew South Wales, Sydney 2052, AustraliaPage S2 - MaterialsPage S2 - MethodsPage S4 - Figure S1. TEM of nanozymes and size distributionPage S4 - Figure S2. SAED of nanozymesPage S5 - Figure S3. Anodic stripping experimentsPage S5 - Figure S4. More images of nanozymes after anodic strippingPage S6 - Figure S5. Chronoamperograms of nanozymes and SEM image of cloth after experimentPage S7 - Figure S6. Product formation rates on nanozymesPage S7 - Figure S7. Ratio of n-propanol to propionaldehydePage S8 - Figure S8. TEM of porous Cu nanoparticles and size distributionPage S8 - Figure S9. Product formation rates on porous Cu nanoparticlesPage S9 - Figure S10. Product formation rates on another nanozyme batchS1
MaterialsAll chemicals were obtained from commercial suppliers and used without further purification.Poly(vinylpyrrolidone) Mn 55,000, sodium chloride ( 99.5%), L-ascorbic acid ( 99.0%), poly(ethyleneglycol) methyl ether Mn 5,000, hydrazine solution 35 wt% in water, Nafion 117 solution ( 5% in amixture of lower aliphatic alcohols and water), methanol (HPLC grade), potassium hydrogencarbonate ( 99.95%), anhydrous dimethyl sulfoxide ( 99.9%) and carbon monoxide, carbon dioxide,methane, ethane, ethylene and acetylene were purchased from Sigma-Aldrich/Merck. Ag nitrate( 99.5%), sodium hydroxide ( 98.0%), Cu (II) nitrate ( 99.0%), ethanol (100%) and acetone ( 99.8%)were purchased from Chem-Supply Pty Ltd Australia. Nitric acid (69%) was purchased from VWRInternational Pty Ltd. Deuterium oxide (99.9%) was purchased from Cambridge Isotope LaboratoriesInc.MethodsAll glassware was rinsed with concentrated nitric acid then Milli-Q water. All aqueous solutions wereprepared using Milli-Q water.Ag cores synthesisAg cores were synthesized according to a literature procedure.1 Briefly, 0.425 g poly(vinyl pyrrolidone)Mn 55,000 and 0.425 g Ag nitrate were dissolved in 100 mL water. To this solution, 1.0 mL 5.0 Msodium chloride was added under magnetic stirring. Further stirring for 15 min in the dark led to theformation of a colloidal suspension of AgCl nanoparticles. A solution containing ascorbic acid (100mL, 50 mM) and sodium hydroxide (13 mL, 0.5 M) was prepared. To this solution, 12.5 mL of freshlyprepared AgCl colloids were added under magnetic stirring with further stirring for 2 h in the dark.Using a centrifuge at 6000 rpm (4226 rcf) for 7 min, the reaction mixture was washed twice with waterand concentrated to 14 mL and stored in the dark at 4 C.Porous Cu coating on Ag coresAg-core porous Cu-shell nanoparticles were synthesized using Ag cores synthesized as previouslydescribed with a procedure modified from the literature.2 Briefly, poly(ethylene glycol) methyl etherMn 5,000 solution (60 mL, 2 wt%), Ag nanoparticles (4.0 mL of the previously prepared suspension)and Cu(NO3)2 (1.0 mL, 0.1 M) were mixed under stirring. To this solution, hydrazine (31.8 µL, 35 wt%)was added and left stirring for 3 min. Using a centrifuge at 4000 rpm (1878 rcf) for 15 min, the reactionmixture was separated, and the product washed twice with water. Then using a centrifuge at 5000rpm (2935 rcf) for 15 min, the reaction mixture was washed twice with ethanol and dried at 50 C.Porous Cu nanoparticles synthesisPorous Cu nanoparticles were synthesized in a similar procedure to the Ag-core porous Cu-shellnanoparticles, without the addition of Ag cores. Briefly, poly(ethylene glycol) methyl ether Mn 5,000solution (6.0 mL, 2 wt%) and Cu(NO3)2 (100 µL, 0.1 M) were mixed under stirring. To this solutionhydrazine (3.18 µL, 35 wt%) was added and left stirring for 3 min. Using a centrifuge at 4000 rpm(1878 rcf) for 15 min, the reaction mixture was separated, and the product was washed twice withwater. Then using a centrifuge at 5000 rpm (2935 rcf) for 15 min, the reaction mixture was washedtwice with ethanol and dried at 50 C.TEMFor low magnification imaging, TEM samples were prepared by dipping carbon coated Cu grids in acolloidal solution of nanoparticles and allowing them to dry. Low magnification TEM analysis wasperformed on a Phillips CM200 (200 kV, field emission gun).High resolution transmission electron microscopy was performed with a JEOL microscope (JEM2800) equipped with Schottky-type emission source working at 200 kV, Gatan OneView cameraS2
(4kx4k, 25FPS) to obtain images with a resolution of 0.09 nm. Energy dispersive spectroscopyelemental mapping was performed using double silicon drift detectors, with a solid angle of 0.98steradians with a detection area of 100 mm2.Electrode preparationPlain carbon cloth – 1071 HCB purchased from fuel cell store3 was cut into square pieces with a 2 x2 cm2 area and contacted, sonicated in acetone for 10 min and then dried in a 120 C oven. To ensurecomparability across measurements and to avoid different electrochemical behavior due to varyingsubstrate contributions, precisely controlled particle loading on the substrate was employed. An inksuspension with a concentration of 5 mg·mL-1 particles in methanol and 1 % (v/v) Nafion 117 5 wt%solution was prepared. An aliquot of 336 µL of this suspension was cast dropwise onto a carbon clothsuspended in air by self-closing tweezers. The cloth was left to dry in air, resulting in an absoluteloading of 1.68 mg of particles per cloth.Electrochemical setupH-cell and O-ring fitted clamp electrodes were purchased from TianJin AIDA Science-TechnologyDevelopment Co. Ltd4 with custom made Teflon volume-reducing blocks was employed for CO2reduction experiments. A Fumasep anion exchange membrane, purchased from Fuel Cell Store5.CO2 (Supagas, ultra-high purity) was pre-bubbled through water prior to entering the cathodecompartment. The gas flowrate was set to 1.5 sccm using a needle valve according to a 50 sccm flowmeter purchased from Aalborg6, which measured the flow from the exhaust of the cathodiccompartment. The cathodic and anodic compartments were filled with KHCO3 (15 mL, 0.1 M), pretreated by -1.4 V vs. Ag AgCl sat. KCl overnight and pre-bubbled with vigorous CO2 bubbling for 30min.The working electrode was carbon cloth connected to a platinum clip and the reference electrode wasa custom-built Ag AgCl sat. KCl electrode. For every experiment a new working electrode and freshelectrolyte were employed. Platinum mesh was used as the counter electrode. Chronoamperometrywas run for 2 h at a fixed potential using an Autolab potentiostat controlled with Nova 2.1.2 software.On-line gas product quantification and liquid product analysis were performed before and afterelectrocatalysis. Potentials were converted from vs. Ag AgCl sat. KCl to vs. RHE using the followingformula:𝐸𝑅𝐻𝐸 𝐸𝐴𝑔 𝐴𝑔𝐶𝑙 𝑠𝑎𝑡.𝐾𝐶𝑙 0.058 𝑝𝐻 𝐸 𝐴𝑔 𝐴𝑔𝐶𝑙 𝑠𝑎𝑡.𝐾𝐶𝑙, where pH 6.8 and E Ag AgCl sat.KCl 0.199 vs.SHE.Liquid products were analyzed using 1H-NMR. 500 µL aliquots of electrolyte from the cathodecompartment were taken before and after electrocatalysis. Each aliquot was mixed with 100 µL ofDMSO in D2O stock solution. The DMSO in D2O stock solution was prepared by mixing 5.0 µL DMSOwith 10 mL D2O. NMR aliquots were investigated on Bruker Avance III HD 400 MHz NMR with 64scans and 16 s recycle delay, using DMSO as the internal standard. Product quantification wasperformed via the internal DMSO standard to determine the concentration of CO2 reduction products.Gas products were analyzed using gas chromatography. SRI 8610C multiple gas analyzer #5 gaschromatograph was purchased from SRI Instruments7 and calibrated using carbon monoxide, carbondioxide, methane, ethane, ethylene and acetylene [1% (w/w) each component in nitrogen aerosol of4 L, analytical standard) for calibration. Hydrogen calibration was performed using a gas mixture ofcarbon monoxide, carbon dioxide, hydrogen, methane and oxygen [1% (w/w) each component innitrogen, cylinder of 14 L, analytical standard]. Automatic injection of 1.0 mL gas aliquots was takenfrom the cathode exhaust after 45 min.S3
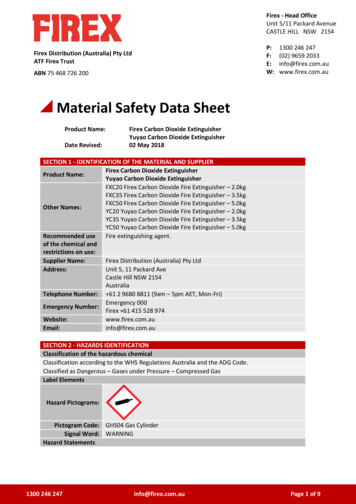
Figure S1. TEM of AgCu nanozymes. TEM images and size distribution histogram showing Ag-coreporous Cu-shell structures with an average diameter of 145 nm (s.d. 15 nm, n 70). Differences incontrast allow for the distinction of Ag cores and Cu shells.b)a)c)Figure S2. SAED of AgCu nanozyme. a) SAED pattern of b) area used for SAED. c) Indexing showsthat the SAED pattern is characteristic of face-centered cubic Ag and cubic Cu2O.S4
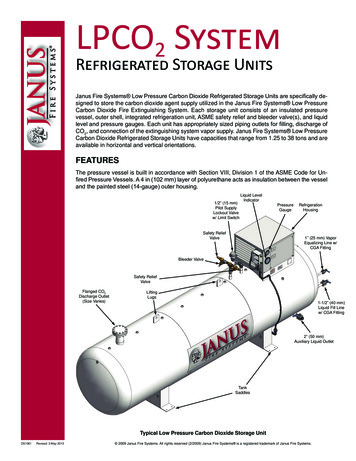
Figure S3. Anodic stripping of Ag from AgCu nanozymes. a) cyclic voltammogram of nanozymes in50 mM KSCN, with three sweeps from 0 to 1 V vs. Ag/AgCl/3 M KCl @ 25 mVs.-1, b) EDX elementalmapping of Ag (green) and Cu (red) for the nanozyme after anodic stripping, c) STEM image ofnanozyme after anodic stripping of Ag with a scan indicated by the dotted red lines d) the line scanof post-anodic-stripping nanozyme. Cyclic voltammetry shows a large oxidation signal in the firstscan, which is presumed to account for the oxidation of the Ag. EDX elemental mapping shows thatthe Ag is no longer confined to the core of the nanozyme, indicating diffusion of Ag out of the coreand redeposition onto the exterior of the nanozyme. STEM imaging shows a central region, which isdarker than the as-synthesized nanozyme (see Figure 1a), indicating a hollow nanozyme structure,with a line scan indicating that the post anodic stripping nanozyme exhibits a hollow core-shellstructure.Figure S4. a) STEM, b) SEM and c) EDX elemental mapping of Ag (green) and Cu (red) ofnanozymes after anodic stripping. STEM imaging shows loss of initial core-shell structure (seeFigure 1a) with no localisation of high contrast Ag to the center of core-shell particles, which isconsistent with EDX elemental mapping showing Ag deposited outside of nanozyme Cu shells.S5
a)b)Figure S5. a) Chronoamperogram of nanozyme catalysts during CO2RR. Chronoamperograms wererecorded for 2 h at different applied potentials vs. Ag AgCl sat. KCl. b) SEM image of the carbon clothelectrode after electrochemical CO2RR experiment.S6
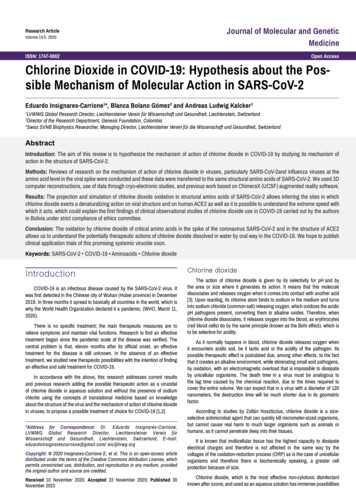
Figure S6. H2, HCO2- and CH4 product formation rates for nanozymes at different potentials vs. RHE.H2 evolution increases significantly at -0.65 V vs. RHE, at the same potential that C3H8O drops in thenanozyme window (see Figure 2). Further increase of H2 production at -0.7 and -0.8 V vs. RHEindicate the competition of H2 for CO2RR. Formate production on the nanozyme peaks at -0.70 V vs.RHE and decreases at -0.80 V vs. RHE. CH4 detection shows trace amounts between -0.55 V and 0.70 V vs. RHE with measurable production by CO2RR at -0.80 V vs. RHE.Figure S7. Ratio of n-propanol to propionaldehyde is derived from the integration of peaks resolvedat 0.780 and 0.775 ppm, which are characteristic of the two products.8S7
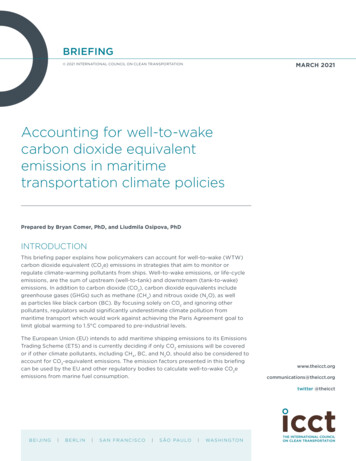
Figure S8. TEM of porous Cu nanoparticles. TEM images and size distribution histogram showingporous Cu nanoparticles with average diameter of 89 nm (s.d. 19 nm, n 84).Figure S9. C3H8O, C2H6O, C2H4, CO, H2, HCO2-, CH4 product formation rates for porous Cu controlnanoparticles at different potentials vs. RHE. Note the lack of production of C3H8O on the porous Cunanoparticles at -0.60 and -0.65 V vs. RHE, where C3H8O is detectable for the nanozyme at thesepotentials. Another significant difference in the formation rates for the porous Cu nanoparticles is thedecrease of CO production at -0.80 V vs. RHE, where the nanozyme exhibits increased COproduction instead.S8
Figure S10. C3H8O, C2H6O, C2H4, CO, H2, HCO2-, CH4 product formation rates for a second batch ofnanozyme particles at different potentials vs. RHE, confirming the previously observed potentialwindow, in which the nanozymes promote the cascade reaction.S9
Page S6 - Figure S5. Chronoamperograms of nanozymes and SEM image of cloth after experiment Page S7 - Figure S6. Product formation rates on nanozymes Page S7 - Figure S7. Ratio of n-propanol to propionaldehyde Page S8 - Figure S8. TEM of porous Cu nanoparticles and size distribution Page S8 - Figure S9. Product formation rates on porous Cu .