Transcription
ClickHereJOURNAL OF GEOPHYSICAL RESEARCH, VOL. 112, D10S02, doi:10.1029/2006JD007589, 2007forFullArticleA chemical ionization mass spectrometry technique for airbornemeasurements of ammoniaJ. B. Nowak,1,2 J. A. Neuman,1,2 K. Kozai,1,2,3 L. G. Huey,4 D. J. Tanner,4J. S. Holloway,1,2 T. B. Ryerson,2 G. J. Frost,1,2 S. A. McKeen,1,2 and F. C. Fehsenfeld1,2Received 31 May 2006; revised 30 October 2006; accepted 9 November 2006; published 10 February 2007.[1] A chemical ionization mass spectrometer (CIMS) utilizing protonated acetonedimer ion chemistry to measure gas-phase ammonia (NH3) from the NOAA WP-3Daircraft is described. The average sensitivity determined from in-flight standard additioncalibrations ranged from 2.6 to 5 ion counts s 1 pptv 1, depending on flow conditions,for 1 MHz of reagent ion signal. The instrument time response was determined to be5 s from the 2 e-folding signal decay time after removal of a standard addition calibration.The instrumental background varied from flight to flight ranging from 0.5 to 1.3 ppbv.The variability between successive background measurements ranged from 50 pptv to100 pptv. Total uncertainty for the 5 s data was conservatively estimated to be (30% 125 pptv). Two NH3 sources were sampled during the New England Air QualityStudy–Intercontinental Transport and Chemical Transformation (NEAQS-ITCT) 2004campaign, one urban and one agricultural. During the 25 July flight, enhancements in NH3mixing ratios were coincident with enhancements in CO, NOx, and SO2 mixing ratiosdownwind of New York City. The NH3 mixing ratios in the urban outflow plume rangedfrom 0.4 to 1 ppbv, or enhancements of 0.2 to 0.8 ppbv above local background. Duringthe 15 August flight, NH3 mixing ratios were enhanced 0.3 to 0.45 ppbv above localbackground directly downwind of an agricultural area northeast of Atlanta, Georgia. TheNH3 CIMS instrument has shown the ability to measure sub-ppbv NH3 levels at high timeresolution from an aircraft.Citation: Nowak, J. B., J. A. Neuman, K. Kozai, L. G. Huey, D. J. Tanner, J. S. Holloway, T. B. Ryerson, G. J. Frost, S. A. McKeen,and F. C. Fehsenfeld (2007), A chemical ionization mass spectrometry technique for airborne measurements of ammonia,J. Geophys. Res., 112, D10S02, doi:10.1029/2006JD007589.1. Introduction[2] Ammonia (NH3) is the dominant gas-phase base inthe troposphere. As a consequence NH3 abundance influences aerosol nucleation and composition [Ball et al., 1999;Gaydos et al., 2005; Hanson and Eisele, 2002; McMurry etal., 2005; Weber et al., 1998] and affects regional airquality, atmospheric visibility, and acid deposition patterns[ApSimon et al., 1987; Erisman and Schaap, 2004]. Majorsources of NH3 to the troposphere include biomass burningand anthropogenic emissions from livestock waste, largescale application of fertilizer, and automobile emissions[Dentener and Crutzen, 1994; Schlesinger and Hartley,1992; Fraser and Cass, 1998; Kean et al., 2000; Moeckli1Cooperative Institute for Research in Environmental Sciences,University of Colorado, Boulder, Colorado, USA.2Chemical Sciences Division, Earth System Research Laboratory,NOAA, Boulder, Colorado, USA.3Now at Department of Mathematics, Harvey Mudd College,Claremont, California, USA.4School of Earth and Atmospheric Sciences, Georgia Institute ofTechnology, Atlanta, Georgia, USA.Copyright 2007 by the American Geophysical Union.0148-0227/07/2006JD007589 09.00et al., 1996; Perrino et al., 2002]. Despite its importance,there are few observations of NH3 above the planetaryboundary layer. Some of the earliest were by filter ordenuder techniques that required sampling times ( 15 min)that are not well suited to aircraft traveling at speeds of100 m s 1 or greater [LeBel et al., 1985; Alkezweeny et al.,1986]. NH3 observations in concentrated plumes frombiomass burning sources, where NH3 mixing ratios aretypically greater than 10 ppbv, have been reported [Hurstet al., 1994; Yokelson et al., 1999, 2003a; Goode et al.,2000; Sinha et al., 2003]. However, NH3 mixing ratios aslow as 0.1 ppbv have been hypothesized to influenceimportant atmospheric processes, such as new particleformation [e.g., Gaydos et al., 2005]. A sensitive and fasttime resolution technique has been used in a ground study toexamine urban NH3 emissions [Li et al., 2006]. However, tofurther understand the distribution of NH3 throughout theatmosphere, its role in atmospheric processes such asaerosol formation, and the impact of anthropogenic andagricultural NH3 sources on regional air quality, fast timeresolution, sub-ppbv airborne observations are needed.[3] This paper describes a new airborne chemical ionization mass spectrometer (CIMS) instrument used to measureNH3 from the National Oceanic and Atmospheric Admin-D10S021 of 12
D10S02NOWAK ET AL.: AIRBORNE CIMS NH3 MEASUREMENTSistration (NOAA) WP-3D aircraft during the New EnglandAir Quality Study – Intercontinental Transport and Chemical Transformation (NEAQS-ITCT) study in July andAugust 2004 [Fehsenfeld et al., 2006]. In this paper wedescribe the inlet, flow tube reactor, calibration system, andion-molecule reaction scheme. The instrument detectionsensitivity, precision, and time response are characterizedusing flight data. Lastly, the utility of these NH3 observations is demonstrated by examining two plumes, one urbanand one agricultural, sampled during NEAQS-ITCT 2004.2. Instrument Description[4] Various types of chemical ionization techniques havebeen used to measure atmospheric trace gases [Clemitshaw,2004; de Gouw and Warneke, 2006; Huey, 2006, andreferences therein]. CIMS techniques use ion-moleculereactions to selectively ionize and detect trace species ofinterest in ambient air. This airborne NH3 instrument(Figure 1) was developed from an aircraft nitric acid(HNO3) CIMS instrument [Neuman et al., 2002] and twoground-based NH3 CIMS instruments [Fehsenfeld et al.,2002; Nowak et al., 2006]. The inlet, low-pressure flow tubereactor, and quadrupole mass spectrometer are similar to theairborne HNO3 instrument described by Neuman et al.[2002]. However, the ion chemistry and instrument background determination are different than previously used inthe ground-based NH3 CIMS instruments. Other modifications include the addition of a collisional dissociationchamber (CDC) and an octopole ion guide [Tanner et al.,1997; Slusher et al., 2004]. The inlet delivers ambient air toa low-pressure flow tube reactor, where ions are produced toselectively cluster with NH3. The ions are passed throughthe CDC where water clusters are broken off the parent ions.Finally, the ions are guided through the vacuum chamber byan octopole ion guide into a quadrupole mass spectrometer,where they are filtered and detected with an electronmultiplier.2.1. Inlet[5] Fast time resolution measurements of traces gases,like NH3 and HNO3, are difficult because these gasesreadily adsorb and/or desorb from surfaces [Neuman etal., 1999; Yokelson et al., 2003b]. Laboratory tests similarto those described in the work of Neuman et al. [1999]were performed to determine the most appropriate inletmaterial. Other NH3 instruments have used glass, Teflon,and halocarbon wax-coated steel inlets [Owens et al., 1999;Fehsenfeld et al., 2002; Yokelson et al., 2003b]. Inletmaterials tested in this study were tetrafluoroethylene(TFE) Teflon, fluorinated ethylene-propylene (FEP) Teflon,perfluoro-alkoxy (PFA) Teflon, polyvinylidene fluoride(PVDF), 6061 aluminum, 304 stainless steel, Dekabon1300, borosilicate glass, nylon 6, and nylon 11. Thesample inlet tubes were cut to a length of 0.34 m withinternal diameters ranging from 3 to 5 mm. All tubes werecleaned by flushing with distilled water, followed byethanol, and then purged with clean, dry N2. For theseexperiments the total flow through the sample inlets was3.5 standard liter per minute (slpm) of N2 and the resultingReynolds numbers (Re) ranged from 1550 to 1940, whichare in the laminar flow regime. The calculated sampleD10S02residence time in these sample inlets varied according tointernal diameter and was no greater than 82 ms. 8 ppbv ofNH3 in clean, dry N2 supplied by the blow off from aliquid N2 dewar was sampled through each inlet tube atroom temperature ( 20 C) and the NH3 signal rise, andsubsequent decay after removal, were monitored similar tothe method described by Neuman et al. [1999]. Additionalexperiments with the FEP, PFA, stainless steel, and glassinlet tubes were performed at high RH (72%) and at highRH with the inlet tubes heated to 40 C. Similar to the resultsgiven by Yokelson et al. [2003b], NH3 exhibited an unacceptably large loss on the uncoated metal materials testedand therefore metal inlets were not subjected to further tests.FEP, PFA, and glass were all found to be acceptable, with2 e-folding signal decay times ranging from 6 to 12 s, andPFA was chosen for the inlet used in the flight instrument.Proper sample tube handling and care were shown to beequally as important as selecting the proper tube material.Experiments designed to simulate the conditions of anaircraft mission (i.e., running, sitting idle overnight, runningthe next day, etc.) showed that the rise/decay characteristicswere reproducible for a given inlet material only when a flowof clean, dry N2 was used to purge the inlet during periods ofinstrument inactivity. This suggests that for sampling NH3 aninlet time response determined in the laboratory with cleanair may not be applicable to data collected in the field. Ifachieving a specific time response is necessary for a particular analysis, then for NH3 sampling the time response forthat instrument should be determined using ambient, fielddata. Therefore the time response of the inlet and CIMSinstrument described in this paper was determined usingambient aircraft data obtained in flight throughout the entirefield program (section 3.2).[6] The sampling inlet is similar to that used for airborneHNO3 measurements [Neuman et al., 2002; Neuman et al.,2003b]. The inlet is housed inside streamlined tubing thatis mounted to a window plate of the aircraft and extends0.33 m beyond the aircraft fuselage in order to sampleoutside of the aircraft boundary layer. Sampling was performed perpendicular to the direction of flight, and in thisorientation is likely to discriminate against some of thelarge-diameter aerosol mass [Ryerson et al., 1999]. Allwetted sample line components were made from PFATeflon. To minimize the effect of temperature fluctuationson the adsorption/desorption of NH3 to the inlet walls, theinlet tubing was contained in an aluminum (Al) housing andthermostated at 30 C, which was determined to be thelowest controllable temperature for the typical aircraft cabinconditions encountered in flight during the NEAQS-ITCTmission. Previous field mission data showed negligibleammonium nitrate volatilization in a similar inlet usingsimilar flow rates and thermostated at 50 C [Neuman etal., 2003b]. The distance from the inlet tip to the flow tubereactor entrance was 0.55 m.[7] Ambient air was brought in through one of two ports(Figure 1). One port was used for sampling ambient NH3while the second port was used for determining the instrument background by delivering air through a scrubber thatremoved NH3 from ambient air. A heated PFA rotor valvelocated 0.11 m from the inlet tip was actuated pneumaticallyto switch the ambient airflow between the two ports. Duringambient NH3 measurements, ambient air was drawn through2 of 12
D10S02NOWAK ET AL.: AIRBORNE CIMS NH3 MEASUREMENTSD10S02Figure 1. NH3 CIMS instrument schematic.a short section of PFA tubing (0.11 m length, 4 mm ID) anddirectly through the rotor valve. When the rotor valve wasactuated, ambient air was diverted into an Al housingcontaining silicon phosphates (Perma Pure, Inc.) that formphosphoric acid when exposed to ambient levels of humidity, thereby removing NH3 from ambient air. The Alhousing (0.14 m length, 40 mm ID) was kept at 40 C toprevent water from condensing onto the scrubbing material.The NH3 scrubber could not fit into the streamlined tubinghousing the inlet, so it was mounted in the cabin on thewindow plate. When the instrument was in zero mode,ambient air was sampled by this second port through thescrubber, then through a 0.35 m length of 4 mm ID coppertubing, which extended the length of the winglet, and finallydelivered to the rotor valve at the head of the inlet. Metaltubing was used to minimize cabin air NH3 permeating intothe zero line between the scrubber exit and the rotor valve.The exit of the PFA rotor valve connected to a PFA tube(0.45 m length, 8 mm ID) housed in a thermostated (30 C)Al tube that delivered ambient air to the entrance of the flowtube reactor. A rotary vane pump connected to the exit ofthe flow tube drew approximately 2.8 slpm through the inletand flow tube. An additional flow of 5.2 slpm of air wasmaintained in the inlet with a diaphragm pump. Themagnitude of this additional flow was chosen to minimizeinlet residence time while maintaining laminar flow conditions. During NEAQS-ITCT at an altitude of 1000 m, thetotal inlet flow was 8 slpm and the inlet residence time wasapproximately 190 ms. To reduce NH3 contamination of theinstrument, an overflow purge of 100 sccm of N2 wasdelivered continuously through the inlet via a critical orificewhen the instrument was shut down between flights.2.2. Flow Tube and Quadrupole Mass Spectrometer[8] NH3 is detected using ion-molecule reactions thatoccur in a low-pressure flow tube reactor where ambientair is mixed with ions produced in a radioactive ion source.Approximately 2.8 slpm of ambient air enters the flow tubethrough an Al sampling cone with a 0.6 mm diameter holeat the apex. Reagent ions enter the flow tube perpendicularto the ambient airflow through a port located 30 mmdownstream from the Al sampling cone. The stainless steelflow tube (0.45 m long, 35 mm ID) was kept at approximately 10 V relative to the aircraft ground. The protonatedacetone dimer ((C3H6O)H (C3H6O)) reagent ions are produced by typically flowing 3.5 slpm of N2 with approximately 1 sccm from a cylinder containing 100 psi of N2doped with a mixture of 100 Torr of acetone (C3H6O) and3 Torr of sulfur hexafloride (SF6) over a 20 mCi 210Poradioactive source. These ions react selectively and sensitively with NH3 [Fehsenfeld et al., 2002]. SF6 was added toattach electrons in order to slow recombination and ambipolar diffusion losses of the positive ions and to increasetotal ion signal.[9] One complication observed in the previous groundbased CIMS NH3 measurements described by Fehsenfeld etal. [2002] using this ion chemistry is the tendency of(C3H6O)H (C3H6O) and (C3H6O)H (C3H6O).NH3 to further cluster with water in the low-pressure flow tube reactor.Additional water clustering distributes the reagent andproduct ions over multiple masses, thereby reducing thesignal at any single mass and requiring additional masses tobe monitored during a measurement cycle. This clusteringalso adds difficulty in interpreting the mass spectrum. Toavoid these difficulties a CDC was used to break up waterclusters downstream of the flow tube [Tanner et al., 1997].After exiting the low-pressure flow tube, the ions arethen accelerated through the CDC via an electric fieldof approximately 1.5 V mm 1. The CDC is maintained at 0.4 Torr with a molecular drag pump. Collisions inside theCDC dissociated weakly bound clusters such as(C 3H 6O)H (C 3H 6O).(H 2O)n and (C 3H 6O)H (C 3H 6 O).NH3.(H2O)n into the core cluster ions, simplifying the massspectrum.3 of 12
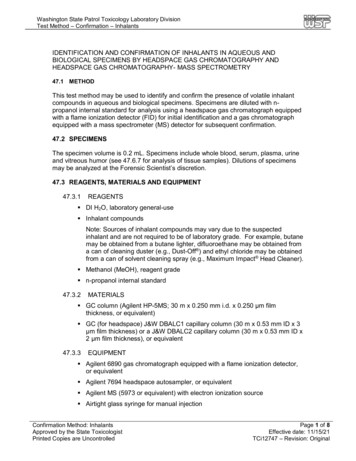
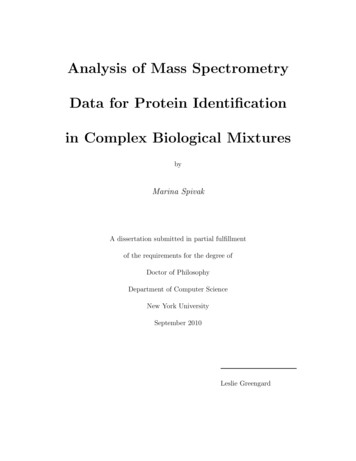
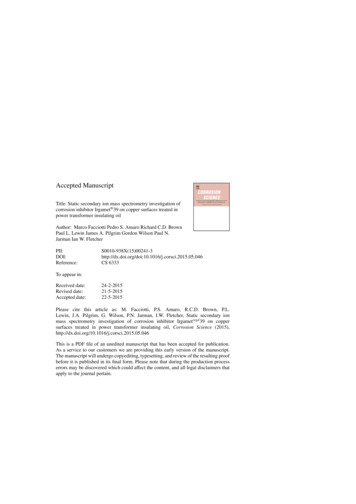
D10S02NOWAK ET AL.: AIRBORNE CIMS NH3 MEASUREMENTS[10] The flat plate ion lenses used in both the HNO3system and the previous NH3 ground system [Fehsenfeldet al., 2002; Neuman et al., 2002] were replaced withan octopole ion guide [Hagg and Szabo, 1986; Slusheret al., 2004]. After leaving the CDC the ions are guidedthrough the vacuum system by the octopole ion guideand into the quadrupole mass spectrometer, where theyare filtered and detected with an electron multiplier. Thecombination of the CDC and octopole ion guideincreased ion throughput, as measured by the acetonedimer signal, by an order of magnitude over the NH3ground system [Fehsenfeld et al., 2002], and resulted inreagent ion signals over 1 106 counts s 1 (1 MHz)during the airborne study.[11] The residence time in the flow tube depends onambient airflow into the flow tube through the Al samplingcone, total flow through the radioactive source region, andthe flow tube pressure. The ambient airflow through thesampling cone into the flow tube was not actively controlledand changed as a function of aircraft altitude. For the 0.6 mmdiameter hole used, the flow through the orifice varied from2.8 slpm at sea level down to 1.2 slpm at 6.4 km altitude. Theflow through the ion source was controlled at either 1.5 or3.5 slpm. The flow tube pressure ranged from 18 to 22 Torr.The calculated flow tube residence time was between 95 and160 ms depending on the flow and pressure conditions.2.3. Standard Addition Calibrations[12] Standard addition calibrations were performed inflight to track changes in the sensitivity of the CIMSinstrument. The instrument was calibrated autonomouslywith minimal disruption of gas flow through the calibrationsource or inlet. Standard addition calibrations were performed at least hourly with the output of an NH3 permeationdevice (Kin-tek, La Marque, Texas). The permeation deviceis housed in a temperature controlled PFA sleeve at 40 C.45 sccm of N2 continuously flows over the permeationdevice and through the PFA sleeve. A temperaturecontrolled crimp at the exit of the calibration systemmaintains the pressure in the sleeve at 2 atm to reducepressure changes in the calibration system in order to ensurestable output of NH3 during flight [Talbot et al., 1997].[13] The output from the permeation device connects to aPFA tee located at the inlet. A vacuum line connects througha solenoid valve to the third leg of the tee. Calibration gasand some ambient air are removed in a 100 sccm flowthrough the vacuum line. This prevents the continuouslyflowing calibration gas from being introduced into the inletwhen the solenoid is open during ambient measurements[Ryerson et al., 1999]. When the solenoid valve closes, thecalibration gas is added to the inlet. The resulting signalenhancement from a known amount of NH3 is used todetermine instrument sensitivity and time response.[14] The stability of the permeation device was maintained between flights by removing the permeation ovenfrom the aircraft and connecting it to a ground supportsystem where the same flow and temperature conditionswere maintained. Here the output of the NH3 permeationdevice was measured by UV absorption at 184.95 nmbetween each flight [Neuman et al., 2003a]. The averagepermeation rate showed no systematic change throughoutthe campaign and was 16 0.3 ng min 1 with an estimatedD10S02uncertainty of 15%. This agreed within the estimateduncertainties with both the manufacturer’s determinationby weight loss (15 ng/min) and previous ion chromatography analysis (14.8 ng/min) for this permeation device.Additional laboratory tests show that, similar to a HNO3permeation tube [Neuman et al., 2003a], the NH3 permeationdevice output reproducibly returns to equilibrium in less than2 hours after a short ( 10 min) disruption in flow ortemperature control. A 3 hour preflight period was providedduring NEAQS-ITCT to allow the permeation device toequilibrate after it was installed on the aircraft, so in-flightcalibrations were not affected by these perturbations.3. Instrument Performance[15] Instrument performance is assessed by examininginstrument sensitivity, background signal, time response,and other in-flight diagnostics. From these performancecriteria the accuracy, precision, and overall estimateduncertainty of the measurements are determined.3.1. Ion Chemistry and Detection Sensitivity[16] The protonated acetone dimer (C3H6O)H (C3H6O)reacts sensitively and selectively with NH3 to form a stablecluster ion, (C3H6O)H (C3H6O).NH3 [Fehsenfeld et al.,2002]. Similarly, protonated ethanol cluster ions also reactsensitively and selectively with NH3 [Nowak et al., 2002,2006]. However, in laboratory testing of the low-pressureflow tube setup used on the aircraft, it was found thatsampling the liquid ethanol headspace described in the workof Nowak et al. [2002, 2006] was more prone to NH3contamination than the acetone/SF6/N2 gas bottle mixture.Therefore the protonated acetone dimer ion chemistry wasused in the flight instrument. The major peaks seen in anambient mass spectrum (Figure 2) are (C3H6O)H (C3H6O),(C3H6O)H (C3H6O).NH3, and their isotopes. The use of aCDC eliminates the H2O clusters described in the work ofFehsenfeld et al. [2002], greatly improving the sensitivityand selectivity of the ion chemistry. NH3 mixing ratios aredetermined by normalizing the product ion cluster signal,(C 3 H 6 O)H (C 3 H 6 O).NH 3 , to the reagent ion signal(C3H6O)H (C3H6O). Normalization accounts for changesthat occur in the reagent signal over time since the production signal is linearly proportional to that of the reagent ion.While the reagent ion signal typically varied less than 30%over a single flight, the signal ranged from 1 to 3 106counts/s (1 – 3 MHz) over multiple flights, depending onflow conditions and voltage settings.[17] The sensitivity was determined from the response toin-flight standard addition calibrations. Standard additioncalibrations of 2.3 to 2.7 parts per billion by volume (ppbv)were performed 5 to 7 times each flight with the output ofthe NH3 permeation device in ambient air or ambient airscrubbed of NH3. No consistent difference in detectionsensitivity was found between these cases. Each calibrationwas 2 min in duration (Figure 3) to allow calibration lines toequilibrate and assure that steady state had been reached,though on the basis of Figure 3 and the time responseanalysis (see section 3.2) this could likely be shortened infuture studies. The average sensitivity ( 1s) for each flightwas determined by taking the normalized sensitivity andmultiplying by the acetone dimer reagent ion count rate to4 of 12
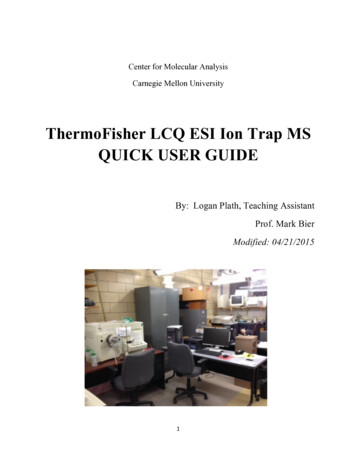
D10S02NOWAK ET AL.: AIRBORNE CIMS NH3 MEASUREMENTSD10S02Figure 2. An ambient mass spectrum taken during the 9 July flight at 500 m altitude. The signal scale islinear under 50,000 Hz. The ambient NH3 mixing ratio was 1.4 ppbv on a 1 ppbv background for this partof the flight.account for reagent ion variability from flight to flight. Foran ion source flow of 1.5 slpm, the average sensitivity was5 1.3 Hz/pptv for 1 MHz of reagent ion signal. At a higherion source flow of 3.5 slpm, the average sensitivity droppedto 2.6 0.5 Hz/pptv for 1 MHz of reagent ion signal. Twodifferent ion source flows were used in an attempt to betterunderstand the source(s) of the instrument background(section 3.3). Because the flow through the sampling coneFigure 3. NH3 mixing ratios during an ambient in-flight standard addition calibration at 1000 maltitude. The calibration mixing ratio was 2.6 ppbv and the background level was 0.8 ppbv during thetime period shown.5 of 12
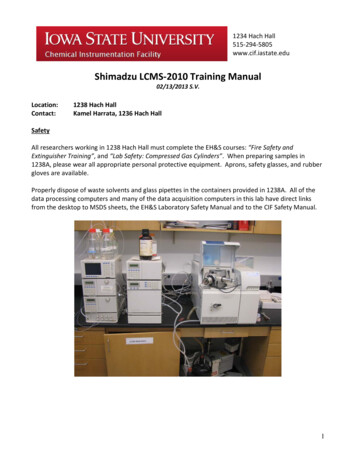
D10S02NOWAK ET AL.: AIRBORNE CIMS NH3 MEASUREMENTSD10S02Figure 4. The 1 s data and fits for the fastest (black) and slowest (blue) signal steady state decay alongwith a composite (red) of all 60 of the fitted curves plotted against the time since calibration termination.was not actively controlled, some of the sensitivity variability was likely due to changes in the total flow throughthe flow tube reactor at different altitudes. The sensitivityshowed no dependence on ambient water vapor mixingratios. Calibrations were performed at too few altitudes todetermine if the sensitivity was altitude-dependent.3.2. Time Response[18] The NH3 CIMS instrument collected data at a timeresolution of 1 s. The 1 s data were used to determine theinstrument time response and an appropriate averaging time.Each decay of the NH3 signal following the removal of thecalibration gas was fitted with a triple exponential decaycurve, where the preexponential terms are expressed as apercentage of steady state calibration level and t is the timein seconds since the calibration was terminated, similar tothe HNO3 time response analysis by Ryerson et al. [1999,2000]. Standard addition calibrations and the subsequentsignal decays occurring during ascents or descents wereexcluded from this analysis. The 1 s data and fits for thefastest and slowest decay are shown in Figure 4, along witha composite of all the fitted curves (60 total). No correlationwas found between any ambient condition, such as watervapor concentration or temperature, and decay time. FromFigure 4, the 1 e-folding signal decay time for all the decaycurves was 2 s or less. The 2 e-folding signal decay timeranged from 4 s to 10 s with that for the composite curveapproximately 5 s. Since on average the 2 e-folding signaldecay time was 5 s and for all cases at least 80% of thesignal decay occurred within 5 s, 5 s was used as theobserved instrument time response during NEAQS-ITCT2004 and the data were archived as 5 s averages.3.3. Instrument Precision and Uncertainty[19] The background was determined in-flight by periodically pulling ambient air through a scrubber filled withcommercially available silicon phosphates (Perma Pure,Inc.) and heated to 40 C to prevent water condensation[Nowak et al., 2006]. The silicon phosphates reacted withambient levels of humidity and formed phosphoric acid thatscrubbed NH3 from the ambient sample. The silicon phosphate scrubbing material was changed before every flight toprevent ammonium phosphates from building up and reducing the NH3 scrubbing efficiency. The background isbelieved to come from either the desorption of NH3 frominlet and/or ion-molecule reactor surfaces or from NH3contamination either in the N2 used as the ion source flowgas or acetone/N2 mixture used for generation of ions. Theabsolute background level varied from flight to flight andranged from 0.5 ppbv to 1.3 ppbv. During a given flight thedifference between consecutive backgrounds ranged from50 pptv to 100 pptv. It is likely that the change in theabsolute background level from flight to flight was due todiffering levels of NH3 contamination in the N2 cylindersused to deliver the ion source and purge gas flows, or fromexposure of supply lines to cabin air containing high levelsof NH3 during the exchange of empty N2 cylinders.[20] A 35 min ambient NH3 time series showing ameasurement/background sequence is shown in Figure 5.Both 1 s and 5 s average data are shown. The averagebackground for the time period shown here is 1.1 ppbv.6 of 12
D10S02NOWAK ET AL.: AIRBORNE CIMS NH3 MEASUREMENTSD10S02Figure 5. A 35 min NH3 measurement sequence from the flight on 3 August. The shaded areas indicatethe time periods the instrument was in background mode. The interpolated background is subtracted fromthe total signal to determine ambient levels. Shown are 1 s NH3, 5 s NH3 average, altitude, backgroundaverage, and the interpolated background data.Determination of the background allows the quantificationof the actual instrument variability over time. This includesthe uncertainty in each background and the differencebetween consecutive backgrounds. From the exampleshown here the 1 s standard deviation on the backgroundsis 90 pptv for 1 s data and 45 pptv for 5 s averages, whichare slightly larger than expected from counting statistics onthe signals. The average difference between consecutivebackgrounds was 100 pptv. So, for this example, anadditional 110 pptv ((45 pptv2 100 pptv2)1/2) was includedinto the uncertainty for the 5 s data. From the instrumentperformance criteria discussed here, the combined uncertainty for the instrument during NEAQS from calibrationaccuracy and background determination is estimated torange from (25% 80 pptv) to (30% 125 pptv)depending on the flight and operating conditions.dioxide (SO2) are used in this analysis. NO2 and NO weremeasured by 2 separate channels of a chemiluminescencedetector and were averaged to 1 s. NO2 was measured withan uncertainty of (8% 25 pptv) and NO was measuredwith an uncertainty of (5% 10 pptv) [Ryerson et al.,2000]. CO data were reported at 1 s intervals using avacuum UV fluorescence instrument with an uncertaintyof 5% and a 3 s detection limit of 1.7 ppbv [Holloway et al.,2000]. Sulfur dioxide (SO2) measurements were made usinga TECO 43C-TL pulsed fluorescence instrument that hasbeen modified for aircraft operation with an estimateduncertainty of 15% and a 3 s detection limit of 0.6 ppbv[Ryerson et al., 1998]. The area and point source emissionsdata were taken from the Environmental Protection Agency(EPA) 1999 National Emissions Inventory (NEI99) version3 as described in the work by Frost et al. [2006]. The NEI99area emissions are presented on a 4 km resolution grid.4. Field Observations and Discussion4.1. Urban Plume[22] The New York metropolitan area is a significant NH3area source (Figure 6). In densely populated area with highvehicular traffic with no nearby agricultural activity, sourcesof NH3 are believed to include vehicular emissions, wastedisposal and recycling facilities, and power generationfacilities using selective catalytic reduction (SCR) techniques to reduce NOx emissions [Fraser and Cass, 1998;Kean et al., 2000; Perrino et al., 2002; Li et al., 2006]. The[21] The 5 s data obtained during NEAQS-ITCT 2004enabled observation of NH3 in plumes from a variety ofsources. Two examples described here, an urban plumedownwind of New York, New York, and emissions froman agricultural source northeast of Atlanta, Georgia, areused to demonstrate the utility of this instrument. Inaddition to the NH3 data, observations of carbon monoxide(CO), nitric oxide (NO), nitrogen dioxide (NO2) and sulfur7 of 12
D10S02NOWAK ET AL.: AIRBORNE CIMS NH3 MEASUREMENTSFigure 6. (top) WP-3D 25
airborne HNO 3 instrument described by Neuman et al. [2002]. However, the ion chemistry and instrument back-ground determination are different than previously used in the ground-based NH 3 CIMS instruments. Other modifica-tions include the addition of a collisional dissociation chamber (CDC) and an octopole ion guide [Tanner et al.,