Transcription
1234 Hach Hall515-294-5805www.cif.iastate.eduShimadzu LCMS-2010 Training Manual02/13/2013 S.V.Location:Contact:1238 Hach HallKamel Harrata, 1236 Hach HallSafetyAll researchers working in 1238 Hach Hall must complete the EH&S courses: “Fire Safety andExtinguisher Training”, and “Lab Safety: Compressed Gas Cylinders”. When preparing samples in1238A, please wear all appropriate personal protective equipment. Aprons, safety glasses, and rubbergloves are available.Properly dispose of waste solvents and glass pipettes in the containers provided in 1238A. All of thedata processing computers and many of the data acquisition computers in this lab have direct linksfrom the desktop to MSDS sheets, the EH&S Laboratory Safety Manual and to the CIF Safety Manual.1
Shimadzu LCMS - Training Manual1/24/02Welcome! Proper operation of the Shimadzu LCMS system requires detailed knowledge in severalareas. The extent of the training and the time necessary to acquire the knowledge will depend upon thebackground and experience of the user, and the commitment made to the learning process. Dr. Shu Xuwill normally provide this training. Only users with approved projects will be trained on this instrument.We have prepared condensed training documents to supplement the various instrument operationmanuals. This material has been taken directly from the manuals, and we thank Shimadzu for theirpermission.In order to insure proper operation of the instrument for everyone, users will not be authorized to use theinstrument until all aspects of the required training have been accomplished and verified.Step One - HPLC and Mass Spectrometry Theory [8 hours - self learning]You will be given access to generic LCMS training software entitled "Introduction to LCMS". Thissoftware will require from 4 to 8 hours to complete, depending upon your background. We expect youto understand all the material contained in all of the chapters except chapter 7. When you are finished,you must remove the software from your computer and return the disks to us. The software must not beduplicated or shared with other parties.Verification: You must successfully complete all of the quizzes in the software and provide uswith a final "Progress Page" report verifying a 100% score.Step Two - Learning Good Laboratory Practice in our Lab [2 hours - staff training]We will discuss rules and regulations regarding your use of our lab facilities and those items specific tothe operation of the Shimadzu LCMS. This will include methods and protocols for creating and storingbuffer solutions, filtering and degassing solvents, filtering samples immediately prior to analysis, etcetera.Verification: under the supervision of staff, you must demonstrate all procedures.Step Three - Learning the Instrumentation Hardware [ 4 hours - staff training]Using sections of the Shimadzu LCMS2010 Users guide and summary materials prepared by us, youwill be given instruction in all aspects of the system hardware and capabilities pertinent to your projectneeds, including a discussion of practical ESI and APCI capabilities. The discussion will also includecritical aspects of the LC equipment and screen menus, installing your column, proper routing andconnection of the low pressure solvent lines and high pressure flow lines, proper injection technique,methods for purging lines, recognizing flow problems, et cetera.Verification: under the supervision of staff, you must install your column, establish proper leakfree flows, start the nebulizer, and demonstrate proper sample introduction.2
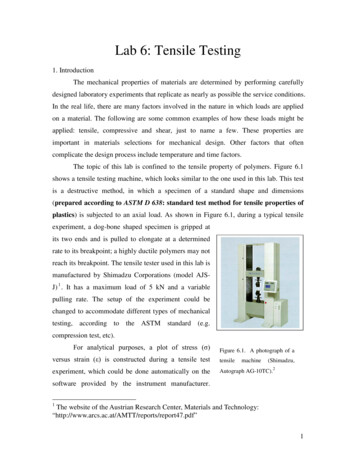
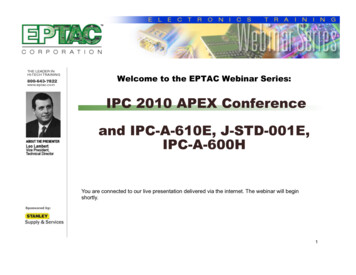
Step Four - Learning the Instrumentation Software [2 hours - staff; 8 hours - self]Using sections of the Shimadzu LCMS2010 Users guide and summary materials prepared by us, thefollowing tasks will be learned and/or accomplished:1) Setting up your user account and file structure2) How to set up an experimental method / setting up your experimental method3) Verification of instrument performance, including background and standards4) Acquiring and viewing data5) Processing data6) Record keeping and archiving data files.Verification: under the supervision of staff, you must set up an experimental method frombeginning to end, acquire data, and process data.Step Five - Application Assistance [2 hours - staff]All of the training requirements listed above should be accomplished using standard test samples ofknown purity, concentration, and chromatographic performance, which you must provide. Thesesamples should be similar in nature to the compounds you will be analyzing. Only when experimentsusing your standards have been completely successful will we allow you to use the instrument to analyzeyour research samples. At this point, Dr. Harrata will be available for consultation and assistance.Corbin Zea Uses the Shimadzu LCMS-20103
Step One - HPLC and Mass Spectrometry Theory1.0 Savant Computer-Based TrainingThe first step in your training involves a review of key chromatographic and mass spectrometryconcepts that you must understand in order to use the LCMS effectively, independently, and with thegreatest chance of success. The Savant computer-based training module will give you the fundamentalbackground you will need. Depending on your background, it may take as little as five minutes to gothrough each chapter, or it might take considerably longer. After each two chapters there is a short quiz.At the end of the program there is a review and a final test. When you are certain you understand all ofthe material in the module (ignore chapter 7 if you wish), go through the program one more time in"progress tracking" mode. At the end of the program, print the Summary View of the Progress Page.This will verify your score on the tests.When you are finished, return the program disks and the Progress Report sheet to Dr.Xu. Delete anycopies of the program you may have loaded in your lab. The software may not be duplicated ordistributed to anyone outside the LCMS user group.4
Step Two - Lab Proceduresrevised: 1/28/02Note: This section is subject to change!! Please keep this section current in your binder!!2.1 Scheduling and Access to the LabYou may apply on-line at www.cif.iastate.edu for a Marlok key to allow you access to the lab at anytime. If you already have a Marlok key, we can add access permission to your existing key. Students ofProfessor Pohl's research group have scheduling priority for the LCMS. These students are allowed touse the on-line reservation program at www.cif.iastate.edu/MassSpec. You may use the program to seewhich times are open in the near future, but requests for time must be given to Dr. Xu, who will then usethe reservation program to assign you time.2.2 Solvents2.2.1 Solvent BottlesYou must use your own solvents in your own bottles, or bottles that have been assigned to you.You may never use solvents prepared for someone else, or solvent containers that are not yours.We have a supply of 500 mL and 1000 mL bottles especially designed for use with the LCMS.These can be loaned to you for the duration of your project. The content and the owners namemust be CLEARLY visible on all containers in our lab. Unlabelled containers will be discardedwithout hesitation.2.2.2 Solvent FilteringPure organic solvents do not need to be filtered prior to use. If any modifiers have been added tothe organic phase, then the mixture should be filtered. The aqueous phase, regardless of thepresence or absence of modifiers, should be filtered immediately prior to use. Bacterial growth,especially in aqueous solutions, can lead to clogs in the HPLC mixer, the high-pressure stainlesssteel tubing, or the capillary transfer tubing, as well as high background and extraneous masspeaks in the mass spectrum. As part of your training, Dr. Xu will show you how to use thefiltering apparatus located in our wet lab.5
2.2.3 Solvent SpargingSolvents, both organic and aqueous, should be sparged prior to use to remove dissolved gases(nitrogen and oxygen) that have the potential to come out of solution during the LC run andcause clogs and/or instability in the flow. The procedure is quick and simple, and involvespassing helium gas through the solvents through a diffuser for a period of several minutes. EachLCMS user will be given a personal sparge line and diffuser for the duration of their project.Never use someone else's sparge line. Dr. Xu will demonstrate the procedure for you.2.3 Samples2.3.1 PreparationSamples should be prepared in your own lab. In emergency situations you may use theequipment in our wet lab, including the balance, centrifuge, acid-washed glassware, and samplefiltration cartridges. We have a limited supply of nanopure water available, which we obtainfrom another lab. This can be used for final rinse or sample dilutions. We hope to have our ownsupply in the near future. If you use any of our glassware, do not return it to the glassware rackor shelf. Put it in the sink and we will eventually clean and acid wash it. At no time shouldphosphate detergents be brought into or used in our lab.2.3.2 Sample FiltrationAll samples should be filtered through a 0.45 micron filter just prior to analysis. No exceptions.Ignoring this rule will be cause for suspension of privileges. We have a limited supply of thesefilters for use in cases of emergency. You should order and use your own.2.3.2 LC Columns and SyringesYou must provide your own LC column, as appropriate for your project. You must provide yourown syringes (blunt-tip; especially designed for LC use).2.4 Instrument Configuration and TestingAs part of your project, you must define specific test samples and protocols you will use to verifyinstrument performance at the beginning of each session, and at the end of each session. If you ignorethis requirement you will no longer be allowed to use the instrument. Dr. Xu or Dr. Harrata will assistyou in verifying that the test protocol for your project is sufficient.6
2.4.1 Loop Injection, Standard SampleThe mass spectrometer side of the instrument will always be tuned for optimum operation.Before starting the LCMS run, always acquire data with a 5ul loop injection of your standard testcompound. Keep a record of the day-to-day loop injection performance on your test sample. Ifyou see significant changes in instrument performance, consult with facility staff beforecontinuing.2.4.2 Loop Injection, Research SampleWhenever possible, try a loop injection of your research sample in order to test the performanceof the instrument viv-a-vis your sample. Only when you are satisfied that sample ionization isoccurring and sample concentration is adequate, should you proceed with LC introduction ofyour sample.2.4.3 Ending Your SessionAt the end of use, the LC system and the tubing lines to the ESI source should always be flushedwith DI water (A) and isopropanol (B) 10/90.1) Turn off pumps and nebulizer gas2) Place DI (A) and isopropanol (B) into lines A and B respectively3) Purge pumps A and B (will be included in the training)4) Turn on the pumps from the LC/MS solution program and run (10 min) a flow of 200 uL perminute with 10/90 A/B.5) Stop pumps and nitrogen6) Log off.7) Turn off power of all LC components including LC pumps, degazer, UV detector, autoinjector. Exit from the LCMSsolutions and LCMS Post Run software programs.!!! NEVER turn off the mass spectrometer !!!7
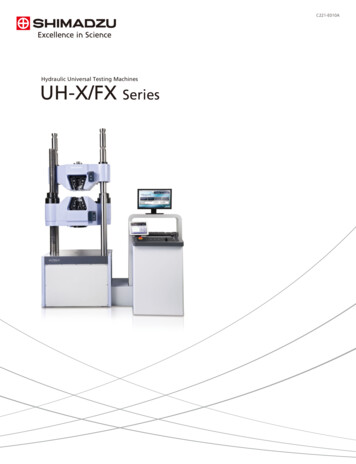
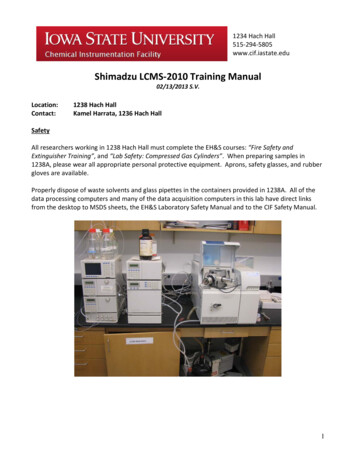
Step Three - LCMS-2010 Instrument Overview3.0 OverviewThe LCMS-2010 has been designed for liquid chromatographic detection using Atmospheric PressureIonization(API). The single stage quadrupole mass analyzer, coupled with electrospray (ESI) andatmospheric pressure chemical ionization method(APCI) provides the most sensitive and selectivedetection of organic molecules. To generate sample ions, sample molecules are ionized at atmosphericpressure from a highly charged aerosol. Once in the gas phase, ions are electrostatically extracted fromthe charged spray using an orthogonal source geometry. Ion transmission to the quadrupole massanalyzer is enhanced using a Q-array and octapole configuration. Sample ions are then separatedaccording to the mass-to-charge ratio (m/z)and detected with the secondary electron multiplier detector.The detected signal is amplified and then processed by the data processing software, LCMSsolution.8
9
3.1 Atmospheric Pressure IonizationIn atmospheric pressure ionization (API) mass spectrometry, sample ionization take place outside thevacuum system of the MS at atmospheric pressure. Sample molecules enter the ion source directly fromthe LC and become ionized to produce an ion beam of pseudomolecular ions using either atmosphericpressure chemical ionization or electrospray. The two techniques differ in the mechanism for iongeneration, consequently affecting the response to different sample molecules.3.2 Electrospray - OverviewIon generation in electrospray involves placing a high electric charge, typically 3 – 5kV, to the dropletsemerging from the ESI capillary tubing. The droplets are dispersed into an electrically charged aerosolusing a high-velocity nitrogen gas flow that acts as a concentric pneumatic nebulizer. Once the chargedaerosol is formed, solvent evaporation takes place, decreasing the size of the droplets and increasing thedensity of charge at the surface. The surface charge increases to a point where the coulombic repulsionforces are sufficient to overcome the forces of surface tension. At this point, the droplets explode intosmaller droplets as the Rayleigh stability limit is exceeded. Further solvent evaporation takes place,reducing the size of the droplets and increasing the surface charge density. Once again, the Rayleighlimit is reached and the droplets explode into even smaller droplets. At some stage, the electric field atthe surface of the very small droplets is so high that the solute ions enter the vapor phase directly.One model for ion evaporation proposes that ions are ejected from the droplet surface into the gas phase.This process takes place as the electrostatic repulsion between ions forces ions from the liquid phase. Analternative model proposes that ions enter the vapor phase when most of the solvent molecules arestripped from the sample molecules by solvent evaporation. This process continues until most of thesolvent is evaporated from a droplet and a single ion remains.10
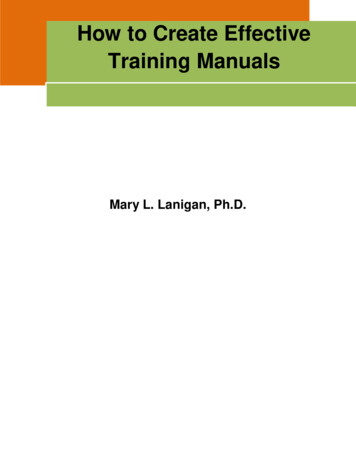
3.2.1 ESI - Products of IonizationWith ESI, monovalent ions are typically produced by the addition or loss of a proton (H)([M H] in the positive ion mode: m/z M 1, [M-H] - in the negative ion mode: m/z M-1). Theaddition of ammonium, NH 4 [M 18] , sodium, Na [M 23] , potassium, K [M 39] mayalso be observed. If the voltage at Q-arrays 1, 2, and 3 is increased, fragmentation is observed.The structural analysis of the sample can be made from these fragment ions.3.2.2 ESI - FlowsFor the ESI, the flow rate ranges from 1 µL/min to 1 mL/min. Normally, the optimal flow rate isapproximately 0.2 mL/min. To optimize the signal response to different LC flow rates, changingthe nebulizer gas flow rate is recommended. The standard values are given below:LC pump flow rate10 uL / min 0.2 mL / minNebulizer gas flow rate 1 - 2 L / min 3 - 5 L / min3.2.3 ESI FragmentationWhen the energy acquired by the molecule exceeds the ionization potential, the excess energy isdistributed inside the molecule; when the energy exceeds the dissociation energy for a particularchemical bond, fragmentation occurs. By increasing the voltage at Q-arrays 1, 2 and 3, theweaker bonds in the molecule fragment. For reserpine, fragment ions appear at m/z 397 and 195.Normally, fragmentation occurs at weaker bonds, such as C-N and C-O.Fragment ions are generated between the heated capillary (CDL) and the Q-array. In this area,the pressure is 10 2 Pa and has a large amount of neutral molecules present, such as solventmolecules and nitrogen gas. By applying an accelerating potential on the Q-array, ions andneutral molecules collide with each other, resulting in fragment ions.3.2.4 Multiply-charged ionsThe electrospray process generates multiply-charged ions for certain molecules, effectivelyincreasing the mass range of the instrument. This property enables proteins and peptides to bedetermined; the example below shows myoglobin (molecular weight 16951).11
3.2.5 Deconvolution ConceptsThe charge envelope can be simply deconvoluted to provide the molecular weight of the protein.In this example, multiple charges were observed with the highest intensity at m/z 1131,corresponding to 15 charges (i.e., 1131 m/z 16951/15).Assume that a proton is added (or Na, K, NH 4 , or similar adducts are added). Also assume thatthe m/z value is m i when molecular weight is M and the number of valences is i.When the mass of proton is assumed as Mm i [M iM H ]/im i 1 [M (i 1)M H ] / (i 1)H, valent number, i and (i 1) lead to:When M H 1, the above two equations lead to:i (m i 1 –1)/(m i – m i 1 )Now the number of valences for a peak as observed using two neighboring peaks is obtained,allowing you to calculate the molecular weight.3.2.6 Adjusting the ESI ProbeWith ESI, the condition of the silica capillary tubing tip has a significant impact on the intensityand stability of ionization. In order to ensure that the spray is stable, check the following points:12
3.2.7 Precautions for Operating in ESI ModeInfluence of Mobile Phase Acidic Modifiers - In positive ionization mode, the sensitivity canbe improved by adding a volatile buffer such as acetic or formic acid of approximately 1% to themobile phase. If acid is added in the negative ionization mode, the interface current increases andunstable electric discharge occurs. This can make the ionization unstable. Avoid adding acidwherever practical in negative ionization use. To suppress electric discharge in the negativeionization mode, decrease the high voltage applied to the probe (down to -3 or -2.5 kV while thehigh voltage is typically -3.5 kV), or change the nebulizer gas from nitrogen to compressed air.(Do not use compressed air with flammable solvent mixtures).Influence of High Water Content Mobile Phases - If the ratio of water in the mobile phase ishigh or if a sample is analyzed with a high flow rate, ion evaporation may be limited and largeliquid droplets may form. In this case, set the temperature of the block heater between 250 and300 o C (normally, it is set to 200 o C) If the temperature of the CDL or heater block is lowered,cluster ions resulting from the mobile phase may form.Note: Cluster ions may cause isobaric interference with target ions. If this occurs, change the mobilephase solvent or increase the heater temperature.Organic Solvent Precautions - Parts of the ESI probe contain polymers such as PEEK andpolyimide. Ensure that the solvent choice is compatible with these polymers. PEEK andpolyimide may swell or dissolve in organic solvents such as dichloromethane or DMF.3.3 APCI (Atmospheric Pressure Chemical Ionization)Ion generation in APCI involves a multiple step reaction sequence: in positive ion mode, the first stepinvolves the creation of proton hydrates, H 3 O [H 2 O ]n, by a cascade process involving the majorprimary ions, such as N 2 , O 2 , H 2 O and NO . The primary ions are formed by nebulizer gas andsolvent molecules passing through the corona discharge region. This cascade reaction process is rapid,approaching 1 µs to form a terminal equilibrium set of proton hydrates. The proton hydrates are highlycharged ions which react with the sample molecules by charge transfer and proton transfer to createsample ions. In negative ionization mode, the mechanism of ion generation involves a different process.The corona discharge produces electrons which are then captured by electronegative species such as O 2to form O 2 - and O - . The major source of negative ions in APCI is the superoxide anion (O 2 - ) and thecorresponding hydrates and clusters (O 2 - [H 2 O]n and O 2 - [O 2 ]n, respectively). Once the primary ionshave been generated, either as proton hydrates or the superoxide anions, the sample molecule can beionized either by charge transfer or proton transfer.13
Like ESI, APCI typically produces singly-charged ions with the addition or loss of a proton (in thepositive ion mode, [M H] : m/z M 1; in the negative ion mode, [M-H] - : m/z M-1). In addition, theadducts of ammonium, NH 4 [M 18] , sodium, Na [M 23] , potassium, K [M 39] may beobserved, but are usually less prevalent than with ESI.Unlike ESI, APCI only produces singly-charged ions.As with ESI, fragmentation occurs when the voltage at Q-arrays 1, 2, and 3 is increased.Normally with APCI, the HPLC flow rate is 0.05 to 2 mL/min. The optimal flow rate is approximately0.5 to 1.0 mL/min. The typical nebulizer gas flow rate is between 2 and 2.5 L/min.3.3.1 Adjusting the APCI ProbeIn the APCI mode, the position of the corona needle is important. Check the following items:3.3.2 APCI PrecautionsInfluence of Acidic Modifiers To The Mobile Phase - Acidic mobile phases can result insuppressed ionization in negative ion mode. This can also result in an increased interface currentand possible electrical discharge. Avoiding the addition of acid is recommended if possible. Tosuppress electric discharge in negative ionization mode, decrease the high voltage applied to theprobe (down to -2.5 or 2.0 kV from the typical voltage of -3.0 kV), or switch the nebulizer gasfrom nitrogen to compressed air.APCI Parameters - If a sample at a low flow rate is analyzed, the temperature of the APCIheater must be decreased. The standard values are given below:0.05 – 0.1mL/min 300o C0.1 – 0.2 mL/min 350o C0.2 – 2 mL/min400o C – 450o CWhen the temperature of the CDL, block, or APCI heater is decreased, cluster ions resultingfrom the mobile phase may be observed. Note that cluster ions can increase background noise. Ifthis occurs, change the mobile phase or decrease the heater temperature.14
Step Four - LCMS-2010 Data Acquisition and Processing SoftwareThis summary describes the basic LCMS-2010 operations. It covers the analysis steps, from sample injection to dataacquisition, as well as data analysis and report preparation. This information is contained in the System Users Guide Manual.For detailed software explanations, also refer to the LCMS Solution Software Reference Guide. A summary of theoperations is shown below.Create an analysis method fileSpecify the LC and MS analytical parameters.Save the parameters in a method file.Create a schedule fileIndicate the sample(s) to run, the method(s) to use for the analyses, andthe data file names for saving the results. The schedule can consist of abatch of multiple samples or a single sample.Acquire dataInject the sample and start data acquisition.The sample data is saved in a data file.Analyze DataOpen the data tile to process and analyze me data. Analyze the datausing postrun or profile postrun mode (for profile data).Print ResultsPrint the results with the report function.4.0 Preparation for Analysis4.1Creating a Method FileSpecify the LC and MS analytical conditions.The LC parameter settings depend on the component configuration.15
Select Tools Method Editor from the LCMS Solution main window to open the Method Development window.Select Tools LCMS Configuration, then click on the Load Real Configuration button.The currently connected LC and MS system configuration is displayed. Double click on each unit icon to verify thatthe unit connection is detected. Then click Close to exit the window.16
4.1.1Setting the LC Parameters1.Pump parametersSelect the solvent flow mode.Enter the total flow rate (T.Flow), initial concentration of solvent B (B.Conc), and maximum pressure.2.UV detector A parametersFor dual wavelength measurement, specify the wavelengths for the analysis (Wavelengths 1 and 2).17
To switch between single and dual wavelength measurement, select Tools LCMS Configuration from theMethod window, and then double-click on LC System Detector.For single wavelength measurement: Deselect Dual Mode on the Detector tab. In the Data Acquisition Channeltab, select Ch1 and choose Detector A from the drop-down menu.For dual wavelength measurement: Select Dual Mode on the Detector tab. In the Data Acquisition Channel tab,select Ch1 and choose Detector A (Dual 1, and then select Ch2 and choose Detector A (Dual 2).After completing the settings, click OK to exit the System Configuration window.3.Data acquisition timeEnter the LC Stop Time and select the Select All Channels check box.18
4.LC program1. Create the solvent gradient program.2.Enter the desired Time, Unit, Command and, for some parameters, Value. Click Gradient Curve to draw theset gradient curve on the screen.When the program is set, click on the OK button.The LC analytical conditions are complete. Next, specify the MS parameters.19
4.1.2Setting the MS Parameters1.Interface parametersSelect the Use the Data in the Tuning File check box. This will nearly always be the conditions for analysis. It maybe useful to change the temperatures when analyzing thermally liable compounds or to minimize adduct formation.The ionization mode is set according to the currently installed ionization probe. To change the interface, selectTools LCMS Configuration MS.The most recent tuning file is displayed in Tuning File(Reference), which contains the lens voltage values and othertuning parameters2.MS Parameters20
Type:Select whether data is to be obtained in either Scan/SIM or profile mode.For more information on the data obtained in scan, SIM, or profile mode see “Description of MS Analysis Mode” onpage 9-11 of the System Users Guide.Acquisition Mode: Select Scan or SIM (this parameter is not required for profile measurement).Ionization Polarity: Select positive or negative ionization.Detector Gain: Normally, enter the auto-tuning value (approximately 1.3 - 1.6 kV).If there are any peaks with a signal intensity exceeding 8,000,000 (which can occur when a high-concentrationsample is analyzed), data cannot be obtained. To avoid damaging the detector, the voltage will be turned off. If thisoccurs, decrease the detector voltage according to the intensity. If the detector voltage is decreased by 0.1 kV, thepeak intensity increases by a factor of 1.5 to 2.0. Reduce the detector voltage until the largest peak does not exceed8,000,000 counts.Probe High Voltage: Select Fix (This selects the voltage obtained from the tune file).CDL Voltage: Select Fix (This selects the voltage obtained from the tune file).Q-array Voltage: Select ScanScan Analysis ParametersInterval: Set this parameter between 2.0 -3.0 seconds. The combination of interval and scan range determines thescan speed.[(measurement end m/z) - (measurement start m/z)/sampling rate (sec)] is 6000 (amu/sec) maximum. As this value(scan speed amu/sec) decreases, more data points are obtained. Specify a speed so that more than 4 points aresampled across each of the chromatogram peaks.Typically, scan speeds of 1000 amu/sec or lower are used. This minimizes data file size and eliminatesoversampling. As an example, (500-50) amu /2 sec 225 amu/sec.21
Scan Range: Set the Start m/z and End m/z. Enter a value between 10 and 2000, depending on the system massrange.Threshold : Enter the borderline value between signal and noise. An appropriate threshold value can improve dataquality. A value of 0 indicates that all the signals are detected.If there is considerable background noise, enter a value higher than the background level of data or a value lowerthan the signal intensity of the sample. This can improve the data quality.Start Time: 0 min.End Time: Enter the measurement end time (generally the same as the LC end time).4.2 Starting an Analysis1.2.3.4.Turn on the CDL and block heater.Turn on the nebulizer gas.Turn ON the pump and column oven.In APCI mode, turn ON the APCI heater.22
Wait until the LCMS-2010 has stabilized. (For reproducible results studies, allow the LCMS-2010 to stabilize forapproximately 20 minutes once the heater temperatures have been reached.)The status of each LCMS-2010 parameter can be verified through the LC or MS monitor. Click on the relevantbutton.Once the LCMS-20 10 becomes stable, start the analysis.Click on the Start button to begin the analysis.Autosampler analyses start automatically when all the heated zones are ready.If the manual injector is used, inject the sample once the Inject button is available. The analysis is started when themanual injector switches from the Load position to the Inject position. Alternatively, start the analysis by clicking onthe Inject button.To stop the analysis, click on the Stop button.23
To specify the data displayed during the analysis, click on the Data Display window with the right mouse button andselect the Display Parameters.MS Display ParametersEnter the m/z to display in real time as a MC (mass chromatogram) value.To display each m/z chromatogram using the base shift function, select the Base Shift check box.Select the Sum TIC check box to display the total signals of all the mass chromatograms measured in multisequence mode (a chromatogram with the intensities of negative and positive ions added).24
4.3 Postrun Analysis (data processing)Open the Postrun program by double-clicking on the postrun icon from the Desktop.Enter your user name and passsword. The postrun program opens.Select File Open Data File, and specify the data file to open.The examples in this section are Scan data. However, the same operations are performed for SIM data.4.3.1 Displaying a Mass SpectrumDouble-click on a chromatogram to display the mass spectrum at that retention time. (The mass spectrum can alsobe obtained by double-clicking on the UV chromatogram.)In multi-sequence mode, multiple spectra are displayed.In normal analysis mode, a single spectrum is displayed. (Spectra for positive and negative ionization are display
Step One - HPLC and Mass Spectrometry Theory . 1.0 Savant Computer-Based Training . The first step in your training involves a review of key chromatographic and mass spectrometry concepts that you must understand in order to use the LCMS effectively