Transcription
Open AccessResearchet al.Yu2006Volume7, Issue 7, Article R55Haiyuan Yu , Yu Xia , Valery Trifonov and Mark GersteincommentDesign principles of molecular networks revealed by globalcomparisons and composite motifsAddress: Department of Molecular Biophysics and Biochemistry, Whitney Avenue, Yale University, New Haven, CT 06520, USA. These authors contributed equally to this work.reviewsCorrespondence: Mark Gerstein. Email: mark.gerstein@yale.eduPublished: 19 July 2006Received: 16 March 2006Revised: 19 May 2006Accepted: 20 June 2006Genome Biology 2006, 7:R55 (doi:10.1186/gb-2006-7-7-r55)The electronic version of this article is the complete one and can befound online at http://genomebiology.com/2006/7/7/R55Background: Molecular networks are of current interest, particularly with the publication ofmany large-scale datasets. Previous analyses have focused on topologic structures of individualnetworks.informationGenome Biology 2006, 7:R55interactionsConclusion: We demonstrate how basic molecular networks are distinct yet connected and wellcoordinated. Many of our conclusions can be mapped onto structured social networks, providingintuitive comparisons. In particular, the long-distance regulation in metabolic networks agrees withits counterpart in social networks (namely, assembly lines). Conversely, the segregation ofregulator hubs from other hubs diverges from social intuitions (as managers often are centers ofinteractions).refereed researchResults: Here, we present a global comparison of four basic molecular networks: regulatory, coexpression, interaction, and metabolic. In terms of overall topologic correlation - whether nearbyproteins in one network are close in another - we find that the four are quite similar. However,focusing on the occurrence of local features, we introduce the concept of composite hubs, namelyhubs shared by more than one network. We find that the three 'action' networks (metabolic, coexpression, and interaction) share the same scaffolding of hubs, whereas the regulatory networkuses distinctly different regulator hubs. Finally, we examine the inter-relationship between theregulatory network and the three action networks, focusing on three composite motifs - triangles,trusses, and bridges - involving different degrees of regulation of gene pairs. Our analysis showsthat interaction and co-expression networks have short-range relationships, with directlyinteracting and co-expressed proteins sharing regulators. However, the metabolic networkcontains many long-distance relationships: far-away enzymes in a pathway often have time-delayedexpression relationships, which are well coordinated by bridges connecting their regulators.deposited researchAbstractreports 2006 Yu et al.; licensee BioMed Central Ltd.This is an open access article distributed under the terms of the Creative Commons Attribution License (http://creativecommons.org/licenses/by/2.0), whichpermits unrestricted use, distribution, and reproduction in any medium, provided the original work is properly cited.Molecular p Aeraldesignglobalnetworkprinciples. /p comparisonprinciplesof the four basic molecular networks in yeast - regulatory, co-expression, interaction and metabolic - reveals gen-
R55.2 Genome Biology 2006,Volume 7, Issue 7, Article R55Yu et al.BackgroundTraditionally, each protein has been studied individually as afundamental functioning element within the cell. In the postgenomic era, however, proteins are often viewed and studiedas interoperating components within larger cooperative networks [1]. Biological networks are topics of great currentinterest. With the publication of a number of large genomewide expression, interaction, regulatory and metabolic datasets, especially in yeast [2-9], we can now construct four networks representing these four processes (see Materials andmethods; Figure 1a).Importance of the four networksWe chose these four networks because they are the most commonly studied networks in yeast and because they can be easily related to the central dogma of molecular biology, whichdescribes the basic (genetic) information flow in a cell. Thereare also other types of biological networks, such as syntheticlethal networks and chromosomal order networks [10,11];however, these networks do not overlap with the centraldogma and are, therefore, not the focus of this paper. Furthermore, most of these networks are not suitable for large-scaletopological analysis because we do not have enough information on them.Another important reason for us to choose these four networks is that there are many appealing analogies betweenthese biological networks and corresponding social networks[12-14]. Because people have clear intuition for social networks, based on daily experiences, these analogies can makemolecular networks easier to comprehend. For example,social hierarchy networks resemble the regulatory networksin that they define who has to obey orders from whom. Socialacquaintance networks describe who is known to whom in thesociety and are, therefore, similar to interaction networks inbiology [13,14]. Finally, enzymes at different steps of the metabolic network can be considered as workers at different stepsof the assembly line in a factory.Composite features in combined networksIndividual networks have been globally characterized by avariety of graph-theoretic statistics (Additional data file 1),such as degree distribution, clustering coefficient (C), characteristic path length (L) and diameter (D) [12,15,16]. Barabásiand Albert [12] proposed a 'scale-free' model in which most ofthe nodes have very few links, with only a few of them (hubs)being highly connected. In addition to topological statisticsand hubs, network motifs provide another important summary of networks. These are over-represented sub-graph patterns in networks, and they are considered as basic buildingblocks of large-scale network structures [17]. Recently, YegerLotem et al. [18] combined the interaction and regulatorynetworks in yeast and searched for patterns in the R55Here, we build on previous network studies and extend themin novel directions by combining all four networks in ouranalysis. Our goal is to examine the topological features of ourcombined network. We call these 'composite features' to distinguish them from those in single networks (see Materialsand methods). By analyzing these in all four networks, wewere able to find some basic principles characterizing biological networks. For example, previous studies have shownmost biological networks are scale-free, having only a fewhubs as the most important and vulnerable points [12,15]. Itis quite reasonable to assume that our four networks willshare the same set of hubs as explained in detail below. However, we analyzed the composite hubs among the four networks and showed that the regulatory network tends to use adistinctly different set of hubs compared to the other threenetworks. Furthermore, one fundamental question in biologyis how the cell uses transcription factors (TFs) to regulate andcoordinate the expression of thousands of genes in responseto internal and external stimuli [8,19-21]. Through examiningcomposite motifs, we could potentially shed some light onthis question. In particular, we show that the expression ofenzymes at different steps of the same pathway tends to havetime-delayed relationships mediated by inter-regulating TFs.Results and discussionOverall comparisons of all four networksWe calculated many topological statistics in all four networks,which are summarized in Figure 1a. All four networks display'scale-free' and 'small-world' properties. However, the regulatory network is different from other networks in that its clustering coefficient is exceptionally small. This is because mostof the target genes are not TFs. Therefore, the target genes ofthe same regulator tend not to inter-regulate one another.Moreover, since the regulatory network is directed, it isdivided into regulator and target sub-networks when calculating the degree distribution. It has been shown that the regulator network is a scale-free network. But, the target networkmight have an exponential degree distribution, instead [22].This means that there are no hubs in the target network.Therefore, when we examined the hubs and composite hubsin the regulatory network, we focused only on the regulatorpopulation. This also makes sense biologically, because weare more interested in how a gene's expression is regulated indifferent networks; the regulators (that is, TFs) are the onesthat carry out the regulatory functions.Furthermore, we analyzed the relationships between different networks. Since the relative position of nodes in a networkis one of the most important features of the network, weexamined the relationships between networks using their distance matrices, that is, distances between all protein pairs.We divided all pairs of proteins in a network into threegroups: connected pairs; close pairs (distance 2); and distant pairs (distance t3). We used Cramer's V, a measurementderived from F2 statistics, to examine the association betweenGenome Biology 2006, 7:R55
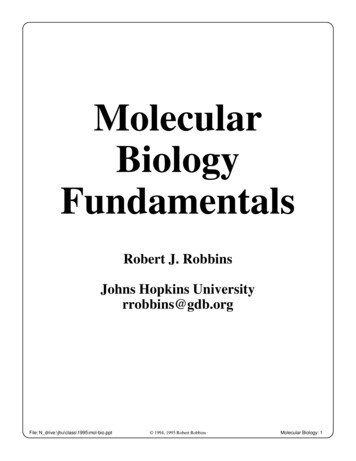
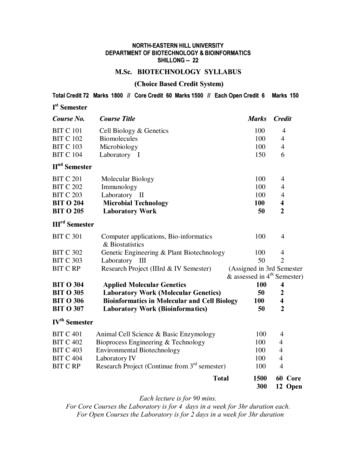
Genome Biology 2006,http://genomebiology.com/2006/7/7/R55Volume 7, Issue 7, Article R55Yu et al. R55.3Network name70,20123,2945,9337,231Power-law distribution-γN eragedegree(K )26.979.82213.9329.142.209Clusteringcoefficient(C )0.35850.23210.4340.1087Characteristic Diameterpath length ( L )(D actionMetabolismRegulatorRegulationTargetNumberof linksNumber ofproteins(N ecomment(a)(b)-118P 100.293P 100.08010 9P .04018-1Regulationrefereed research 08-110P .0590-118-118ExpressionFigurecomparisonGlobal1of all four networksGlobal comparison of all four networks. (a) Topological statistics of all four networks. Because the degrees in the metabolic network are not divided intooutward and inward degrees, we treated the metabolic network as an undirected network when calculating the average degree. (b) Association diagrambetween all four networks. The association between networks is measured by Cramer's V. The thickness of the line between two networks isproportional to the corresponding V. P values are calculated using standard F2 tests.Genome Biology 2006, 7:R55informationmetrics of relatedness - for example, Pearson correlationcoefficient, mutual information, contingency coefficient, andassociation score. They all show similar results (see Supplementary Table 1 in Additional data file 1).interactionsP 100.051networks, that is, whether pairs of proteins in one group of anetwork tend to be in the same group of another network. Ourcalculations confirm that all networks are indeed significantlyrelated to each other (Figure 1b). We also tried many otherdeposited research-117P 100.064reportsInteractionMetabolism
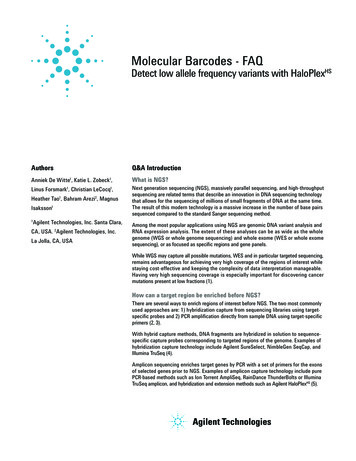
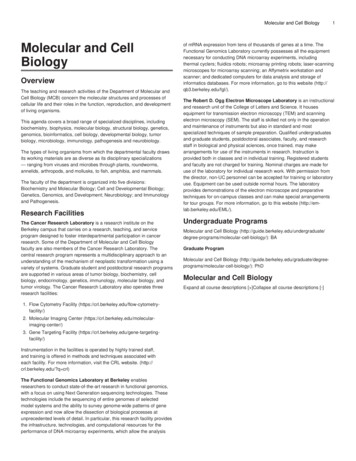
R55.4 Genome Biology 2006,Percentage of essential genes(a)Volume 7, Issue 7, Article R55Yu et al.90%80%P 1070%P 1060%-11HubsNon-hubs-20ite hubs should be more essential (Additional data file 1),which agrees well with our observation. Because of the limited statistics, we cannot determine whether there are additional reasons for the increased tendency of composite hubsto be essential (Supplementary Figure 1 in Additional data file1).50%40%P 0.02P 0.0430%20%10%0%Exp(b)35%Percentage of essential geneshttp://genomebiology.com/2006/7/7/R55IntMetP 0RegP 0.0530%25%20%15%10%5%0%Non-hubsHubsComposite hubsFigure 2of the essentiality of hubs and composite hubsAnalysisAnalysis of the essentiality of hubs and composite hubs. (a) Comparison ofthe percentages of essential genes in hubs and non-hubs in differentnetworks. P values measure the significance of differences between thepercentages for hubs and non-hubs. (b) Comparison of the percentages ofessential genes in non-hubs, hubs and composite hubs. In this figure, weexcluded all composite hubs when calculating the percentage for hubs.Due to the limited number of tri-hubs, we combined them with bi-hubs. Pvalues measure the significance of the differences between neighboringbars. Met, the metabolic network; Int, the interaction network; Exp, theco-expression network; and Reg, the regulatory network (in Figures 2 and3, we only consider the regulator population in the regulatory network).Composite hubs tend to be more essential than hubs insingle networksPrevious studies have shown that hubs are the scaffolding ofscale-free networks with great importance for their stability[12]. In particular, hubs in interaction networks tend to beessential [15], and they tend to be more conserved throughevolution than non-hubs [23]. Therefore, we next examinedthe fraction of essential genes among hubs and non-hubs indifferent networks. Not surprisingly, hubs in all networkstend to be essential (Figure 2a; here we only consider the regulator population within the regulatory network). The resultsagree well with previous studies [15,24]. Furthermore, weanalyzed the essentiality of composite hubs. Figure 2b clearlyshows that, while hubs in single networks (that is, normalhubs) tend to be essential compared with non-hubs, composite hubs have an even higher tendency to be essential thannormal hubs. Due to the essentiality of normal hubs, compos-In our analysis, composite hubs can be either bi-hubs (hubs intwo of the four networks) or tri-hubs (hubs in three of the fournetworks). We identified hubs and composite hubs in all fournetworks (Figure 3a). Considering only the regulator population of the regulatory network, we were able to identify 334bi-hubs and 23 tri-hubs. For example, GCN4 is a tri-hubinvolving interaction, co-expression, and regulatory networks. Gcn4p is a master regulator of amino acid biosyntheticgenes in response to starvation and stress, with 111 knowntargets [25]. It is known to interact specifically with RNApolymerase II holoenzymes, Adap-Gcn5p co-activator complex, and many other proteins (16 in total) [26]. GCN4 wasalso co-expressed with 134 other genes in the cell-cycle experiments of Cho et al. [6]. No proteins are hubs in all four networks, because most enzymes are not TFs. Finally, we canshow that the structure of biological networks in yeast is verydifferent from the most obviously corresponding structuresin social networks.Scaffolding of the regulatory network is different fromother networksBecause all four biological networks are scale-free (Figure 1a;here we only consider the regulator population within the regulatory network), it can be shown that they should share thesame hubs by chance alone due to hubs' essentiality (Additional data file 1). It is interesting to see whether this is indeedthe case for biological networks, that is, whether they are builton the same scaffolding.Our calculation shows that the scaffolding of three networks(metabolic, interaction and co-expression) tends to be thesame, that is, hubs in one network tend to overlap with thosein another when compared to random expectation (Figure3b). The results agree with previous studies showing thatinteracting proteins tend to be co-expressed [27-30]. Furthermore, we calculated the random expectation by taking intoconsideration the fact that hubs tend to be essential [15,24].We found that the hub overlap between networks could not beexplained by simply considering the essentiality of hubs (Supplementary Figure 2 in Additional data file 1).Surprisingly, hubs in the regulator network do not have thetendency to be hubs in other networks. Though counter-intuitive, this observation is reasonable in that most TFs and theirtargets do not tend to be co-expressed [31], and most TFs areunlikely to interact with their targets. Therefore, we dividedthe four networks into two classes: regulation and action. Theaction networks include the interaction, co-expression andmetabolic networks. It is clear that the cell separates theGenome Biology 2006, 7:R55
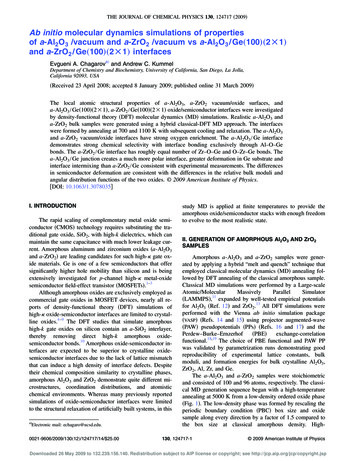
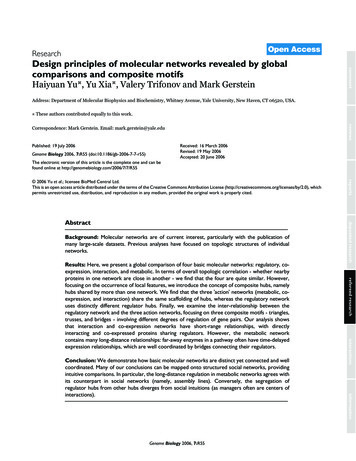
Genome Biology 22264384Met(b)reviewsHere we have excluded the comparison between regulatorand metabolic networks because the two networks only shareone common protein. It is possible to argue that our definition of hubs is somewhat arbitrary. But all results remain thesame even when we used different cutoffs to define hubs. Wefurther tested the functional composition of the overlappingproteins among networks, which is similar to that of eachindividual network and random expectation (SupplementaryFigures 3 and 4 in Additional data file 1).741 ExpcommentReg331249Yu et al. R55.5regulatory network from the action networks. Since all actionnetworks are governed by the regulatory network as discussed below, the separation potentially could provide stability to the cell (Supplementary Figure 5 in Additional data file1).(a)5Volume 7, Issue 7, Article R55Neighboring pairs in all action networks are coregulatedSWI4IDH132.5P 10-92-12P 0.021.5P 0.62P ed researchIn a truss, two proteins share the same feed-forward loop(FFL; Figure 4b). FFLs are robust against noise [32]. Previouswork has also shown that genes co-regulated by more thanone regulator tend to be tightly co-expressed [31]. Therefore,trusses are designed to maintain stable co-expressionbetween gene pairs. Their biological function is similar to thatof triangles.interactionsWe examined the distributions of the enrichment of trusses inall three combined networks. As expected, the three distributions share similar patterns with that of triangles (Figures4a,b). In all distributions, only connected pairs show enrichment of trusses, which further confirms the biological function of trusses. Given the fact that the regulatory network inyeast is far from complete, we believe that many actualinformationFigure 3of hub overlapsAnalysisAnalysis of hub overlaps. (a) Venn diagram describing hub overlapsbetween networks. Shaded areas represent composite hubs. (b) Foldenrichments of hub overlaps (O) between two networks relative torandom expectation. The bars above the line (where O 1) show thatoverlapping hubs between the two networks are more than expected. Theschematic above the first three bars shows that action networks tend toshare the same hubs. One of the tri-hubs is Idh1p, an isocitratedehydrogenase involved in the tricarboxylic acid cycle connecting anumber of different pathways [7]. It is also involved in a number ofcomplexes, and is thus co-expressed with many other genes [5,6,40,49]. Inthis schematic, the solid circle represents the composite hub; open circlesrepresent different proteins; black solid lines represent interactionrelationships; red dashed lines represent co-expression relationships;green dashed arrows represent metabolic reactions. The schematic abovethe last two bars shows that the regulatory network uses a distinct set ofhubs. For example, Swi4p is a major TF regulating the yeast cell cycle [50].However, it is not a hub in any of the action networks. In this schematic,the solid circle represents the regulatory hub; open circles representdifferent proteins; black solid arrows represent regulatory relationships. Pvalues measure the significance of the differences between the observedoverlaps and the random expectation. The random expectation wascalculated as described in Materials and methods. P values in this figure andall following figures were calculated using the cumulative binomialdistribution (Additional data file 1). Met, the metabolic network; Int, theinteraction network; Exp, the co-expression network; and Reg, theregulatory network (in Figures 2 and 3, we only consider the regulatorpopulation in the regulatory network).In a triangle, two genes (P1 and P2) are co-regulated by thesame regulator (TF). Therefore, triangles should tend to occurbetween co-expressed gene pairs (Figure 4a). Since interacting proteins and co-enzymes are known to be co-expressed[20,30], we expected to see that triangles are enrichedbetween the connected pairs in all three combined networks.Our results confirmed this expectation in that the percentageof triangles between connected pairs in all three networks aresignificantly higher than random, while the percentagebetween disconnected pairs is equal to or even lower thanrandom (Figure 4a). In other words, connected pairs in allthree networks tend to be co-regulated, which is in agreementwith our expectation and with previous studies [20,30,31].deposited researchOP 10reportsAbove, we separated the regulatory network from the others;now we show that the three action networks can be furthersubdivided into two groups (that is, short-range and longrange) based on how the genes in them are regulated by TFs.We investigated this through looking at composite motifswithin the combined regulatory-action network. We focusedon a few key motifs, which we call triangles, trusses, andbridges (see Materials and methods).Genome Biology 2006, 7:R55
R55.6 Genome Biology 2006,Volume 7, Issue 7, Article R55Yu et al.http://genomebiology.com/2006/7/7/R55(a)60%TF (BAS1)40%(ADE5,7) P1FkP2 (ADE8)20%0%110100Distance ( k )(b)4%3%F2%(MBP1)T1(CLN1)P1T2 (SWI4)kP2 (CLN2)1%0%110100Distance ( k )(c)15%(RAP1)T1(RPL3)P1T2 (BDF1)10%FkP2 (RPL9A)5%0%110100Distance ( k )IntRegMetRegFigure 4 (see following page)Genome Biology 2006, 7:R55ExpReg
Genome Biology 2006,http://genomebiology.com/2006/7/7/R55Volume 7, Issue 7, Article R55Yu et al. R55.7refereed researchinteractionsConclusionHere we examine the four most commonly studied networksin yeast. Previous work has shown that social networks sharecommon characteristics with biological networks [12-14]. Ourresults further confirm this. In particular, many commonsocial networks are related. We also found that biological networks, even though seemingly quite different, are clearlyrelated to each other. In social networks, people under thesame supervisor normally know each other, and, as such, mayGenome Biology 2006, 7:R55informationIn a bridge, protein P1 and regulator T2 are co-regulated by T1and, thus, should be co-expressed. Only after the gene of T2 isexpressed (transcribed) and translated can the protein product of T2 then bind to P2 and activate its expression. Therefore, the expressions of P1 and P2 should not besimultaneous, but rather have a time delay (SupplementaryFigure 9 in Additional data file 1). We expected that bridgeswould tend to occur between gene pairs that are closely functionally related, but not necessarily co-expressed. We calculated the distributions of the occurrence of bridges betweengene pairs with different distances in all three combined networks, (Figure 5a). The results are rather surprising, since, ininteraction and co-expression networks, the tendency offorming bridges between protein pairs decreases as theirdistance increases. However, the tendency of forming bridgesremains the same for enzymes with different distances in thesame metabolic pathways. The tendency stays significantlyhigher than random even for far-away pairs (SupplementaryTable 3 in Additional data file 1). Clearly, genes in the interaction and co-expression networks only have short-range regulatory relationships, whereas genes in the metabolic networkshave long-range ones. (Another unlikely but possible hypothesis for this result is that there is a subtle bias in the metabolicnetwork since it was mapped mostly based on small-scaleexperiments, unlike interaction and co-expression networks.)deposited researchDistant enzymes in the same pathway tend to havedelayed expressions mediated by regulator bridgesreportsInterestingly, it has been shown experimentally that trianglesand trusses can also generate temporal programs of expression by having serial activation coefficients with different targets, which is quite intuitive and reasonable [33,34]. It shouldalso be noted that some FFLs ('incoherent FFLs') could provide pulses and speeding responses, although the majority ofFFLs are coherent, acting as 'persistence detectors' [35,36].We then analyzed the composite motifs in the combinedmetabolism-co-expression network. Figure 5b shows that coenzymes tend to be co-expressed, and the tendency of coexpression decreases as the distance between the enzymesincreases. On the other hand, enzymes in different steps ofthe same pathway tend to have expression relationships otherthan co-expression, typically time-delayed relationships(Supplementary Figure 7c in Additional data file 1). This tendency increases as the distance increases. The likelihood forfar-away enzymes in the same pathway to have other expression relationships is significantly higher than randomexpectation. This observation shows that enzymes in thesame pathway are not necessarily co-expressed; nevertheless,their expression needs to be well-coordinated for the wholepathway to function normally. This is the reason why bridgesare enriched in disconnected enzyme pairs in the metabolicnetwork (Figure 5a). Similar results were also found in othertime-course expression experiments [37], but not in the interaction network (Additional data file 1). This conclusion is further supported by a specific case study in Escherichia coliamino acid biosynthesis pathways [33]. As we mentionedabove, metabolic pathways in the cell are very similar toassembly lines in a factory. It is reasonable to assume that,without decreasing the efficiency of the whole assembly line,workers at downstream steps of the line do not have to showup for work until those at upstream steps have finished theirjob. Similarly, in terms of metabolic pathways, we observedthat enzymes at downstream steps tend to be expressed afterthose at earlier steps. The bridge motifs are designed to manage such expression relationships between enzymes, and,therefore, to maintain normally functioning metabolic pathways in the cell.reviewstrusses are missed by our analysis because some of the edgesare missing in our dataset. To confirm this, we also looked atsemi-trusses. A semi-truss is a truss with only one FFL (Figure 4c). We believe that many of these semi-trusses are actually full trusses given the incomplete nature of our dataset.Figure 4c shows highly similar results to those in Figure 4b,thus providing support for our conclusion.commentFractionFigure 4(F) of all P1-P2 pairs at distance k in a given combined network in a particular composite motifFraction (F) of all P1-P2 pairs at distance k in a given combined network in a particular composite motif. Horizontal dashed lines indicate the randomexpectation. Vertical dashed lines indicate connected pairs in combined networks. (a) Triangles. The schematic shows that a triangle consists of threeproteins: the common regulator TF regulates both P1 and P2. In all schematics, circles represent TFs, and rectangles represent non-TF genes. For example,ADE5, 7 and ADE8 are two subsequent enzymes in the purine biosynthesis pathway [7]. They are co-regulated by BAS1 [51]. (b) Trusses. The schematicshows that a truss consists of four proteins: T1 regulates T2, P1 and P2; T2 regulates P1 and P2. For example, Cln1p and Cln2p are two subunits of theCDC28-associated complex [4]. They are co-regulated by Mbp1p and Swi4p [52]. Mbp1p also regulates SWI4 [8,53]. (c) Semi-trusses. A semi-truss is anincomplete truss: either T2 does not regulate P1, or T1 does not regulate P2. For example, RPL3 and RPL9A, components of the ribosome large subunit,are co-expressed [6]. They are co-regulated by Bdf1p [54]. Rap1p regulates both RPL3 and BDF1 [8,55]. We also examined the occurrence of triangles andtrusses between protein pairs connected in more than one network, termed highly combined networks. We only considered semi-trusses to get betterstatistics, since the number of full trusses in highly combined networks is too small to be used. In all highly combined networks, triangles and semi-trussesare enriched between protein pairs connected in more than one network (Figure 8 in Additional data file 1). Met, the metabolic network; Int, theinteraction network; Exp, the co-expression network; and Reg, the regulatory network.
R55.8 Genome Biology 2006,Volume 7, Issue 7, Article R55Yu et al.ously has some differences from that of social networks. In anormal social context, it is reasonable to assume that a supervisor knows his or her staff. Therefore, supervisors with largestaffs (that is, hubs in the social hierarchy) tend to be hubs inacquaintance networks. This is not the case for biological networks: the regulatory network uses a different set of hubsthan the action 8)Int-RegMet-RegExp-Reg-13P 1020%0%0246(b)810Distance ( k )1214161810%8%Co-expressedOther relationshipsExpression relationships6%P1FkP24%-3P 102%0%0246Distance ( k Fractionparticular5(F) compositeof all P1-P2motifpairs at distance k in a given combined network inFraction (F) of all P1-P2 pairs at distance k in a given combined network ina particular composite motif. Horizontal dashed lines indicate the randomexpectation. (a) Bridges. The schematic shows that a bridge consists offour proteins: T1 regulates T2 and P1; T2 regulates P2. For example, Fol2pand Pho8p are two subsequent enzymes involved in the folate biosynthesispathway [7]. FOL2 is regulated by Yox1p [9]. PHO8 is regulated by Pho4p[56]. Yox1p also regulates PHO4 [9]. The P value in the figure indicates thesignificance of the different between the fraction of bridges between alldisconnected enzyme pairs and the random expectation (Table 3 inAdditional data file 1). The regression equation for Met-Reg: F 0.003k 0.18; R 0.56; P 0.01. The regression equation for Int-Reg: F -0.01k 0.19; R 0.74; P 10-3. The regression equation for Exp-Reg: F -0.01k 0.24; R 0.93; P 10-9. P values here measure the significance of theco
Genome Biology 2006, 7:R55 comment reviews reports deposited research refereed research interactions information 2006Yuet al.Volume 7, Issue 7, Article R55Research Open Access Design principles of molecular networks revealed by global