Transcription
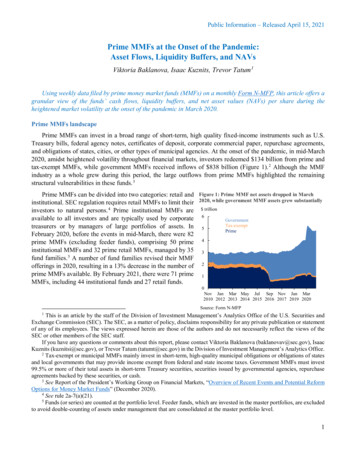
Public Information – Released June 23, 2022Prime MMFs’ Asset Composition and Asset SalesViktoria Baklanova, Isaac Kuznits, Trevor Tatum 1This study analyzes portfolio holdings data filed by prime money market funds (MMFs) on Form NMFP to gain insights about these funds’ portfolio composition in March 2020 through the present. Theanalysis also includes data filed on Form N-CR, which is used for current reporting of MMFs’ materialevents such as sales of securities to affiliated firms, and data about the Money Market Mutual FundLiquidity Facility (MMLF). The analysis shows that since March 2020 prime MMFs increased theirholdings of government securities and repurchase agreements (repos) overall. Allocations to credit-relatedsecurities issued by banks and other types of firms may differ substantially among prime MMF categories.Prime MMF investmentsPrime MMFs invest in a broad range of short-term, high quality fixed-income instruments. Since 2010,the SEC has required all MMFs to report their portfolio holdings on a monthly basis and classify eachholding in one of the 18 asset categories (see Appendix A for a full list of asset categories). 2 Historicalfilings show that prime MMFs typically hold a mix of securities across all 18 categories. As of February2022, prime MMFs held most of their assets in repos (22% of the total), followed by investments in financialCP (19% of the total) and U.S. government securities (17% of the total) (Figure 1). 3Figure 1: In recent years, prime MMFs have invested a larger share of assets in government securities and repos 2019Oct2019Jan2020Apr2020Jul2020Oct2020Jan2021U.S. governmentRepoCDTDFinancial CPABCPNonfinancial CPFAInvestment companyNon-U.S. sovereign/supranationalOther ABSOther instrumentOther muniTOBVRDNNote: "Repo" shows the total of MMF investments in Treasury repos, government agency repos, and other repos.Source: Form N-MFPThis is an article by the staff of the Division of Investment Management’s Analytics Office of the U.S. Securitiesand Exchange Commission (SEC). The SEC, as a matter of policy, disclaims responsibility for any private publicationor statement of any of its employees. The views expressed herein are those of the authors and do not necessarily reflectthe views of the SEC or other members of the SEC staff.If you have any questions or comments about this report, please contact Viktoria Baklanova(baklanovav@sec.gov), Isaac Kuznits (kuznitsi@sec.gov), or Trevor Tatum (tatumt@sec.gov) in the Division ofInvestment Management’s Analytics Office. Daniel Hiltgen of the SEC Division of Economics and Risk Analysisprovided helpful comments.2See Form N-MFP, Item C.6.3Repo – repurchase agreement, CD – bank certificates of deposit, TD – bank time deposit, CP – commercialpaper, ABCP – asset-backed commercial paper, ABS – asset-backed securities, FA – insurance company fundingagreement, muni – municipal securities, TOB – tender option bond, and VRDN – variable rate demand note.11
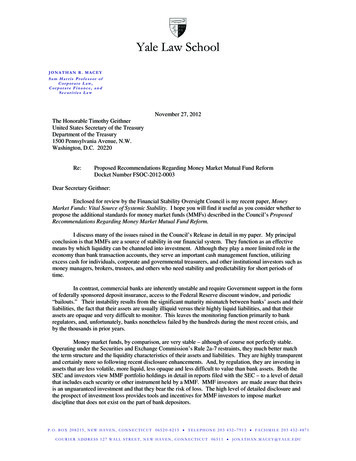
Public Information – Released June 23, 2022Average portfolio compositionschange over time in response to marketevents and other factors. For example,at the end of 2016, followingimplementation of the 2014 MMFreforms, prime MMFs held close to30% of their total assets in CD and15% of their total assets in U.S.government securities. The share ofgovernment securities in prime MMFsincreased markedly at the onset of theCOVID-19 pandemic in early 2020,reaching an all-time high of 38% ofthese funds’ portfolios in August2020. 4 On the other hand, the share ofCD declined to 15% in August 2020and was at 14% in February 2022.Figure 2: In February 2022, prime retail MMFs invested 74% of theirassets in banks' CD/TD, financial CP, and ABCPU.S.government1%Repo16%Other5%Financial CP27%Nonfinancial CP5%CP39%CD/TD39%ABCP7%Source: Form N-MFPFigure 3: In February 2022, prime institutional MMFs offered to thepublic invested over 70% of their assets in banks' CD/TD, financial CP,and ABCPU.S.governmentOtherRepo5%Nonfinancial7%Filing data show that the portfolio13%CPcomposition of prime MMFs also4%depends on the type of shareholders ofFinancial CPthe fund. As of February 2022, prime21%retail MMFs – those funds limitingCP31%their investors to natural persons –invested the majority of their totalABCP6%CD/TDassets (74%) in securities issued by44%banks and other financial firms,including CD/TD, financial CP, and Source: Form N-MFPABCP (Figure 2). Prime institutionalMMFs offered to the public – whichare typically used by large institutions Figure 4: In February 2022, prime institutional nonpublic MMFs investedclose to 70% of their assets in U.S. government securities and repos– allocated over 70% of their totalU.S. governmentassets to securities of banks and other37%Otherfinancial firms (Figure 3). However,Nonfinancial CP0%8%prime institutional MMFs that are notoffered to the public and are managedFinancial CP14%to benefit affiliated funds and accountsCP22%invested close to 70% of their assets inU.S. government securites and repos, aABCPmuch larger share than that of otherRepo0%CD/TD32%types of prime MMFs (Figure 4 ).9%Source: Form N-MFPSee Baklanova, Kuznits, and Tatum “How Do Prime MMFs Manage Their Liquidity Buffers?” SEC StaffAnalysis (July 2021).42
Public Information – Released June 23, 2022Most assets are held to maturityMMFs invest in securities that mature within 397 days and are required to maintain a dollar-weightedaverage portfolio maturity (WAM) that does not exceed 60 calendar days and a dollar-weighted averageportfolio life (WAL) that does not exceed 120 calendar days. 5 In practice, MMFs often maintain WAM andWAL well below the regulatory limits. For example, as of February 2022, prime retail MMFs had averageWAM of 27 days and average WAL of 46 days, while prime institutional MMFs had average WAM of 23days and average WAL of 45 days. Given the short-term nature of MMF portfolios, most assets are held tomaturity and the proceeds from maturing securities are normally reinvested in similar securities in theabsence of redemption requests.Prime MMF assets sales in March 2020Estimates based on Form N-MFP suggest that in March 2020 prime MMFs liquidated a higher thanaverage proportion of assets. This is consistent with the reports of prime MMFs raising liquidity to meetincoming redemptions and to maintain weekly liquid assets above the regulatory threshold of 30% of totalassets. 6 The recent SEC Money Market Fund Reforms proposing release explains that in March 2020,publicly offered prime institutional MMFs disposed of 15% of their total investments prior to maturity,significantly higher than a 4% monthly average during the period from October 2016 through February2020. 7However, estimates of asset liquidations are sensitive to assumptions and may result in a range ofresults. The current Form N-MFP provides month-end snapshots of portfolio holdings by MMFs, whichdoes not provide visibility into purchases and sales of securities during the month and potentially underestimates asset sales. To facilitate monitoring of prime money market funds’ liquidity management andsecondary market activities, the SEC recently proposed to require prime MMFs to report information aboutthe amount of portfolio securities sold or disposed of during the month, among other changes to MMFregulation. 8Analysis of changes in prime MMF portfolio holdings in March 2020 suggests that CP and banks’ CDwere the largest asset classes not held to maturity. The SEC Money Market Fund Reforms proposing releaseprovides the estimate that, based on Form N-MFP filings, around 24 billion in CD and around 28 billionin CP were not held to maturity. In addition to potential sales in the secondary market, the reduction in CDand CP holdings includes sales of these assets to affiliated banks and sales under the terms of the MoneyMarket Mutual Fund Liquidity Facility (MMLF). The Federal Reserve established the MMLF on March18, 2020 to provide loans on advantageous terms to financial institutions purchasing securities from money5See rule 2a-7(d)(1). Adjustable rate government securities may have longer final maturity dates under certainconditions. See rule 2a-7(i)(1).6See Baklanova, Kuznits, and Tatum “Prime MMFs at the Onset of the Pandemic” SEC Staff Analysis (April2021).7See Money Market Fund Reforms, Rel. No. IC-34441 (December 15, 2021). These estimates include the assetssold to affiliated banks and pledged to the Money Market Mutual Fund Liquidity Facility.8Id.3
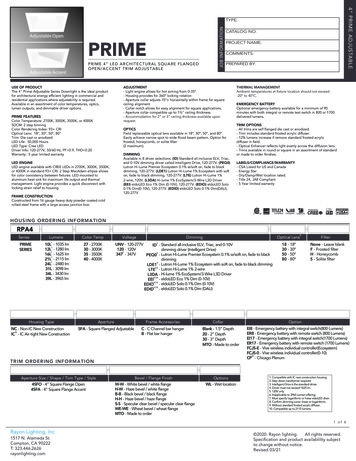
Public Information – Released June 23, 2022market funds. 9 MMLF operations started on March 23, Figure 5: Prime institutional MMFs offered to the2020, with the last transaction occurring on April 23, public are the largest MMF type selling assets underMMLF terms2020. 10Filings on Form N-CR by three prime MMFs inMarch 2020 showed that these funds soldapproximately 4 billion of securities to affiliatedbanks, including around 1.2 billion of CP and around 2.8 billion of CD. 11 In addition, in March 2020, 47prime MMFs sold around 33 billion of CP and 16billion of CD to financial institutions under the termsof the MMLF.12 These sales accounted for close to 85%of the 58 billion in total MMLF loans extended duringits time in operations. billion50CD CP ABCP Municipal (left)% of participating funds'net assets (right)15%4010%30205%100Prime instnonpublicPrime instpublicPrime retail TE instTE retail0%The Federal Reserve’s recent disclosures Note: TE - tax-exempt MMFs. Net assets as of February 29, 2020.Source: Form N-MFP, Federal Reserveconcerning the MMLF and other lending facilitiesestablished in response to the COVID-19 pandemic shows that all categories of eligible MMFs sold assetsunder the terms of the facility. 13 Prime institutional MMF offered to the public accounted for the largestshare of these sales (73%), prime retail MMFs accounted for 24%, and prime institutional nonpublic MMFsaccounted for only 1% of the sales (Figure 5).Figure 6: Estimated asset liquidation by prime MMFsin March 2020 based on Form N-MFP data is close insize to the amount of reported sales to affiliated banksand reported MMLF billion60CD CP (incl. ABCP)40200Estimated MMF salesN-CR salesMMLFSource: Form N-MFP, Form N-CR, Federal ReserveFor additional perspective, in February 2020, primeretail MMFs had the largest share of net assets ( 473billion), followed by public prime institutional MMFs( 386 billion), and by prime institutional nonpublicMMFs (close to 250 billion). Assets pledged to theMMLF accounted for a larger share of participatingprime institutional public MMFs net assets (12%),followed by prime retail MMFs (7%). Tax-exempt retailand institutional MMFs only accounted for a very smallpart of MMLF pledges, 2% and 0.3%, respectively.It appears that estimates of prime MMF assetliquidation in March 2020 using February 2020 andMarch 2020 Form N-MFP filings are close in size to thetotal sales to affiliated banks reported on Form N-CRand the reported amount of MMLF loans (Figure 6).Information about the MMLF is available on the Federal Reserve’s website lf.htm. MMLF ceased extending credit on March 31, 2021.10See Anadu, Cipriani, Craver, and La Spada “The Money Market Mutual Fund Liquidity Facility” (September2021).11See Form N-CR filings in the SEC EDGAR system.12See supra footnote 10. This is slightly lower than the amount the Commission previously estimated was pledgedto the MMLF in March 2020 ( 53 billion). See supra footnote 7, at n.57 and accompanying text. Since the time ofthat earlier estimate, additional data about the MMLF has become available.13See Federal Reserve, Disclosures Regarding the Emergency Lending Response to COVID-19, Pursuant toSection 11(s) of the Federal Reserve Act (March 31, 2022).94
Public Information – Released June 23, 2022However, a survey of prime MMFs conducted by an industry group provides a higher estimate of assetsales by prime MMFs in March 2020 as it includes daily data about CP and CD sales prior the MMLFoperations. 14 The survey showed that sales of these assets during the period from March 2 through March18 amounted to 23 billion. These sales together with the amount of reported sales to affiliated banks andreported MMLF loans exceed the estimates derived solely from Form N-MFP underscoring the need forbetter, more granular data about assets sales by prime MMFs.See Comment Letter of the Investment Company Institute (April 12, 2021). The survey provides a detailedbreakdown of daily CP and CD sales and purchases by prime institutional MMFs and prime retail MMFs from March2, 2020 thought March 18, 2020.145
Public Information – Released June 23, 2022Appendix A1. U.S. Treasury Debt;2. U.S. Government Agency Debt;3. Non-U.S. Sovereign, SubSovereign and Supra-National debt;4. Certificate of Deposit;5. Non-Negotiable Time Deposit;6. Variable Rate Demand Note;7. Other Municipal Security;8. Asset Backed Commercial Paper;9. Other Asset Backed Securities;10. U.S. Treasury Repurchase Agreement if collateralizedonly by U.S. Treasuries (including Strips) and cash;11. U.S. Government Agency Repurchase Agreementcollateralized only by U.S. Government Agencysecurities, U.S. Treasuries, and cash;12. Other Repurchase Agreement if collateral falls outsideTreasury, Government Agency, and cash;13. Insurance Company Funding Agreement;14. Investment Company;15. Financial Company Commercial Paper;16. Non-Financial Company Commercial Paper;17. Tender Option Bond; or18. Other Instrument.6
2022, prime MMFs held most of their assets in repos (2 2% of the total), followed by investments in financial CP (19% of the total) and U.S. government securities (17% of the total) (Figure 1). 3. 1. This is an article by the staff of the Division of Investment Management's Analytics Office of the U.S. Securities